Abstract
Benthic O2 availability regulates many important biogeochemical processes and has crucial implications for the biology and ecology of benthic communities. Further, the benthic O2 exchange rate represents the most widely used proxy for quantifying mineralization and primary production of marine sediments. Consequently, numerous researchers have investigated the benthic O2 dynamics in a wide range of environments. On the basis of case studies – from abyssal sediments to microbial phototrophic communities – I hereby try to review the current status on what we know about controls that interrelate with the O2 dynamics of marine sediments. This includes factors like: sedimentation rates, bottom water O2 concentrations, diffusive boundary layers, fauna activity, light, temperature, and sediment permeability. The investigation of benthic O2 dynamics represents a challenge in resolving variations on temporal and spatial scales covering several orders of magnitude. Such an effort requires the use of several complementary measuring techniques and modeling approaches. Recent technical developments (improved chamber approaches, O2 optodes, eddy-correlation, benthic observatories) and advances in diagenetic modeling have facilitated our abilities to resolve and interpret benthic O2 dynamics. However, all approaches have limitations and caveats that must be carefully evaluated during data interpretation. Much has been learned during the last decades but there are still many unanswered questions that need to be addressed in order to fully understand benthic O2 dynamics and the role of sediments for marine carbon cycling.
Published in collaboration with the University of Bergen and the Institute of Marine Research, Norway, and the Marine Biological Laboratory, University of Copenhagen, Denmark
Introduction
Oxygen is a prerequisite for higher fauna and flora and is a central molecule for global element cycling. Oxygen is produced during photosynthesis, and consumed directly or indirectly during the degradation of organic material. Thus, O2 represents an excellent tracer for biological activity. The availability and turnover of O2 is an absolute key measure when evaluating the biological status of the environment and the cycling of important elements such as carbon, nitrogen, phosphorus, sulfur and metals – locally as well as globally. The distribution and availability of O2 in the oceans has thus received considerable scientific attention for many years.
Marine ecosystems basically consist of two very different compartments; the water column and the sediment matrix. The global volume of the pelagic compartment with an average water depth of 3800 m by far exceeds the size of the upper decimeters of the benthic compartment, which host most of the biological activity. However, the volume-specific production and degradation of organic material in surface sediments, hosting high densities of microbes and metazoans, are typically 100–1000 times higher than the corresponding values for the water column. Especially in coastal, light-exposed sediments the microbial activity (photosynthesis and respiration) of the upper millimeters or centimeters of the sediment can be quantitatively more important than the integrated activity of the entire water column. In shelf areas, it is estimated that 15–50% of the pelagic primary production reaches the sediment (e.g. Canfield Citation1993; Wollast Citation1998) and here benthic mineralization plays an important role for the recycling of nutrients and carbon. On a global scale, the balance between burial and mineralization of the organic carbon reaching the sediment has important implications for the O2 and CO2 concentration of the biosphere and, on geological time-scales, profound impact on climatic conditions and life as we know it today (Berner Citation1980, Citation1987; Berner & Canfield Citation1989; Archer & Meier-Reimer Citation1994). It is thus highly relevant to quantify the benthic turnover rates of organic material and to investigate the controls regulating the involved process rates – O2 availability is one important key aspect of this highly complex task (e.g. Canfield Citation1994; Hulthe et al. Citation1998; Kristensen & Holmer Citation2001).
In areas where the seafloor is situated below the depth of the photic zone, organic material is mainly supplied from the overlying water column in the form of agglutinated phytoplankton aggregates, fecal pellets and carcasses. Some of the material is digested by metazoans, but generally microbial-mediated carbon degradation is quantitatively more important for the turnover of the settling material (e.g. Glud et al. 2003). Prokaryotes cannot assimilate molecules larger than 500–600 Dalton (Weiss et al. Citation1991) and thus benthic microbial degradation is initiated by extracellular depolymerization of exoenzymes released to the interstice or attached to the cell surface. Smaller organic molecules can be completely mineralized to CO2 by a wide range of aerobic heterotrophic bacteria. However, anaerobic heterotrophic bacteria generally use a narrower spectrum of substrates and thus rely on fermentative transformation products of other microbes providing a more uniform pool of low molecular organic substances for their metabolism (Canfield et al. Citation2005).
Thermodynamically, O2 represents the most favorable abundant electron acceptor available, but seawater contains little O2, and this oxidant is soon depleted and generally only extends a few millimeters or centimeters into the sediment. In many environments, benthic carbon degradation is therefore mainly mediated anaerobically by microbes using nitrate, manganese oxides, iron oxides or sulfate as electron acceptors. In the absence of these oxidants, organic carbon can also be degraded via methanogenesis, but the process does not represent a net oxidation of organic carbon (Fenchel et al. Citation1998). Typically, sediments reflect a vertical redox zonation where the electron acceptors overall are depleted in the order outlined above, reflecting the potential energetic gain related to the respective redox processes (Froelich et al. Citation1979). However, due to faunal activity most marine sediments are heterogeneous and vertical profiles of area-integrated process rates often reflect extensive overlapping zonation of the different heterotrophic pathways (Canfield et al. Citation1993; Kostka et al. Citation1999). The relative importance of the respective oxidation pathways depend on the sedimentation and bioturbation rate, the sediment and the water chemistry, but each have been found to dominate in different environments (Thamdrup & Canfield Citation2000 and references therein). The reduced products from anaerobic degradation are, to a large extent, reoxidized by O2. This occurs either directly or via a redox-cascade involving a series of complex abiotic and microbial catalysed redox processes (Fenchel & Jørgensen Citation1977; Jørgensen Citation2000). Benthic O2 consumption is thus used (1) for aerobic heterotrophic activity of fauna and bacteria, and (2) for the reoxidation of reduced inorganic products released during the anaerobic heterotrophic degradation. There is no direct way to quantify the relative importance of the two O2-consuming processes, but the two extremes are represented by microbial mats of the chemolithotrobic bacteria Beggiatoa sp. where >90% of the O2 is used for sulfide oxidation (Jørgensen Citation1982) and the abyss where benthic mineralization of the very low input of organic material can be almost completely covered by the available O2 (Bender & Heggie Citation1984).
To the extent reduced inorganic solutes from anaerobic mineralization are fully oxidized within sediments, the total benthic O2 uptake (TOU) represents a proxy of the total benthic carbon mineralization (Canfield et al. Citation1993) (). The approach ignores minor electron sinks like N2 release from denitrification and burial of sulfide (mainly in the form of pyrite); however, these two processes rarely represent more than 15% of the electron equivalents of the total carbon mineralization (Jørgensen Citation1982; Canfield et al. Citation2005). The approach also does not account for the O2 equivalents used for nitrification which at maximum can be ∼20% of the O2 consumption during fully aerobic oxidation of typical sedimentary organic material with a Redfield C:N ratio of 8–12 (Anderson & Sarmiento Citation1994). Conveniently, the two minor components not accounted for when using the benthic O2 uptake as a proxy for the total carbon degradation counteract each other and are often assumed to cancel each other out. They can, however, also be accounted for by including the processes in the stoichiometry used to convert the O2 exchange rates to the CO2 exchange (see below). Alternatively, the nitrification, denitrification and pyrite burial can be determined independently for a given setting if a more accurate determination of the total carbon mineralization is required.
Figure 1. A schematic presentation of some important diagenetic processes in marine sediments (inspired by Fenchel & Jørgensen Citation1977).
A more serious problem of transforming TOU into total carbon mineralization rates is the assumption that the production and the oxidation of reduced solutes from the anaerobic degradation are at steady state. In many environments, reduced equivalents from anaerobic mineralization accumulate on a seasonal (or diel) basis, and the ‘O2 debt’ is repaid during less productive periods or resuspension events. This has to be kept in mind when a given O2 exchange rate is recalculated into a total carbon oxidation rate. Thus, it is advantageous to measure the release of dissolved inorganic carbon (DIC) along with the O2 uptake rate, as DIC represents the ultimate product of organic carbon oxidation (Anderson et al. Citation1986; Hulth et al. Citation1997). The ratio between simultaneously determined DIC and O2 exchange rates provides a tool for evaluating to what extent production and oxidation of reduced species from anaerobic mineralization are at steady state and balanced at the time of investigation, and the ratio can vary extensively on a seasonal basis especially in shallow eutrophicated environments (Therkildsen & Lomstein Citation1993). In essence the DIC exchange rate provides a more correct estimate of the concurrent mineralization rate and thus reflects a high seasonal variation whereas TOU integrates the mineralization activity over a longer – not always well defined – time span and thereby exhibits lower temporal dynamic (e.g. Therkildsen & Lomstein Citation1993). Integrated annually the exchange rates converge and the DIC/O2 exchange ratio approaches the average oxidation state of the carbon being mineralized. When converting the O2 exchange rates into carbon oxidation rates the DIC/O2 exchange ratio is typically assumed to range between 0.8 and 1.2 (e.g. Smith Citation1989; Therkildsen & Lomstein Citation1993; Hammond et al. Citation1996; Roden & Wetzel Citation1996). DIC exchange determinations are generally less accurate as they are based on discrete sampling – and in environments of low diagenetic activity the analytic precision may not always match the small DIC exchange rates. DIC analysis on recovered water samples collected during chamber incubations are time consuming, and the inorganic carbon dynamics can be confounded by dissolution or precipitation of carbonates (e.g. Green et al. Citation1993). However, at reactive sites the carbonate dissolution–precipitation dynamic can be accounted for by concurrent determination of the Ca2 + or alkalinity exchange rate (Anderson et al. Citation1986; Ståhl et al. Citation2004c). There are pros and cons of using both the O2 and the DIC exchange rates for assessing the benthic mineralization rate, and if possible combined determinations are to be preferred. However, TOU determinations remain the most widely used robust approach for assessing benthic carbon mineralization.
Measurements of benthic oxygen uptake rates
Benthic O2 exchange rates are most commonly determined by enclosure techniques (, upper panel). Here the initial O2 decrease rate of an overlying well-mixed water phase is approximately linear, and the TOU is calculated, accounting for the enclosed area and the water volume. Even though the initial decrease in O2 concentration is inseparable from a linear decline it is in fact non-linear as the O2 availability in the sediment declines with the concentration of the overlying water (Bender et al. Citation1989). This becomes especially apparent in elongated core or chamber incubations where the overlying water is approaching anoxia. Assuming depth-independent O2 consumption rates and that O2 in essence was consumed by aerobic heterotrophic activity, Hall et al. (Citation1989) suggested applying exponential curve fitting to access the initial O2 decline rate. However, in most sediments a significant fraction of the O2 consumption is related to reoxidation processes and in such instances more sophisticated biogeochemical modeling is required to fully evaluate the benthic O2 dynamic (Jørgensen and Boudreau Citation2001; Berg et al. Citation2003b). Elongated chamber incubations include conditions within the surface sediment where the O2 consumption dynamics poorly represent the initial conditions and shifts in fauna activity related to the decline in O2 concentration may further complicate matters. Thus it is ‘a priori’ difficult to predict the most appropriate function describing the elongated O2 decline of a sealed sediment enclosure as it is the net result of a complex, transient shift in mobile reactions within the sediment (see below) combined with variations in fauna activity. By far most studies apply a linear approximation to the initial O2 decline (with R2 values well above 0.95) and in reality this is fully applicable if the O2 concentration does not sink below 10–15% of the initial starting point. The enclosure approach quantifies the total O2 exchange rate across the benthic interfaces including O2 consumption related to fauna activity (Rasmussen & Jørgensen Citation1992).
Figure 2. The two most common procedures for quantifying benthic O2 exchange rates. The upper panel shows an enclosed sediment core and the discrete recordings of an O2 sensor inserted into the well-mixed overlying water phase. The TOU is calculated from the area of the enclosed sediment (A) and the volume of the enclosed water (V) and the rate by which O2 is consumed. The lower panel depicts microscale O2 measurements across the sediment–water interface (horizontal black line) while the O2 concentration of the overlying water is kept constant. From such profiles the DOU can be calculated from the concentration gradient either within the DBL or just below the sediment surface applying the relevant transport coefficient, the molecular diffusion coefficient (Do) or the lower, tortuosity-corrected transport coefficient in the sediment (Ds). The volume-specific O2 consumption rate (Rvol) depicted by the grey boxes can be derived from Fick's second law of diffusion, i.e. the curvature of the profiles. Typically such calculations reflect intensified activity at the top and bottom of the O2 microprofiles due to organic enrichment and high reoxidation rate in the two zones, respectively.
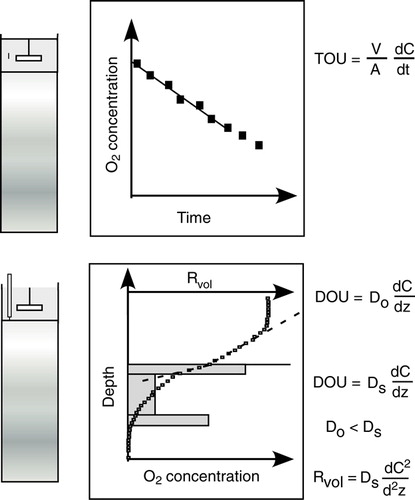
For impermeable sediments the diffusion-mediated benthic O2 uptake can be calculated from O2 microprofiles by different approaches. The most common procedure calculates the diffusive O2 uptake rate (DOU) from a linear approximation to the O2 concentration gradient resolved within the diffusive boundary layer (DBL – see below) or just below the sediment–water interface applying Fick's first law of diffusion. More recently a non-linear approximation to the DBL gradient was suggested to accommodate apparent higher-order hydrodynamic processes in the DBL (Nishihara & Ackerman Citation2007). Alternatively, the volume-specific O2 consumption (Rvol) can be determined from the convex-upwards-shaped porewater profile using Fick's second law of diffusion, and the DOU can be calculated accounting for the O2 penetration depth (or in case Rvol turns out to be depth-dependent accounting for the thickness of the respective depth interval) (, lower panel). Several procedures facilitating the latter approach exist (Nielsen et al. Citation1990; Berg et al. Citation1998), but in contrast to calculations based on the concentration gradient of the DBL, sediment-based calculations all rely on an independently determined solute transport coefficient of the sediment (). Therefore, the DBL approach is preferred for simple exchange measurements, while the second approach may provide insight in depth variations of Rvol. TOU should in principle always be equal to or larger than the DOU as TOU = DOU + BMU, where BMU represent any benthos mediated O2 uptake, which includes fauna respiration and irrigation.
Clark type microelectrodes are excellent tools for measuring O2 microprofiles or to follow O2 changes in enclosed water volumes (Revsbech & Jørgensen Citation1986). However, optical O2 determination, taking advantage of the ability of O2 to act as a dynamic quencher of the luminescence from certain indictor dyes, represent an interesting alternative to polarographic O2 measurements (Klimant et al. Citation1995). The so-called micro-optodes simply consist of immobilized O2-sensitive luminescent chemistry fixed to the tip of a tapered fiber. Excitation light is guided towards the sensor tip via the fiber and a fraction of the O2-sensitive luminescent signal is guided in the opposite direction towards the measuring instrument (Klimant et al. Citation1995). Optodes offer an interesting alternative due to simpler manufacturing and superior long-term stability especially if combined with life-time base sensing schemes (Klimant et al. Citation1995, Citation1997b; Holst et al. Citation1997; Tengberg et al. Citation2006). The introduction of micro-optodes to aquatic biology inspired the development of planar optodes, where the O2 quenchable luminescent chemistry is immobilized on transparent support foils that can be placed along e.g. an aquarium wall. Excitation light is supplied from the outside and by using a digital camera the O2-sensitive luminescence is imaged and converted into O2 images (Glud et al. Citation1996b). Transparent optodes can be applied and this greatly facilitates alignment between patterns in the O2 distribution and structures of the sediment (Holst & Grünwald Citation2001; Frederiksen & Glud Citation2006). Different sensing chemistries and imaging set-ups have been developed to meet the requirements of various specific experimental conditions (e.g. Holst et al. Citation1998; Precht et al. Citation2004; König et al. Citation2005; Oguri et al. Citation2006; Schröder et al. Citation2007).
Total O2 exchange rates and O2 microprofiles can be measured on recovered sediment cores in laboratory set-ups that maintain in situ temperature, in situ bottom water O2 concentration and a well-mixed overlying water phase (Rasmussen & Jørgensen Citation1992) – this is of utmost importance to obtain trustworthy results. Alternatively, the measurements can be obtained in situ by diver-operated modules or for deeper water by so-called autonomous benthic lander systems that carry benthic chambers and profiling units to the seafloor (Smith Citation1978; Reimers Citation1987) (). In recent years, optodes have been adapted to lander modules (Glud et al. Citation1999b; Wenzhöfer et al. Citation2001b; Tengberg et al. Citation2006) and inverted camera periscopes (Rhoads & Germano Citation1982) have been used to perform in situ planar optode measurements (Glud et al. Citation2001, Citation2005). For a review of in situ O2 measurements see Glud et al. (Citation2000a).
Figure 3. The top, left panel shows the deployment of a benthic lander carrying a chamber for in situ incubations, while the top, right panel shows a lander equipped with a microprofiling and planar optode module. The bottom, left panel shows the chamber after recovery from 3000 m water depth. Subsamples of the recovered diatom ooze are being extracted. The bottom, right panel shows an in situ microsensor array of microelectrodes for measuring O2, pH, H2S and resistivity (the central pipette ball covers a reference electrode for the pH measurements).
Initial comparison between O2 microprofiles measured shipboard and in situ at water depths >1000 m indicated that core recovery introduced artifacts that affected the benthic O2 distribution (Reimers et al. Citation1986; Reimers Citation1987). The differences were mainly explained by disturbance of the sediment structure during core recovery and improper establishment of in situ conditions during the onboard measurements. More detailed inter-comparisons clearly revealed that shipboard O2 microprofile measurements overestimated the DOU and underestimated the O2 penetration depth at water depth >600 m (). The maximum difference was observed at 5000 m water depth where the DOU measured in the laboratory was 3.5 times higher than the in situ value while the O2 penetration depth in the recovered sediment cores was only 20% of the one measured in situ (Glud et al. Citation1994a; Epping et al. Citation2002). Furthermore, it was observed that after re-establishing in situ conditions in the laboratory (i.e. temperature and bottom water O2 concentration) the O2 microprofiles gradually reshaped into the in situ microprofiles (Glud et al. Citation1999a). The observed effect was ascribed to transient heating during core recovery probably combined with lysis of psycrophilic or barophilic organisms, which overall stimulated the microbial activity in the recovered sediment (Glud et al. Citation1994a, Citation1999a; Aller et al. Citation1998; Sauter et al. Citation2001).
Figure 4. (A) O2 microprofiles measured in situ and in a recovered sediment core from 3500 m depth. (B, C) The ratio between in situ and laboratory-obtained data versus station depth as compiled from three different studies (Glud et al. Citation1994a, Citation1999a; Wenzhöfer & Glud Citation2002).
The observed impact generally increased with water depth as it gradually takes longer times for diffusion to re-establish the in situ profiles with increasing O2 penetration depth () – and O2 penetration increases with the water depth (see below). Attempts to apply general empirical relations correcting the large database of laboratory-based measurements for recovery artifacts have been presented (Sachs et al. Citationforthcoming). However, such approaches are questionable as no strict relationship between in situ and laboratory data can be expected due to differences in the local environmental conditions and core handling procedures. Recently, it was suggested that supersaturating N2 and CO2 levels in cells could induce cell lysis when cores were recovered from great depth to surface pressure and temperature conditions with lower gas solubility (Hall et al. Citation2007). For deep-sea environments trustworthy O2 microprofiles can only be obtained by in situ procedures – or by applying extremely long pre-incubation periods which in itself is a problem. Evidence that the same applies to other diagenetically important solutes are accumulating (Hammond et al. Citation2004; Hall et al. Citation2007).
In coastal water with a few millimeters O2 penetration depth, low hydrostatic pressure and generally a smaller temperature difference between top and bottom water, in situ and laboratory-based O2 microprofile measurements align much better (e.g. Lansard et al. Citation2003). However, extensive comparisons indicate some problems in fully re-establishing in situ profiles in the laboratory – especially in diagenetically very active sediments (Glud et al. 2003). The reasons remain unclear but might be related to irreversible disturbance during core recovery or poor re-establishment of the factors regulating the aerobic activity in situ. Nevertheless, the observation underlines the importance of performing microprofile measurements in situ (or under in situ conditions) in order to quantitatively address benthic O2 dynamics also in coastal waters.
Total O2 uptake measurements are affected by the same problems as outlined for the microprofile measurements. However, the TOU also includes O2 consumption related to faunal activity and thus, correct representation of an active and viable fauna is essential for high-quality measurements. Sediment core samplers, typically used for laboratory-based exchange measurements, recover a relatively small sediment area (70–180 cm2), and they might not include undisturbed, active fauna of the correct density. Laboratory-based incubations of intact sediment cores from coastal environments consistently underestimate the fluxes from in situ incubations of larger benthic chambers, often by a factor of ∼2–3 (Archer & Devol Citation1992; Glud et al. 1998a, 2003). For correct faunal representation (and TOU rates) it is highly recommended to use relatively large core samplers or benthic chambers – the problem of using small enclosures increases with increasing natural heterogeneity and the average size of macrofauna specimens contributing to the benthic exchange rate. This has been further validated and quantitatively discussed on the basis of computer simulation of sampling artifacts associated with chamber incubations on virtual computer-designed fauna-inhabited sediments (Glud & Blackburn Citation2002). In each given case the advantage of using larger core samplers and chambers has, however, to be balanced against the simpler logistic and fewer complications of applying smaller tubes. Artifacts associated with changes in faunal behavior during enclosure will presumably be less when incubations are performed in situ rather than in the laboratory where the benthic community has experienced a stressful recovery process.
Recently, ‘eddy-correlation’ was introduced as a new approach to quantify in situ benthic O2 exchange rates (Berg et al. Citation2003a; Kuwae et al. Citation2006). The technique is based on instantaneous flux determinations calculated from simultaneously measured fluctuations in the vertical flow component and the solute concentration in a given point at some distance from the sediment surface. The principle has for many years been used for air–sea or air–soil exchange determination of e.g. CO2 and CH4 (e.g. Wyngaard Citation1990). The approach is truly non-invasive and integrates large sediment areas – up to several m2 depending on the sediment roughness and the height above the seafloor where measurements are performed (Berg et al. Citation2007). The integration of larger sediment areas seems to result in larger exchange rates by including events or benthic communities poorly represented by traditional chamber approaches (Berg et al. Citation2003a). The measuring principle is superior to any other approach for determining the total benthic O2 exchange rates and the approach bears great potential especially in highly heterogeneous environments. However, the full potential still needs documentation and the sensitivity of the approach is still unclear.
There have been a number of recent reviews discussing preferred designs and technical solutions for in situ benthic exchange measurements (Tengberg et al. Citation1995, Citation2004, Citation2005; Viollier et al. Citation2003) and it is beyond the scope of the present paper to enter that discussion. However, even though consensus is that in situ technology is preferable for quantifying benthic exchange rates and solute dynamics, there are still aspects of sediment disturbance during instrument landing that need to be addressed. Further, the placement of large structures at the seafloor changes the local hydrodynamics and this can potentially affect the benthic biogeochemical conditions (e.g. Reimers et al. Citation2001; Parker et al. Citation2002).
Benthic transport and uptake of oxygen
Apart from the shift in the solid–liquid ratio, the major difference between the pelagic and benthic compartments is a change in the processes responsible for solute transport. The open water is dominated by a turbulent flow regime and efficient solute mixing is ensured by eddy transport and advection. However, in cohesive sediments solute transport is mainly mediated by diffusion, even though fauna-induced irrigation can be important in some areas (see below).
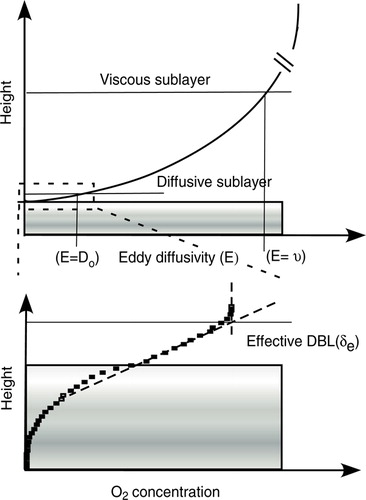
The free-flow velocity and the eddy diffusivity, E, decrease exponentially with the distance to the seafloor, z (Boudreau & Guinasso Citation1982). This is expressed by E(z) = υAzp, where υ is the kinematics viscosity, while A and P represent two constants. The latter typically ranges between 3 and 4 (Shaw & Hanratty Citation1977) and it follows that eddy diffusivity decreases extremely fast in close vicinity of the seafloor. At the distance where the eddy diffusivity becomes smaller than the kinematics viscosity, the viscous forces start to dominate. This height defines the upper boundary of the ‘viscous sublayer’ and is typically ∼5–10 mm above the actual seafloor (Boudreau Citation2001). Even closer to the seafloor the eddy diffusivity falls below the molecular diffusion coefficient (Do) and hydrodynamically this horizon defines the upper boundary of the DBL and it typically extends one-tenth of the viscous sublayer (Boudreau Citation2001) (). Within the DBL the vertical solute transport is mainly mediated by molecular diffusion.
Figure 5. A schematic presentation of the viscous sublayer, the diffusive boundary layer (DBL) and the effective DBL (δe) as derived from the O2 concentration profile (see text for details).
Diffusion is an extremely fast transport mechanism on small spatial scales; however, as the diffusion time relates to the square of the diffusion distance, the efficiency progressively declines with the distance (Sten-Knudsen Citation2002). Biogeochemical process rates at benthic interfaces can thus become limited by mass transport across the 0.5–1.0 mm thin DBL (Schink & Guinasso Citation1977; Boudreau & Scott Citation1978; Thibodeaux et al. Citation1980; Santschi et al. Citation1983).
The diffusive boundary layer (DBL)
The introduction of O2 microelectrodes to aquatic biology (Revsbech et al. Citation1980; Revsbech 1989a) demonstrated the existence of a DBL of relevance for benthic O2 exchange and allowed detailed investigations of the structure and the dynamics of the DBL (Jørgensen & Revsbech Citation1985). It was documented that the DBL in general was characterized by a linear O2 concentration gradient and an ‘effective DBL thickness’ (δe) was defined on the basis of measured O2 microprofiles (Jørgensen & Des Marais Citation1990). By this approach, the upper DBL boundary is determined as the intersection between the extrapolated linear concentration gradient of the DBL and the constant O2 concentration of the overlying well-mixed water phase (). For laboratory investigations, the relative position of the sediment surface can be observed directly via a stereomicroscope, but can sometimes also be identified by a distinct change in the slope of the concentration profile (); this is often used when evaluating in situ profiles. The relative position of the sediment surface can in principle also be determined independently by quantifying the change in the reflective index via a tapered fiber glued to the O2 sensor (Klimant et al. Citation1997a), but the technique is not trivial to apply and has never become widely used. The effective DBL thickness as defined from concentration profiles corresponds well to the thickness defined from hydrodynamic considerations (Jørgensen Citation2001). Continuous measurements at the respective heights within the DBL have shown how eddies impose the DBL and transplant stochastic O2 fluctuations down through the DBL (Gundersen & Jørgensen Citation1990). The fluctuations are dampened in the deeper layers of the DBL and vanish in the very upper part of cohesive sediments (∼50–200 µm). The O2 fluctuations reflect the eddy characteristics, being large and slow at low flow velocities while they are small and fast at high flow velocities (Gundersen & Jørgensen Citation1990; Jørgensen & Des Marais 1990). In order to obtain the average value for the O2 concentration within the DBL, it is thus important to monitor sensor signals at the respective heights for longer periods (Røy et al. Citation2004). Recent investigations argue that the turbulent diffusion (reflected by the fluctuations in O2 concentrations) adds to the solute transport through the ‘effective DBL’ and that the true DBL as approximated by power-law scaling is 30% smaller than the microsensor-derived ‘effective DBL thickness’ (Hondzo et al. Citation2005).
At the scale of the DBL thickness, the sediment surface is not a flat plane but a landscape with extended topography. The DBL blankets the sediment topography, being thin over protruding structures and thicker over protected interjacent areas, and the DBL surface thus reflects a dampened relief of the sediment topography (Jørgensen & Des Marais 1990). The microtopography has three consequences relevant for the simplified one-dimensional diffusive exchange calculations outlined in : (1) the area across which diffusive exchange can take place is larger than the flat plane; (2) vertically measured microprofiles on average protrude the DBL at an angle; and (3) potential horizontal diffusion is not accounted for (Jørgensen & Des Marais 1990). The quantitative importance of these consequences can be evaluated from topographic relief of the sediment (Røy et al. Citation2002). Such microtopographic ‘maps’ can be obtained manually (e.g. Gundersen & Jørgensen Citation1990) – which is an extremely tedious task – or by imposing a horizontal laser-line on the sediment topography and measuring the deflection of the line from a given angle (Røy et al. Citation2002, Citation2005). Such measurements have shown that the three-dimensional exchange area for typical coastal sediments is ∼5–12% larger than the area of the flat plane (Røy et al. Citation2002, Citation2005; Glud et al. 2003). Accounting for both the horizontal diffusion and the larger exchange area, the total diffusive exchange in normal coastal sediments is on average ∼10–25% higher than the one-dimensional diffusive flux estimates from vertical microprofiles (Røy et al. Citation2002, Citation2005; Glud et al. 2003). For microbial mats, more extreme values of ∼50–150% have been presented – these values are not typical, but document the effect in benthic systems with extreme reliefs (Gundersen & Jørgensen Citation1990; Jørgensen & Des Marais 1990). Apart from the microtopography or the roughness of the seabed, the turbulent energy of the benthic boundary layer (BBL), which can be approximated by the flow velocity of the bottom water, exerts prime control on the DBL thickness. In a series of laboratory experiments, it has been shown how the DBL thickness decreases exponentially with increasing flow velocity (e.g. Gundersen & Jørgensen Citation1990; Jørgensen & Des Marais 1990; Santschi et al. Citation1991; Steinberger & Hondzo Citation1999).
In less energetic, enclosed water bodies (i.e. lakes, embayments or reservoirs) the energy dissipation rate can be out of phase with the current velocity, and in such instances, the BBL turbulence rather than the free flow velocity regulates the DBL thickness (Lorke et al. Citation2003). In systems where the diffusion time across the DBL limits the benthic O2 consumption rate, a reduction of the DBL should increase the O2 concentration at the sediment surface, enhancing the DOU and increasing the O2 penetration depth. As an example: a flow-channel study performed on a hypersaline microbial mat showed that by increasing the free flow velocity from 0.3 to 7.7 cm s−1 the δe was reduced from ∼560 to 130 µm and the average transport time across the DBL thereby decreased from ∼125 to 7 s (Jørgensen & Des Marais 1990). The reduction in the DBL thickness increased the DOU by a factor of 2.4 and thus the DBL thickness clearly impeded the O2 uptake of the community. This case represents a situation with shallow O2 penetration depths (∼0.1 mm) and fast turnover time of the interstitial O2 pool (∼10–20 s). Such conditions do not apply to normal marine sediments.
Does the DBL control the diffusive mediated benthic O2 uptake of marine sediments?
The first attempt to directly quantify the in situ DBL thickness by microsensors was performed in the O2 minimum zone off the North American west coast (Archer et al. Citation1989). Using a video camera mounted on a tripod the position of microelectrode tips relative to the sediment was visually followed during in situ microprofiling. From such observations a δe range of 0.5–3.5 mm with an average value of 1.3±1.0 mm was estimated for the deep sea (Archer et al. Citation1989). Some of these measurements were, however, possibly confounded by microtopography. Our present database on published microsensor-derived in situ δe values is still slim. Values for water depths >1000 m generally range between ∼450 and 950 µm, while values measured at the upper shelf or in coastal areas tend to be thinner and generally range between 200 and 700 µm (). The trend of increasing in situ δe values with increasing water depth probably reflects the generally lower current velocities and lower temperatures encountered in deep water – both factors will increase the overall DBL thickness (Jørgensen Citation2001; Roberts & McMinn Citation2004).
Figure 6. The effective DBL thickness quantified from in situ O2 microprofiles versus the water depth. The grey symbols are measured around Svalbard at temperatures close to 0°C and tend to be above the general trend line (data from Glud et al. Citation1994a, 1998a, 1999a, 2003; Glud & Gundersen Citation2002; Lorke et al. Citation2003; Wenzhöfer et al. Citation2001a,Citationb).
Archer et al. (Citation1989) assessed the in situ DBL impedance by assuming that O2 was consumed heterotrophically following first-order kinetics with respect to organic carbon and zero-order kinetics with respect to O2. It followed that a theoretical removal of a DBL at the average measured thickness would enhance the DOU by ∼5–30% at O2 penetration depths of 10.0–2.5 mm (Archer et al. Citation1989). Assuming a depth-independent volume-specific O2 consumption rate, the DOU becomes proportional to the square root of the O2 concentration at the sediment surface (Bouldin Citation1968). The increase in DOU upon a theoretical removal of the DBL would thus be proportional to (Cw/Co)0.5 where Co and Cw are the O2 concentration at the sediment surface and in the well-mixed water phase, respectively. Evaluating in situ O2 microprofiles by this procedure shows that the estimated DBL impedance becomes almost negligible when the O2 penetration depth exceeds ∼1–2 mm (Reimers & Glud Citation2000). Deep-sea or shelf sediments typically have O2 penetration depths well above 1–2 mm (e.g. Reimers et al. Citation1986; Reimers Citation1987) and the O2 turnover time is expressed in hours (or days). The transport time across the DBL in such environments is negligible and the benthic O2 consumption is limited by internal diffusion through the pore space rather than the DBL thickness.
The two simplified approaches presented above do not, however, satisfactorily account for the complex kinetics of O2 consumption in typical marine sediments. The volume-specific O2 consumption is in most instances sediment depth-dependent and a significant fraction of the benthic O2 consumption is related to reoxidation of products from anaerobic organic carbon degradation (e.g. NH4 +, Fe2 + , H2S). In such instances more complicated and detailed modeling approaches accounting for the mobility of the reaction zones and the kinetics of the different O2-consuming processes are required to quantitatively evaluate the DBL impedance (Jørgensen & Boudreau Citation2001).
A seasonal in situ study in central Aarhus Bay, Denmark showed that the O2 penetration depth annually varied between 0.6 and 4.6 mm (average 2.1 mm), that the turnover time of the internal benthic O2 pool varied between 2 and 40 min, and that the δe varied between ∼300 and 700 µm (average 451 µm) (Glud et al. 2003). Anaerobic mineralization accounted for the major part of the total carbon mineralization at the site, and thus a significant fraction of the annual O2 consumption was related to reoxidation processes (Jørgensen Citation1996b). Obviously, the potential DBL impedance cannot be evaluated as described above. Thus a theoretical investigation was undertaken using a dynamic diagenetic model adapted to the extensive biogeochemical database for the area. The established model included 18 dissolved and solid chemical species, 23 redox-reactions and seven O2-consuming processes that linked O2 consumption to the carbon, nitrogen, manganese, iron and sulfur cycles (Fossing et al. Citation2002). By applying measured boundary conditions (including the variations of O2 concentration and temperature of the bottom water), the model reproduced annual variations in measured porewater profiles and benthic exchange rates of the most important biogeochemical solutes (Fossing et al. Citation2002; Berg et al. Citation2003b). The annual variations in TOU at a given DBL thickness were mainly driven by variations in sedimentations rates and the O2 concentration of the bottom water (Glud et al. 2003; see below). By imposing different static values for the DBL thickness and letting all other parameters vary with the seasonal cycle, the theoretical impact of the DBL thickness could be evaluated ().
Figure 7. The TOU modeled with the same seasonal scenario but with four different, static DBL thicknesses (redrawn from Glud et al. Citation2007).
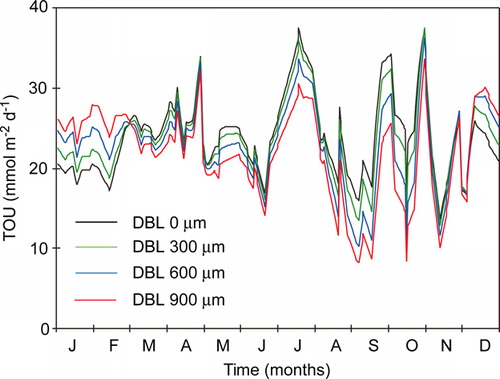
The data showed that during summer, the benthic O2 uptake gradually increased as the DBL thickness was reduced. However, during winter, the opposite effect was observed. The underlying reason was that during summer, the DBL impeded the O2 uptake of the carbon-enriched sediment and the reduced solutes and solids from anaerobic degradation accumulated. During winter when the labile organic pool was exhausted the ‘O2 debt’ was redeemed, and the demand for O2 was higher if the accumulation of reduced substances had been intensified during the summer period. The presence of a static DBL thereby dampens the seasonal variations of O2 uptake (Glud et al. Citation2007). However, the annual integrated O2 consumption rate was only marginally affected. Complete elimination of an imposed DBL of 600 µm only enhanced the annual O2 consumption rate by 5%. The corresponding values at DBL thicknesses of 300 and 900 µm were 2 and 10%, respectively (Glud et al. Citation2007). Eliminating the DBL led to significant reduction in aerobic mineralization rate, but that was almost balanced by a corresponding increase in the reoxidation processes. The slight reduction in the annual O2 consumption following DBL imposition was caused by an enhanced benthic release of reduced solutes (NH4 +, Mn2 + and H2S) and enhanced pyrite burial (Glud et al. Citation2007). Estimating the DBL impedance by the simplified original approach as described above predicted a 58% increase in the annual O2 uptake following the elimination of the 900 µm thick, static DBL. The DBL impedance for the long-term O2 uptake in typical marine sediments is thus much less than would be anticipated from the simplified approaches not accounting for the kinetics and mobility of the various O2-consuming processes. Dynamic modeling showed that theoretical elimination of a DBL increased the DOU and the O2 penetration depth promptly, but the O2 uptake soon declined after the immediate stimulation and at steady state the O2 uptake was only marginally higher (Glud et al. Citation2007). In other words; the δe only affects the long-term DOU of coastal sediments marginally, but sudden changes in the δe can affect short-term O2 distribution and the DOU.
In nature the current velocity (or better the turbulent energy of the BBL) changes constantly and thus the DBL thickness must vary correspondingly. This was shown in a diurnal study of Lake Alpnach where the in situ δe varied between 160 and 840 µm (average ∼390 µm) in phase with changes in the turbulent dissipation energy (Lorke et al. Citation2003). By applying a proxy for the in situ DBL thickness as derived from measured current velocities rather than the static DBL values, the model results revealed that the O2 concentration within the sediment of Aarhus Bay fluctuated extensively due to an ever-changing δe and the porewater profiles thus never reached a steady-state distribution (). The DOU fluctuated correspondingly with more than 30% variation within a few hours solely as a consequence of variations in the DBL thickness. However, the average (and annual) O2 uptake remained unaffected by the variations (Glud et al. Citation2007). The findings have been confirmed in flume experiments (data not shown), but it remains a non-trivial future task to verify the findings in situ. Nevertheless, the theoretical exercise strongly suggests that even though long-term DBL impedance is of minor importance in typical coastal sediments as investigated here, the benthic O2 distribution is far more dynamic than previously anticipated due to constant changes in the DBL thickness. In essence, short-term variations in the bottom O2 concentration would have similar impacts on the O2 dynamics and O2 exchange as the variations in DBL thickness discussed above. The biogeochemical and microbial consequences of the short-term O2 dynamics remain to be investigated.
Figure 8. The estimated DBL thickness in central Aarhus Bay during mid-March (upper panel). Periods with constant high values are caused by a truncation of DBL thicknesses above 1230 µm which were considered to be unrealistic. The lower panel shows the O2 concentration in the bottom water, at the sediment surface, and 0.5, 1.0, 1.5 mm below the sediment surface as derived from the mathematical model – see text (redrawn from Glud et al. Citation2007).
Microbial mats of chemoautotrophic bacteria often have a very shallow O2 penetration depth (<200 µm) and an O2 turnover time of less than a few seconds (Jørgensen & Revsbech Citation1983). The most widely distributed and best studied mat-forming chemoautotrophic bacteria is the filamentous colorless sulfur bacterium Beggiatoa spp. that gains energy by oxidizing H2S aerobically (Nelson Citation1992). These bacteria efficiently compete with the chemical oxidation of H2S with O2 by enhancing the process rate by a factor of 104–105 (Jørgensen & Revsbech Citation1983). Most of the O2 concentration gradient of a well-established mat is within the DBL and the O2 distribution and the DOU is truly regulated by the DBL thickness (A). The bacteria have a simple but efficient chemosensory behavior that ensures the filaments constantly maintain themselves in the optimal position (i.e. the H2S–O2 overlap zone), and the mat structure thus constantly changes with changes in the DBL thickness (Møller et al. Citation1985). The thin, diffusion-limited Beggiatoa spp. mats known from impermeable sediments are contrasted by centimter-thick mats of giant Beggiatoa spp. around hydrothermal vents. Here convective fluid circulation driven by out-simmering hot water overcomes diffusion limitation and ensures convective mixing and supply of H2S and O2 to the thick and loose mat structure (Gundersen et al. Citation1992).
Figure 9. (A) Parallel O2 and H2S microprofiles measured across a sediment–water interface with a Beggiatoa mat. The two profiles are not measured at the exact same spot, but it is apparent that H2S is oxidized in the aerobic surface layer. (B) The flow field of water around a cluster of attached, rotating Thiovulum cells. The vectors indicate particle displacement within 0.2 s. The dotted line indicates the isoline of 4% air saturation (redrawn from Fenchel & Glud Citation1998).
Thiovulum sp. is another well-studied colorless sulfur bacterium gaining energy from aerobic H2S oxidation (e.g. Garcia-Pichel Citation1989; Fenchel Citation1994). Thiovulum cells are 5–10 µm in diameter and they are among the fastest free-swimming bacteria (200–1000 µm s−1). Thiovulum follows a helicoid swimming path, and the cells aggregate in zones where H2S and O2 co-exist. Under suitable conditions, the cells secrete a thin mucus thread that attaches to solid surfaces, but the anchored cells keep rotating counter-clockwise (seen from the posterior end) in the developing veil (Jørgensen & Revsbech Citation1983; Fenchel Citation1994). It was observed that attached cells clustered in groups of 20–100 individuals and that the continued rotation of the bacteria induced small advective flow-cells around the clusters (B). Through their self-organization, the attached rotating cells enhanced the counter-current diffusive supply of H2S–O2 by a factor of ∼40. Oxygen-depleted and H2S-enriched water emerged in the holes of the bacteria-veil and was mixed with water above the veil that was sucked down towards the center of the cell clusters (Fenchel & Glud Citation1998). The cells thereby overcame the diffusion-limited supply of their vital metabolites. Recently it has been observed that a large, vibrioid bacteria uses the same mechanism for enhancing the O2 supply to veil forming communities (Thar & Kühl Citation2002). The cases presented above are only two examples of adaptations of large, surface-associated chemoautotrophic bacteria for overcoming diffusion limitation in their metabolite supply – other spectacular examples includes bacteria like Thioploca spp. and Thiomargaritta namibiensis (Fossing et al. Citation1995; Schulz et al. Citation1999; Schulz & Jørgensen Citation2001). Filter feeding of sessile ciliates hosting bacteria symbionts represents another fascinating example of how chemoautotrophic metabolism can be stimulated by microscale advection (Vopel et al. Citation2002).
Experimental considerations for DBL and benthic exchange studies in cohesive sediments
Most microsensor studies have been conducted with the sensor being inserted from above. However, the presence of a microsensor changes the structure of the DBL (Glud et al. Citation1994b). The reason is still not fully understood but is probably related to flow acceleration around the electrode shaft compressing the DBL below the sensor tip and expanding the DBL on the leeside of the sensor. Values of δe derived from microprofiles thus underestimate the actual value by ∼25–45% (Glud et al. Citation1994b). This may explain why alabaster plate dissolution techniques tend to give 25–60% higher δe values than microsensor-derived measurements (Santschi et al. Citation1991; Jørgensen Citation2001) and the effect should be considered when evaluating the current database on in situ DBL thicknesses.
In regions with O2 penetration depths above a few millimeters, DBL disturbance during sensor insertion hardly affects the interstitial O2 distribution. However, in coastal environments with shallow O2 penetration, O2 microprofiles will often be measured as the O2 distribution transiently recovers from the DBL perturbation. The quantitative importance of this depends very much on the local conditions and the applied profiling procedure, but the potential impact ought to be better evaluated. In microbial mats with shallow O2 penetration, a new steady-state O2 microprofile following a given DBL perturbation will quickly re-establish. But here, the DOU at the measuring spot will be substantially increased due to the microsensor-induced DBL compression. As an example, DOU determinations in a Beggiatoa mat were 60% higher when calculations were based on microprofiles measured from above as compared to profiles made from below (Glud et al. Citation1994b). The DBL compression effect should not be taken lightly when performing microsensor work in extremely active microbial communities or when microsensor-derived solute profiles are aligned to the distribution of solutes, solids or organisms in e.g. biofilms. Oxygen images of a biofilm base growing directly on an O2 planar optode revealed that the base of all cell clusters was anoxic, while microelectrodes measurements performed from above indicated a complete oxic biofilm. The oxygenation of the biofilm was induced by DBL compression as the microelectrode approached the biofilm (Glud et al. Citation1998b). Undisturbed DBL measurements can be performed by inserting the microelectrode from below. This can be done in the laboratory but just how this should be accomplished in situ is hard to imagine.
Considerable efforts have been dedicated to validate various chamber designs for benthic exchange measurements (e.g. Buchholz-ten Brink et al. Citation1989; Hüttel & Gust Citation1992a; Glud et al. Citation1995a; Smith et al. Citation1997; Tengberg et al. Citation2004, Citation2005). In consensus, the chamber hydrodynamics is of minor importance working in areas where the DBL impedance can be ignored (i.e. O2 penetration above a few millimeters) (e.g. Reimers et al. Citation2001; Tengberg et al. Citation2004). It is, however, essential that the stirring of the chambers is sufficient to ensure a well-mixed water column. For very diagenetic-active cohesive sediments, the DBL impedance can potentially be of importance for the exchange rate (see above) and thus it is advantageous to know the δe imposed by the chamber design for later evaluation. Further it is advantageous to have a relatively invariable δe covering the chamber-bottom. This can be optimized by selecting different geometric designs or additional pump-systems (Tengberg et al. Citation2004, Citation2005). The imposed δe can be determined in the laboratory by measuring O2 microprofiles during incubations at different stirring speeds and water column heights (Glud et al. Citation1995a). If burrow flushing is significant, it can be advantageous to use chambers with relative small horizontal pressure gradients in order not to induce or enhance passive burrow flushing (Webb & Eyre Citation2004a).
Interstitial solute transport of cohesive sediments
The diffusive exchange across the DBL can be directly inferred from the concentration gradient and the molecular diffusive coefficient (D0). However, as molecules in the sediment cannot move along a direct path but have to circumvent the sediment particles, the sediment molecular transport coefficient (Ds) must be corrected for the tortuosity.
The Ds relates to the tortuosity (θ) as Ds=D0/θ2 (Berner Citation1980). It is, however, complicated to quantify the tortuosity in a matrix of particles of different size and geometry as encountered in natural sediment. Thus, there have been established empirical relations between the sediment diffusive transport coefficients (Ds) and the sediment porosity (ϕ): Ds=D0ϕm − 1 and Ds=D0(1 + n(1 − ϕ))−1, where m and n represent sediment characteristic values of 2–5 and 2–3, respectively, largely depending on the sand content (Ullman & Aller Citation1982; Iversen & Jørgensen Citation1993). The constants are not well-defined, and in reality, it is often difficult to objectively select the right value for an analysis and recently a more advanced geometric model expressing the tortuosity dependence on porosity in mud has been proposed (Boudreau & Meysman Citation2006).
Oxygen microsensors enable us to obtain concentration profiles with a high spatial resolution (<50 µm); this is well below what is possible for porosity determinations. At best, porosity measured by core slicing can be determined by a 3–5 mm depth resolution. Porosity (or tortuosity) can also be approximated by the electric resistance of the sediment (Klinkenberg Citation1951), but the spatial resolution of such measurements are generally not much better than traditional core slicing (e.g. Andrews & Bennett Citation1981). Porosity profiles reflect a steep gradient in the upper sediments layers – but the gradients are poorly spatially resolved in the oxic zone. Thus, detailed quantitative analysis of interstitial O2 microprofiles are essentially limited by the lack of high-resolution profiles of the transport coefficient.
Microprofiles typically have a characteristic break in the O2 concentration gradient right at the sediment surface (, lower panel). This reflects the impeded transport just below the interface. The ratio between the concentration gradient measured just above and below the interfaces has been used to quantify the Ds just below the surface assuming mass conservation of O2 across the interface (e.g. Epping et al. Citation1999). The approach requires very detailed microprofiles and does not resolve the depth profile of Ds. High-resolution microprofiles of Ds have been obtained in chemically oxidized and biologically inactivated benthic communities using O2 as an inert tracer (Revsbech Citation1989b). The data revealed a strong gradient in Ds within the upper 2.5 mm of a river sediment and that the microbial mat communities had significantly lower Ds than would be derived from the porosity relations above – probably as a consequence of high intracellular water content and water-saturated exopolymers which lead to overestimation of fluid-filled pore spaces (Revsbech Citation1989b). A more gentle approach using N2O as an inert tracer in active benthic samples where N2O production and consumption had been inhibited confirmed these findings (Glud et al. Citation1995b). The upper part of benthic communities expressed a significant small-scale depth variation in Ds roughly decreasing by 5% mm−1, but also showed significant horizontal variation. The absolute values for Ds declined after biological inactivation, indicating that meiofauna activity enhanced the Ds values in such communities (Glud et al. Citation1995b).
An elegant principle for quantifying Ds at high spatial resolution in active benthic communities was introduced by the so-called ‘apparent diffusivity’ microsensor (Revsbech et al. Citation1998). The sensor contains a gas reservoir (e.g. H2) enclosed by a glass casing and a permeable silicone membrane at the sensor tip. The concentration of the tracer gas at the sensor tip is continuously monitored and is dependent of the ambient molecular transport rate (Revsbech et al. Citation1998). The sensor has been applied in different environments and documented extensive small-scale vertical and horizontal variability in Ds (e.g. Revsbech et al. Citation1998; Elberling & Damgaard Citation2001; Stief et al. Citation2004). Wide application of the sensor has, however, been limited by very slow response time (5–20 min), lack of stability, and microbial transformation (or production) of the tracer gas. Recently, a similar sensor design was used to measure flow profiles at extremely slow flow (Brand et al. Citation2007).
Fine-scale measurements of Ds in benthic communities have also been inferred from pulse field gradient 1H nuclear magnetic resonance spectroscopy using H2O as a tracer (Wieland et al. Citation2001). The approach can non-invasively obtain vertical (or horizontal) images of the apparent diffusivity within benthic communities. Such measurements have confirmed the extensive variation in Ds of microbial mats – a variability that correlated to the distribution of exopolymers and microorganisms (Wieland et al. Citation2001). The approach is fascinating, but requires very specialized equipment and skills and it will never become a general applicable tool for Ds determination. The approach still remains to be tested in sediments.
A common observation when making detailed O2 microprofile analyses in very active benthic communities is an inconsistent mass-balance between the DOU derived from the DBL gradient (using D0) and the DOU calculated on the basis of the concentration profile measured in the community using the Ds–ϕ relations above (Wieland et al. Citation2001; Rabouille et al. Citation2003). This could partly be caused by high content of water-saturated exopolymers or the intercellular water. However, inert tracer experiments have also documented that dispersion induced by meiofauna in surface sediments can enhance the interstitial solute transport by a factor of 1.5–2.0 (Aller & Aller Citation1992; Rysgaard et al. Citation2000; Berg et al. Citation2001). One meiofauna group that has a large potential for enhancing the Ds is filter-feeding ciliates which typically have filtration rates in the order of 5–50 µl day−1 (Fenchel Citation1986). Quantification of filter activity of Euplotes spp. and Uronema marinum in densities encountered in microbial mats and carbon-enriched sediments indeed documented that this activity enhanced the solute transport of small molecules by a factor 1.1–10 (Glud & Fenchel Citation1999). This can be especially important in the surface of shallow-water sediments and along burrow walls that often host high densities of ciliated protozoa (e.g. Fenchel Citation1996b), but the density in typical marine sediments is probably too low to affect the Ds value significantly (Glud & Fenchel Citation1999).
Advective solute transport in cohesive sediments
There have been numerous investigations documenting the importance of fauna for benthic diagenesis and solute exchange (e.g. Aller & Yingst Citation1985; Kristensen Citation1988; Aller Citation2001). Deposit- and suspension-feeding fauna play an important role by digesting settling organic material, making it more accessible for subsequent microbial degradation. In the short term, faunal activity creates a heterogeneous interface with tracks, fecal mounts, burrows and funnels that may represent diagenetic hotspots, but in the long term, the fauna serves as an efficient particle mixer that homogenizes the upper sediment layers. Fauna-induced sediment mixing plays an important role for the net downward transport of labile organic material and metal oxides and the net upward transport of reduced metal–sulfur complexes (e.g. Aller Citation1990; Thamdrup 2000 ). The associated redox oscillations experienced by organic substrates play an important role in regulating the degradation efficiency especially of more refractive organic material (Aller Citation1994; Kristensen & Holmer Citation2001 ; Meile & van Cappellen Citation2005). Recent two-dimensional time-lapse movies have presented impressive visualization of bioturbation by following luminophore displacements, thereby quantifying particle mixing rates in the laboratory and in situ (Gilbert et al. Citation2003; Solan et al. Citation2004).
The sandworm Arenicola marina represents a frequently used model organism for studying the effects of bioturbation and bioirrigation (e.g. Meysman et al. Citation2005; Timmermann et al. Citation2007). For the shallow Wadden Sea, it has been estimated that on an annual basis this species completely mixes the upper 15 cm of the sediment and irrigates its burrows with ∼80 m3 of water per m2 (Riisgård & Banta Citation1998). Even though this represents an extreme case, it illustrates that faunal irrigation can significantly enhance benthic solute exchange. In the shallow North Sea, the activity of Callianassa subterranean and Lanice conchilega in natural densities enhanced the TOU by 85% (Forster & Graf Citation1995). Similar values for fauna-enhanced O2 uptake rates have been reported from laboratory experiments on the polychaete Hediste diversicolor (e.g. Banta et al. Citation1999), the brittlestar Amphiura filiformis (Vopel et al. Citation2003) and from in situ chamber measurements on sediments completely dominated by Trypaea australiensis (Webb & Eyre Citation2004b). The relative importance for fauna-induced irrigation of benthic exchange rates obviously depends on the species involved, the size of the specimens, and the local sediment chemistry. Most investigations on faunal irrigation have for good reasons been performed in areas dominated by a single or few specimens or in well-regulated, small laboratory set-ups, and the findings have then been extrapolated back to in situ conditions. To evaluate the relative importance of faunal activity for in situ O2 uptake in mixed natural communities, the most simple and robust procedure is to subtract DOU from the TOU (see above). As outlined above, it is, however, important to incubate as large a sediment area as possible in order not to underestimate the fauna activity.
The present database on simultaneously obtained in situ measurements of DOU and TOU is small, but a compilation of the available in situ data does reflect a general pattern (). The TOU is markedly higher than the DOU in areas with high benthic O2 uptake rates. Applying the simple trend line of A, it follows that at TOU rates >12 mmol m−2 day−1 the fauna-related O2 uptake accounts for >50% of the benthic O2 uptake. However, in areas with low diagenetic activity and little fauna, the values converge, and are not significantly different at abyssal water depths – this also provides some confidence in the robustness of two different measuring approaches. The general observation that the relative importance of the non-diffusive O2 uptake (TOU − DOU) increases with benthic diagenetic activity has previously been reported from smaller data compilations (Jahnke Citation2001; Meile & van Cappellen Citation2003). Measurements along the isobar at 1300 m water depth off the West African continent showed that the TOU and DOU aligned well until entering the upwelling zone off Namibia – here the two data-sets diverged (Wenzhöfer & Glud Citation2002). As the sedimentation rate of organic carbon both depends on the production in the photic zone and the water depth (see below), it is no surprise that the DOU/TOU ratio of the various depth ranges show some scatter as reflected by the error bars in C. The database also covers measurements in a wide range of environments presumably dominated by macrofauna of different biology and size – which also will induce scatter in the simple relationship between the DOU/TOU ratio and the water depth. Nevertheless, the general trend is apparent, and the relative importance of fauna-related irrigation for benthic O2 uptake tends to increase as one moves from the open waters towards the coast (C). The diffusive-mediated O2 uptake completely dominates at water depths below 3500 m, but the fauna-mediated O2 uptake becomes quantitatively more important at water depths shallower than 1000 m (). On average, the DOU only accounts for 43% of TOU in non-photic, cohesive sediments at water depths <100 m.
Figure 10. (A, B) In situ TOU plotted against parallel DOU measurements for a wide range of non-photic sediments (n = 65). (C) Ratio between DOU and TOU versus the depth ranges (data from Archer & Devol Citation1992; Reimers et al. Citation1992; Glud et al. Citation1994a, 1998a, 1999a, 2000b, 2003; Forster et al. Citation1999; Glud & Gundersen Citation2002; Wenzhöfer et al. 2001a, b, 2002; Wenzhöfer & Glud Citation2002; Witte et al. 2003a).
The simplest way to quantify faunal abundance is to measure the biomass. However, the weight poorly reflects the biology or the irrigation activity, and mass-specific respiration is size-dependent. Thus, the macrofaunal biomass of natural communities does not correlate well to the ratio or the difference between TOU and DOU even in seasonal studies performed at the same location (e.g. Rasmussen & Jørgensen Citation1992; Moodley et al. Citation1998; Glud et al. 2003). The macrofaunal biomass is therefore not a good proxy for the fauna-related O2 uptake of natural benthic communities.
The general observation that the relative importance of fauna-related O2 uptake decreases with increasing water depth is probably a combined effect of (1) a relatively steeper decline in macrofaunal biomass than microbial biomass with increasing water depth (Pfannkuche & Soltwedel Citation1998; Rex et al. Citation2006); (2) a shift in biology from very active irrigating specimens to less active deposit-feeding specimens when moving towards carbon-depleted sediments (Flach et al. Citation1998; Pfannkuche Citation2005); and (3) less quantitative importance of a given irrigation event for the O2 uptake in highly oxidized (or oxic) sediments. The relative importance of these causes still remains to be fully evaluated.
Fauna-related O2 uptake is caused by two different processes: (1) fauna respiration and (2) activities that expose otherwise anoxic sediments to O2 (i.e. irrigation, excavation, turbation). There is no simple way to quantify the relative importance of these two processes. Typically, fauna respiration has been inferred from laboratory measurements on specimens enclosed in inert compartments without sediment (e.g. Banta et al. Citation1999) or by extrapolating relations between mass-specific respiration rates and biomass (e.g. Gerlach et al. Citation1985; Mahaut et al. Citation1995; Heip et al. Citation2001). In many instances, it is questionable to what extent such approaches reflect the in situ respiration rate of the investigated specimens – but alternative procedures are difficult to realize. By quantifying the benthic fauna distributions either by camera observations or by sieving recovered sediment and using various algorithms for extrapolating laboratory-determined respiration rates, it has been estimated that macrofaunal respiration (or megafaunal and macrofaunal respiration together) may represent as much as 25–50% of the TOU (e.g. Piepenburg et al. Citation1995; Ambrose et al. Citation2001; Heip et al. Citation2001). However, in typical marine sediments fauna-mediated O2 uptake markedly exceeds the respiratory demand of the macrofauna (e.g. Forster & Graf Citation1995; Hansen & Kristensen Citation1997; Glud et al. Citation2000b, 2003; Vopel et al. Citation2003) and aerobic microbial activity and chemical oxidation stimulated by irrigation and turbation is often the quantitatively most important component of the fauna-mediated O2 uptake ().
Figure 11. Processes responsible for the O2 consumption in two coastal sediments. Both data-sets reflect that faunal activity is responsible for a significant fraction of the TOU and that the irrigation is a quantitatively more important process than respiration (data extracted from Glud et al. Citation2000b, 2003 and updated fauna information from Sejr & Christensen Citation2007).
Sediment-dwelling polychaetes represent a quantitatively important infauna group and in natural densities they can significantly enhance the area of the oxic–anoxic interface and the oxic sediment volume (Fenchel Citation1996a; Kristensen Citation2000). The burrow lining can be enriched in labile organic material (Kristensen Citation2000), and the radial geometry ensures a short diffusion distance between the oxic lumen and the highly reduced ambient sediment, facilitating local oxidation of solutes released during the anaerobic mineralization (i.e. Fe2 + , Mn2 + , H2S, NH4 +). Detailed O2 microsensor studies have shown that the burrow lining can act as hot-spots with intensified O2 consumption markedly above the activity along the primary interface (e.g. Wenzhöfer & Glud Citation2004; Jørgensen et al. Citation2005).
In shallow-water environments where light may reach the sediment surface, diel rhythms in faunal behavior may complicate matters. In situ time-lapse photography has demonstrated that the sediment-dwelling suspension-feeding brittle star Amphiura filiformis exhibits a diel rhythm with intensified feeding activity at night time (Rosenberg & Lundberg Citation2004). This obviously must have implications for the benthic O2 exchange rate. A detailed in situ study performed at a shallow-water, net-heterotrophic sediment completely dominated by juvenile specimens of Hediste diversicolor also reflected a distinct rhythm in the TOU (Wenzhöfer & Glud Citation2004). At dusk, the TOU increased by a factor of ∼5 to a maximum rate of ∼110–140 mmol m−2 day−1 while the DOU remained at a constant level of 10–12 mmol m−2 day−1. During the night, the TOU gradually declined to the pre-dusk value. Exclusion of primary production during the night and intensified respiration of leaked photosynthates (see below) during early evening could not alone explain the observation (Fenchel & Glud Citation2000). Rather, the diurnal variation in TOU was ascribed to light-induced shifts in faunal activity and changes in the bottom water O2 concentrations. This was confirmed by time-lapse O2 imaging revealing elevated burrow excavation and ventilation activity and intensified deposit feeding at the surface during night time; this to the extent that the sediment surface was completely remodeled the next day. The TOU during night time corresponded to 70% of the diurnal net O2 uptake and only 25% of this was estimated to be related to animal respiration while the remainder was caused by a stimulated sediment uptake (Wenzhöfer & Glud Citation2004). Recently, diel variation in the activity patterns of Hediste diversicolor were confirmed in a mesocosm experiment (Tang & Kristenen 2007) and preliminary investigation on Nereis virens suggests that subpopulations to various extents exhibit diel cyclic and endogenous rythmic behavior in response to tide and light (Kim Last, personal communication). To what extent similar events or dynamics are occurring in other areas remains to be demonstrated.
Overall, it can be concluded that fauna-mediated O2 uptake can be quantitatively significant for the benthic O2 uptake. This is especially true for the coastal area that represents an important zone for global carbon mineralization (see below). The relative importance of fauna-mediated O2 uptake (quantified as the difference between TOU and DOU) has also been used to estimate the relative importance of diffusive versus irrigation-related exchange rates for other diagenetically important solutes (Meile & van Cappellen 2005).
Tubes or burrows left by polychaete infauna are often surprisingly stable and can persist for months to years after being vacated (e.g. Aller & Aller Citation1986). Relict tubes can act as traps for labile organic material and thereby represent hot-spots with intensified diagenetic activity (Aller & Aller Citation1986; Zhu et al. Citation2006b). To the extent they remain open they enhance the sediment permeability (Weaver & Schultheiss Citation1983). Pressure gradients between the burrow openings caused by the vertical flow gradient can induce flushing through such relict burrows (Vogel & Bretz Citation1971; Ray & Aller Citation1985; Libelo et al. Citation1994). Despite a large potential for such an exchange mechanism in many sediments (A), the effect has rarely been evaluated in natural systems. The sediments of central Skagerrak host a large density of relict, rigid tubes from the polychaete Spiochaetopterus bergensis (1300–8000 m−2) (Rosenberg et al. Citation1996; Forster et al. Citation1999). Detailed microsensor investigations revealed that many of the tubes were exposed to passive flushing in the order of 5–11 µl min−1 at moderate, realistic flow velocities of 2–6 cm s−1 (Munksby et al. Citation2002). The flushing induced dynamic, suboxic/anoxic plumes downstream of the tubes and created a very dynamic and heterogeneous O2 distribution along the sediment–water interface. The flushing enhanced the O2 consumption rate by a factor of ∼2 (Munksby et al. Citation2002). The activity must have profound impact on the local biogeochemistry where the heterotrophic activity is dominated by microbial manganese respiration (Canfield et al. Citation1993). The complex flushing may act as a shunt in the upward net-transport of Mn2 + that would otherwise be driven by diffusion (Thamdrup et al. Citation1994) and burrow excavation may efficiently bury the precipitating manganese oxides below the oxic zone, maintaining high microbial manganese respiration.
Figure 12. (A) Photograph taken at 155 m water depth in Hornsund, Svalbard. The sediment contains numerous permanent-like tubes extending out of sediment and investigations of recovered sediment documented that many were relict (Glud et al. 1998a; Jørgensen et al. Citation2005) (photograph by O. Holby and R.N. Glud). (B) ‘Chimneys’ extending out from a complex microbial mat structure found the high Arctic (redrawn from Glud et al. Citation2004).
Another example of passive tube flushing was recently encountered in a conspicuous H2S-oxidizing microbial mat from the high Arctic (Glud et al. Citation2004). The centimeter-thick, flocculent mat covered loosely packed, decaying macroalgae and exhibited a complex three-dimensional structure dominated by cracks and chimney-like protrudings (B). Microsensor measurements documented the advection of solutes within the mat and that anoxic sulfide-rich water emerged through the protruding tubes presumably being replenished through larger basal openings in the mat coverage (Glud et al. Citation2004). The complex, flexible structure ensured a flow-induced advective transport of H2S, O2 and dissolved organic matter throughout the entire mat structure, which grossly enhanced the benthic exchange rate. Similar mats have now been observed in a range of Arctic fjord systems in Greenland, often covering several 100 m2 of the seafloor.
Advection in permeable sediments
Globally, cohesive, impermeable, sediments dominate the seafloor. However, it has been estimated that 70% of the coastal shelf is covered by relict sands (Emery Citation1969) and that a little more than 50% of the relict sand areas are permeable (i.e. k > 5×10⁻¹² m−2) (Hüttel & Gust Citation1992b). As sand generally holds little organic material, sands have been considered to only have minor importance for local and regional carbon cycling. However, the little organic material that is held by sand is highly labile not being diluted by accumulating less degradable material facilitating a high carbon turnover rate. Another obstruction to sand studies has been the simple fact that it is very difficult to sample intact undisturbed sand cores, and until recently, sand has received relatively little attention as compared to cohesive sediments. From a biogeochemical point of view, the prime difference between cohesive and permeable sediments is that advection adds to the transport of solutes and solids (Thibodeaux & Boyle Citation1987). The driving force for the advective transport can either be fauna activity, differences in water density, wave action or interactions between flow gradients and topographic structures that induce pressure differences forcing water through the sediment matrix ().
Figure 13. The image shows the distribution of red solutes and 1 and 10 µm large black particles after a laminar flow of 10 cm s−1 had been imposed on a sediment hump in sand for 16.5 h. Initially all color in the sediment was dissolved only in the two horizontal layers bordered by the black lines and particles were only added to the overlying water. The image clearly shows that particles and solutes were forced through the pore spaces at the front of the hump and that partial pressure differences induce a local upwelling of porewater at the top and behind the hump (redrawn from Huettel et al. Citation1996).
Advective porewater transport means that the permeable seabed functions somewhat like biocatalytic filters as known from purification treatment in recirculating water systems. Advection markedly enhances benthic solute exchange rates as compared to a situation with only diffusive-driven exchange (Huettel & Webster Citation2001). In natural environments with constantly changing wave action, flow characteristics and bottom topography, the benthic O2 distribution becomes extremely dynamic (Ziebis et al. Citation1996; Precht et al. Citation2004, de Beer et al. Citation2005; Cook et al. Citation2007a). Oxygen can be advected deep into the sediment, and the O2 penetration depth in such areas may exceed several centimeters (de Beer et al. 2005). However, in other regions, outwelling induced by partial pressure differences may force anoxic porewater right to the sediment surface (Ziebis et al. Citation1996). As sand ripples migrate along the seabed, down- and upwelling regions may progressively move along with the topography (Precht et al. Citation2004). Thereby, a stationary volume of sediment below the moving ripples experience repetitive cycles of oxia and anoxia and upon changing flow conditions, pockets of oxygen may stay behind in the otherwise anoxic sediment (Cook et al. Citation2007a). If the ripples move too fast, the upwelling regions will never establish, and a several centimeters broad oxic zone may develop (Precht et al. Citation2004). Advection can stimulate the degradation of organic material buried deep in the sediment (Franke et al. Citation2006). The volume-specific O2 consumption (Rvol) in permeable sediments has been estimated from slurry incubations and by following the O2 decline in the pore fluid after the advective O2 supply has been eliminated (e.g. Precht et al. Citation2004; de Beer et al. Citation2005; Polerecky et al. Citation2005; Franke et al. Citation2006; Cook et al. Citation2007a). The few available values generally range between 0.5 and 12 µmol cm−3 day−1 with two outliers in the range of 20–35 µmol cm−3 day−1. The values compare with values from coastal cohesive sediments even though they tend to be in the lower end of the range (see below). However, given the wider oxic zone of permeable sediments, the values indicate a potentially high TOU of sand. Only a few chamber or core measurements have been performed in sandy sediments, and they generally reflect lower TOU than measurements performed in muddy sediments (Cook et al. Citation2007a, and references therein). However, the vast majority of these studies have not considered imposing advection during the incubations and, in most instances, percolation has probably been markedly less as compared to the in situ conditions. The compiled database for sandy sediments may thus severely underestimate the in situ TOU (Cook et al. Citation2007a).
It is not trivial to perform chamber incubations while maintaining an advective component driving a controlled percolation of the sediment. It can be done by applying circular, centrally disc-stirred hydrodynamically well-calibrated chambers (Hüttel & Gust Citation1992a; Khalili et al. Citation1997). The stirring imposes a known pressure gradient and by knowing the sediment permeability, a controlled percolation rate can be induced (Glud et al. Citation1996a; Janssen et al. Citation2005). However, care should be taken when performing such incubations as it may take relatively long preincubations before quasi-steady-state O2 distributions have been established. Simple hydrodynamic–biogeochemical modeling routines can be valuable tools for predicting the correct timing (Cook et al. Citation2007b). Alternative procedures for in situ incubation of sandy sediments include flume-like chambers that induce a unidirectional flow across the natural topography of the seabed (Webb & Eyre Citation2004a, Citationb).
The TOU and DIC release rates as measured in sandy sediments generally increase with the imposed percolation rate, and the rates can be very high as compared to incubations of cohesive sediments (). As discussed above, a steady state between anaerobic heterotrophic activity and the oxic reoxidation of the released inorganic metabolites is assumed when using the O2 uptake rate as a proxy for the total turnover of organic material. This assumption is rarely fulfilled in sandy sediment exposed to a constantly changing advective porewater transport. Reduced solutes (and solids) will accumulate in periods with low percolation rates and out-flushing and reoxidation of metabolites will be initiated when percolation is induced. Even in a situation where the O2/DIC exchange ratio is close to 1 after a pre-incubation period (as in ), the exchange rates could reflect a central out-flushing of accumulated DIC and concurrent reoxidation of reduced solutes and solids rather than actual carbon mineralization rates. Therefore, it is difficult to relate total benthic exchange rates of O2, DIC or nutrients to the actual organic carbon mineralization rate in permeable sediments. Most of the high Rvol or TOU rates obtained in sandy sediments probably reflect intense reoxidation of accumulated reduced inorganic components. A reasonable estimate of benthic carbon mineralization rate in sandy sediments is far more difficult than for cohesive sediments and it requires a suite of complementary percolation and slurry techniques preferentially combined with modeling approaches (Cook et al. Citation2007b).
Figure 14. Benthic exchange rates of O2 and DIC plotted against the stirring rate in two parallel circular chambers. The sandy sediment had a permeability of 2×10⁻¹¹ m2 and was pre-incubated at the respective stirring rates for 16–20 h before the actual incubations were initiated. The included trend lines should not indicate a linear response. 0 RPM means that the overlying water was gently mixed without establishing a static partial pressure (redrawn from Cook et al. Citation2007a).
Permeable sandy sediments gradually become clogged as material is advected into the interstice and as the microbial community continues to grow. In order to maintain their biocatalytic filter capacity, sandy sediments must be re-set. This happens during storm events or by strong tidal currents, where huge amounts of sands are resuspended, and moved. However, in less vigorous environments, the activity of infauna like Arenicola marina might also be important for keeping sands permeable (Volkenborn & Reise Citation2006).
Subtidal sandy sediments often host relatively few macroscopic animals, but one of the more conspicuous – apart from Arenicola marina – is the lesser sandeel (Ammodytes tobianus). It is peculiar among fish in that it buries itself in the sediment during the night, when frightened, and in the winter months. The behavior presumably lowers the predation level, and may also represent an energy-saving strategy. Planar O2 optode measurements showed how the fish during most of the time advected oxygen toward the mouth by gill ventilation, but occasionally channeled oxygenated water down along the body by wrinkling movements. Mass–balance calculations revealed that the fish lowered its O2 requirement by 25–30% when buried (Behrens et al. Citation2007). With estimated average winter densities of 60 m−2 (up to 200 m−2) in the central North Sea (Høines & Bergstad Citation2001), the buried fish would enhance the benthic O2 uptake by a factor of up to two, of which approximately half is related to the respiration of the fish (Behrens et al. Citation2007).
There are still only a very limited number of investigations on benthic O2 dynamics, carbon mineralization and primary production (see below) in permeable sediment and it remains an important challenge to quantitatively resolve the importance of sandy sediments for marine carbon cycling.
Benthic oxygen uptake rates in cohesive sediment from the coastal zone to the deep sea
As outlined above, benthic O2 uptake represents a relatively robust proxy for total benthic mineralization rate in cohesive sediments. Therefore, the database on in situ benthic O2 exchange rates has been steadily increasing since the first bell jar incubations (Pamatmat & Fenton Citation1968) and the pioneering lander work (Smith et al. Citation1976; Reimers Citation1987). Even though certain areas of the deep-sea and polar regions are under-sampled and we have very little information from complex and dynamic sediments like permeable sand, rocky shores and fluidized muds (Aller Citation2004), the database has reached a size allowing generalizations and approximations of regional and global benthic O2 uptake rates (Jahnke Citation1996; Christensen Citation2000; Wenzhöfer & Glud Citation2002; Andersson et al. Citation2004; del Giorgio & Williams Citation2005).
Large-scale gradients
The in situ O2 penetration depth increases exponentially with water depths from a few millimeters in coastal depositional areas to >10 cm at abyssal sediments (). Recent onboard measurements indicate that O2 may even penetrate sediments to several meters in the central oceanic gyres (T.G. Ferdelman et al., personal communication). Rather than changes in O2 availability, this general pattern reflects a gradual decrease in the average volume-specific O2 consumption of the sediment, which decreases by more than four orders of magnitude from an average of ∼10 µmol cm−3 day−1 at 16 m water depth in central Aarhus Bay to 0.003–0.0004 µmol cm−3 day−1 at 3–5 km water depth in the Atlantic and Pacific oceans (). The attenuation in aerobic activity mirrors the general trend of decreasing organic matter sedimentation rate with increasing water depth (e.g. Berger et al. Citation1988), which also is reflected in the decreasing biomass of benthic fauna and active microbes (e.g. Queric et al. Citation2004).
Figure 15. The in situ O2 penetration depth (A) and the average in situ volume-specific O2 consumption rates (B) as a function of water depth compiled from a broad range of non-photic environments. Rvol is calculated by dividing the DOU with the O2 penetration depth (data extracted or calculated from Glud et al 1994a, 1998a, 1999a, 2003; Wenzhöfer et al. Citation2001a, Citationb; Wenzhöfer & Glud Citation2002).
Likewise in situ rates of TOU and DOU decline with increasing water depth. The compilation depicted in is based on 52 studies covering a wide geographic range and contains 142 DOU and 232 TOU observations. Photosynthetically active sediments have been excluded, and a few data points in strongly O2-depleted environments (i.e. intense upwelling zones or semi-enclosed basins) which otherwise would confound the general depth relation have been omitted. The data-sets reflect a large scatter without any latitude trend, but are reasonably well fitted by two simple power functions (). The fit is not corrected for skewness or the fact that some data points, to varying extent, reflect averages of several observations. Overall, benthic O2 uptake rates decrease by more than three orders of magnitude from coastal fauna-rich environments to the central gyres of the open oceans. In correspondence to , the DOU and TOU seem to converge with increasing water depth, but as expected from a general compilation (rather than only using studies with parallel DOU and TOU measurements) the attenuation coefficients of the two data-sets are not significantly different.
Figure 16. The total O2 uptake (closed symbols) and diffusive O2 uptake (open symbol) plotted as a function of the water depth (the compiled data-set only includes in situ data as extracted from Pamatmat & Banse Citation1969; Pamatmat Citation1971; Smith Citation1978, Citation1987; Smith et al. Citation1978, Citation1994, Citation1997; Hinga et al. Citation1979; Rowe & Gardner Citation1979; Berelson et al. 1987, Citation1990, Citation1996; Reimers Citation1987; Jahnke & Christensen Citation1989; Jahnke Citation1990; Jahnke et al. Citation1990, Citation1994; Pomeroy et al. Citation1991; Archer & Devol Citation1992; Reimers et al. Citation1992; Pfannkuche 1993; Boucher et al. Citation1994; Glud et al. Citation1994a, 1998a, 1999b, 2000b, 2003, 2005; Hales et al. Citation1994; Miller-Way et al. Citation1994; Sayles et al. Citation1994; Gundersen et al. Citation1995; Hammond et al. Citation1996; Nielsen & Glud Citation1996; Tahey et al. Citation1996; Duineveld et al. Citation1997a,Citationb; Epping & Helder Citation1997; Hales & Emerson Citation1997; Lohse et al. Citation1998; Moodley et al. Citation1998; Forster et al. Citation1999; Witte & Pfannkuche Citation2000; Sauter et al. Citation2001; Wenzhöfer et al. Citation2001a,Citationb, Citation2002; Glud & Gundersen Citation2002; Wenzhöfer & Glud Citation2002; Berg et al. Citation2003a; Rabouille et al. Citation2003; Ståhl et al. Citation2004a,Citationb; Witte et al. Citation2003a).
Combining the relationship for TOU versus water depth with the bathymetry of the global ocean (as extracted from the ETOPO5 global topography data-set), the global benthic O2 consumption amounts to 152 Tmol O2 year−1. Assuming a respiratory quotient (i.e. the DIC/O2 exchange ratio) of 1.2, this corresponds to an annual global carbon mineralization rate of 1.52 Gton C (the corresponding values for the DOU relation amounts to 1.26 Gton C). Continental margins (0–200 m) contribute 39%, continental slopes (200–2000 m) 17%, while the deep sea (>2000 m) accounts for 44% of the global benthic carbon mineralization. Using a more conventional definition of the deep sea (i.e. >1000 m), the mineralization rate of this compartment amounts to 74.7 Tmol O2 year−1, equivalent to roughly 50% of the global benthic carbon mineralization. Previous estimates based on other approaches range from 54.3 to 79.6 Tmol O2 year−1 for the same depth interval (Jahnke Citation1996; Christensen Citation2000). These values bracket the simplified approach above. The simple extrapolation above predicts that sediments in the depth range of 0–1000 m are responsible for half the benthic mineralization in the ocean, even though they only account for 7% of the ocean area ().
Figure 17. The cumulative contribution of sediments in various depth ranges to the global benthic mineralization. The figure is calculated on the basis of the relations in and the bathymetry of the oceans.
The value for coastal areas is poorly constrained as sandy environments are grossly under-sampled and sites expressing net benthic photosynthesis are excluded. Shallow water sediments with periodically benthic primary production probably represent areas with very high turnover rates of organic material (e.g. del Giorgio & Williams Citation2005). But generally the quantitative importance of benthic primary production and its recycling is poorly confined (see below).
The average annual primary production of the water columns overlying sediments in the following depth ranges: 0–200, 200–2000, >2000 m, have been estimated to 230, 150 and 94 g C m−2 year−1, respectively (Wollast Citation1998). It follows from the simple calculations above that benthic mineralization amounts to 15.2, 5.4 and 2.3% of the primary production in these respective compartments. The remainder is primarily respired in the water column and to lesser extent retained in the sediment record.
In a recent compilation (including shipboard incubations at water depths <1500 m) the TOU–depth relation was approximated by an equation hosting two exponential relations to account for depth variation in the vertical transport of particulate organic material: TOU = K((1 − p)e−az+pe−bz), where z represents the water depth, and K, P, a, b, are various fitting coefficients (Andersson et al. Citation2004). The approach improves on the significance of a single exponential fit (to R2=0.68, n = 490), but the fitting coefficients were not well constrained even though their inclusion is well rationalized when evaluating changes in degradation kinetics of sinking aggregates (Andersson et al. Citation2004). Using this approach the global benthic O2 consumption (water depths >200 m) was estimated to be 157 Tmol O2 year−1, while values for the deep sea (defined as water depths >1000 m) became as high as 129 Tmol O2 year−1 – well above any previous (and the present) estimates (Andersson et al. Citation2004).
Water depth is the one single parameter that best correlates to measured values of benthic O2 uptake – this has been concluded from a number of investigations (e.g. Wenzhöfer & Glud Citation2002; Andersson et al. Citation2004). However, as indicated by the scatter of , benthic O2 consumption differs substantially between sediments resting at the same water depth. Causes include variations in the O2 concentration of the bottom water, the temperature and the faunal community structure. Furthermore, vertical carbon transport velocities are highly variable and differ between settings (e.g. Berelson Citation2002) and lateral transport of organic material down-slope of margin sediments has been observed (e.g. Hecker Citation1990) and probably explains intensified degradation activity along some ocean margins (Jahnke et al. Citation1990). However, the most obvious single parameter that varies between sediments along isobaths is the surface primary production. Plotting benthic O2 exchange rates for the South Atlantic Ocean against the water depth reveals clustering where data from upwelling areas follow an upward-shifted attenuation curve as compared to data from less productive areas ().
Figure 18. In situ DOU measured in areas of high (closed symbols) and low productivity in the Atlantic Ocean. Curve fit described in the text (redrawn from Wenzhöfer & Glud Citation2002).
To account for spatial variability in primary production, double exponential fitting equations for TOU and DOU in the South Atlantic Ocean were developed: TOUC=PP1.407 z−0.492 and DOUC=PP0.736 z−0.331, where the subscript C indicates a conversion from O2 to carbon equivalents, PP represents the primary production (g C m−2 year−1), and z the water depth (m) (Wenzhöfer & Glud Citation2002). The improved fitting equations were used to construct maps of benthic O2 uptake rates using digitized maps of the two variables: the water depth (from the ETOPO5 database) and the annual primary production estimated from satellite mapping (Behrenfeld & Falkowski Citation1997). The maps reflect the observed regional differences, and the importance of primary production for the spatial variations in benthic O2 exchange rates (). Likewise, maps for the fauna-mediated O2 uptake and the O2 penetration depth were constructed (Wenzhöfer & Glud Citation2002).
Figure 19. Calculated maps of the DOU and TOU for the sediments of the Atlantic Ocean (redrawn from Wenzhöfer & Glud Citation2002).
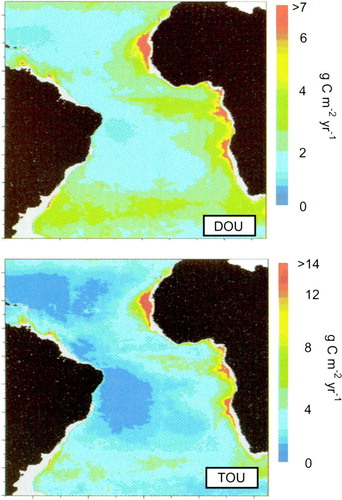
Extrapolated to the entire South Atlantic Ocean (water depth >1000 m), the TOUC amounted to 0.17 Gton C year−1 while the value for DOUC was 0.13 Gton C year−1 corresponding to 2.1 and 1.7% of the estimated annual primary production for the area (Wenzhöfer & Glud Citation2002). Extrapolated to the entire Atlantic Ocean, the values were 161 and 128% higher than estimates made by Jahnke (Citation1996), and 107 and 85% of estimates made by Christensen (Citation2000) using other and different approaches to constrain the rates of benthic mineralization of the Atlantic Ocean.
The particulate organic carbon (POC) fluxes inferred from general empirical relations between primary production and sediment trap data (Berger et al. Citation1988), or directly measured by sediment traps in the vicinity of our lander deployments (Fischer et al. Citation2000), were not sufficient to support either the measured or the extrapolated estimates for benthic carbon requirement (Wenzhöfer & Glud Citation2002). This was especially true close to upwelling areas but also in some of the deeper sites. Inconsistency between sediment trap data, vertical flux estimates and measured benthic requirements has been observed in a number of other studies (e.g. Smith Citation1987; Smith & Kaufmann Citation1999; Witte & Pfannkuche Citation2000; Andersson et al. Citation2004; Seiter et al. Citation2005).
An impressive eight-year time series in the eastern North Pacific revealed a consistent deficit in the POC supply as measured by sediment traps compared to the benthic carbon requirement quantified from in situ TOU measurements (Smith et al. Citation2001). On average, the POC flux only supported 57% of the measured benthic carbon requirement. The discrepancy can be related to consistent underestimation of POC flux by trap approaches, lateral down-slope transport of organic carbon, and/or quantitative important benthic uptake of dissolved organic matter. Alternatively, in some regions the discrepancy can truly represent an imbalance induced by climatic changes that ultimately will lead to a benthic community shift, but as the benthic respiration in deep-sea environments to a large extent often relies on accumulated organic material, the transition can extend over several decades (Smith & Kaufmann Citation1999; Smith et al. Citation2001).
When comparing data-sets from sediment traps and benthic community respiration it is important to realize that the two measurements integrate different time-scales. Even though sediment O2 uptake increases immediately upon carbon enrichment (e.g. Witte et al. Citation2003a), a fraction of the organic material degraded at any time is more refractory and may have half-life times that scale with months to centuries (e.g. Fenchel et al. Citation1998). Likewise, a fraction of the benthic O2 consumption is used for reoxidation of products from anaerobic degradation that might have accumulated on long time-scales (see Introduction). Thus, the total benthic O2 uptake at a given time integrates a longer time-scale than covered by most sediment trap data (see next section). Thus, the total benthic O2 uptake at a given time integrates a different time-scale than covered by the sediment trap data (see also section 3.3). However, having said that, the compiled data-set in probably only rarely includes events of short-term-intensified activity following bloom settlement.
Despite a steady increase in the database of high-quality benthic O2 exchange rates, the investigated sites only represent a minute fraction of the global seafloor, and many areas are highly under-explored (e.g. the polar regions, the Indian Ocean and the central gyres). Further, we still know very little about inter-annual or seasonal variability in the benthic O2 uptake especially in deeper waters.
Seasonality of the benthic oxygen uptake
It is well known that the pelagic primary production shows distinct seasonal patterns governed by nutrient and light availability. In many temperate, coastal environments, the dynamic is characterized by a distinct spring and autumn bloom that is reflected in the vertical POC transport (e.g. Olesen & Lundsgaard Citation1995). Numerous laboratory investigations have simulated sedimentation of plankton blooms and followed the benthic response that is characterized by a large and immediate increase in the benthic O2 uptake and a gradual decline to the background level within a number of days to weeks (e.g. Hansen & Blackburn Citation1992). However, even though such responses have been observed in situ, the response is often less distinct in coastal waters. This is caused by reduced O2 availability in stratified waters during bloom settlements limiting the potentially high O2 uptake of the carbon-enriched sediment (e.g. Rasmussen & Jørgensen Citation1992; Cowan et al. Citation1996).
During a 1.5-year seasonal study in Aarhus Bay, the bottom water O2 concentration decreased by 40–60% following the sedimentation of each of three successive blooms (). At each event, there was a distinct increase in the average volume-specific O2 consumption rate (Rvol), while the O2 penetration depth decreased as a consequence of the intensified activity and the reduced O2 availability (). On a seasonal basis, the two parameters varied by a factor of 13 (from 2.5 to 34 mmol cm−3 day−1) and 9 (from 0.5 to 4.5 mm), respectively. In contrast the in situ DOU (and TOU) only showed a moderate seasonal variation (from 8 to 30 mmol m−2 day−1) due to reduced O2 availability during periods of carbon enrichment. This led to an accumulation of reduced solids and solutes from anaerobic degradation that first were reoxidized as the O2 conditions in the bottom water improved, and the labile carbon pool became exhausted. The benthic O2 uptake for each of the four seasons therefore showed little variation (D, ), even though the seasonality of the carbon mineralization was more extensive as reflected by a larger seasonal variation in the Rvol (see above) and the DIC exchange rate as determined in recovered sediment cores (Lomstein & Blackburn Citation1992).
Figure 20. Seasonal variations in the bottom water O2 concentration (A), the average volume-specific O2 consumption (Rvol) (B), the O2 penetration (C) and the DOU (D) measured in central Aarhus Bay (1990–1991). Grey bars reflect periods with intensified sedimentation (redrawn from Glud et al. 2003).
Figure 21. The relative contribution of the four seasons (each of three months) to the annual benthic oxygen uptake at 16 m water depth in central Aarhus Bay (data from Glud et al. 2003).
In polar regions, a single phytoplankton bloom is typically initiated by melting or displacement of the sea-ice cover (e.g. Rao & Platt Citation1984). This is typically followed by a distinct vertical pulse of organic material (e.g. Rysgaard & Sejr Citation2007). During a seasonal study in Young Sound, NE Greenland, the event triggered a 2.5-fold increase in the benthic O2 uptake but the rates declined to a stable background level within a month (Rysgaard et al. Citation1998). The pulse of labile material reaching the sediment during summer was thus soon consumed, and the benthic O2 uptake remained at a constant level of 5–6 mmol m−2 day−1 during most of the year (A). A more refractory organic carbon pool sustained these background rates. The stimulated benthic O2 uptake induced by the bloom only corresponded to ∼8% of the annual activity (Rysgaard et al. Citation1998 ), and the dynamic annual response in the benthic O2 uptake could be modeled assuming two pools of benthic organic material with decay constants of 0.1 and 80 year−1, respectively (Berg et al. Citation2003b). The results suggest a modest inter-annual and seasonal variability in benthic O2 uptake in coastal polar settings as a significant part of the heterotrophic activity is fueled by relatively refractory material (Thamdrup et al. Citation2007).
Figure 22. (A) Consecutive measurements of TOU measured in four cores recovered from Young Sound (NE Greenland) at 36 m water depth just after the summer bloom had settled. After the labile organic material was consumed the O2 uptake remained at 5–6 mmol m−2 day−1 for >400 days without addition of any organic carbon. (B) Microprofiles measured just after core recovery and after 400 days in the laboratory. This reflects the gradual downward migration of O2 as Rvol declines along with the pool of organic carbon and reduced inorganic materials (redrawn from Thamdrup et al. Citation2007).
In general the benthic O2 uptake of Arctic sediments compares to rates of temperate or even tropical areas (Hulth et al. Citation1994; Glud et al. 1998a, 2000b and references therein) and the highest biomass densities of macrofauna ever recorded have been found in Arctic regions (e.g. Zenkevitch Citation1963). Work at the Svalbard archipelago shelf suggests that, by and large, the activity of benthic communities in polar regions is limited by the organic carbon supply rather than the low temperatures (e.g. Kostka 1999; Arnosti & Jørgensen Citation2003). The long-term carbon burial rates and the relative importance of the respective diagenetic pathways do not seem to be affected by low in situ temperature (Glud et al. 1998a; Kostka et al. Citation1999; Thamdrup et al. Citation2007). However, despite psycrophilic adaptation of the benthic communities in the Arctic (e.g. Thamdrup & Fleischer Citation1998), the study in Young Sound indicated a less distinct benthic pelagic coupling due to lower degradation efficiency at the low temperature, i.e. a more outspread release of nutrients and DIC following the settlement of a pelagic bloom as compared to lower latitudes (Thamdrup et al. Citation2007). In fact it could be speculated that in case the pelagic degradation is impeded by low temperature in seasonally ice-covered areas the importance of benthic mineralization becomes relatively more important due to a higher net deposition. Long-term accumulation of labile organic material at the West Antarctic Peninsula shelf was interpreted as reduced degradation efficiency at low temperatures (Mincks et al. Citation2005). More work is required to clarify the effect of temperature on benthic diagenetic process rates.
In general, the seasonality of organic carbon production in coastal subtropical and especially tropical areas is less explicit than in temperate or polar regions (Eyre & Balls Citation1999). The variations in water column production and thus in benthic carbon inputs is mainly driven by changes in wind patterns driving shorter or longer irregular upwelling periods or variations in precipitation regulating local river inputs (e.g. Peterson et al. Citation1988; Eyre & Ferguson Citation2005). Such patterns are seasonal, but they can also be erratic and extremely dramatic (Eyre & Ferguson Citation2006).
The benthic O2 uptake in coastal and shelf areas expresses a temporal variability related to the input of organic material. Such variability can be logistically difficult to include during in situ studies. However, the two examples discussed above suggest that the annual contribution of periods with elevated activity following natural carbon enrichment is minor. Thus proper seasonal representation of benthic O2 uptake may not be critical for robust O2 or carbon mineralization budgets in many environments. Episodic resuspension events are probably more important to include in the annual budget. Even short-term resuspension of reduced sediment layers may enhance the O2 uptake many fold and correspond to a diffusive-mediated O2 uptake of several weeks (e.g. Jørgensen Citation1996a). Such events are probably important for reoxidation of reduced surface sediment and in maintaining a high sulfide buffer capacity in coastal environments. The quantitative importance of in situ resuspension events for estimates on benthic mineralization ought to receive more attention in the coming years (Tengberg et al. Citation2003).
For deep-sea environments, it was for a long time anticipated that seasonality in particle flux was significantly dampened before the material reached the sea floor. Seasonal in situ studies in the Sargasso Sea supported this (Sayles et al. Citation1994), and even variable sedimentation of low-reactive organic material will lead to a relatively invariable benthic O2 demand (Katsev et al. Citation2006). However, a large body of evidence now documents the fast vertical transport of labile organic material from the photic zone to the deep-sea floor during bloom events (e.g. Billett et al. 1983; Nair et al. Citation1989). Deep-sea sediments express a similar response to carbon enrichment as coastal sediments and rapidly process labile organic material (Witte et al. Citation2003b; Moodley et al. Citation2005) and observations confirm increases in microbial and meiofauna biomass days to weeks after sedimentation events (Graf Citation1989; Pfannkuche et al. Citation1999). On longer time-scales, shifts in deep-sea benthic community structure of megafauna has been related to changes in food supply following El Niño and La Niña events (Ruhl & Smith Citation2004). Deep-sea sediments appear to be more dynamic than previously thought and benthic O2 uptake in many abyssal areas apparently varies on a seasonal time-scale (Smith & Baldwin Citation1984; Smith et al. Citation2001). However, to better understand the quantitative importance of these episodic events for the annual O2 budget, long-term high-resolution time series are required – data that can only be obtained by long-term deployable transecting vehicles (Smith et al. Citation1997) or via benthic observatories (Thiel et al. Citation1994; Pfannkuche & Linke Citation2003). Such abilities still remain to be fully established, but several initiatives for including benthic mineralization as a monitoring parameter on observatories and cable networks have been initiated.
Small-scale spatial variability and microniches
Early laboratory-based O2 microelectrode measurements documented extensive small-scale variability in microbial mats (e.g. Jørgensen & Revsbech Citation1983; Jørgensen et al. Citation1983). For marine sediments, larger funnels, burrow structures and sediment topography have received some attention (see above), but the consequence of micro patchiness for benthic O2 distribution has rarely been quantitatively assessed. However, simple visual inspection of the marine sediment surfaces clearly reveals an extensive small-scale heterogeneity; tracks of moving fauna, faecal and detritus deposits, patches of microalgae and small carcasses leave the impression of a varied landscape rather than a homogenous surface ().
Figure 23. Three in situ images taken below an operating profiling lander deployed at water depth between 115 and 175 m around the Svalbard archipelago (photographs by O. Holby and R.N. Glud).
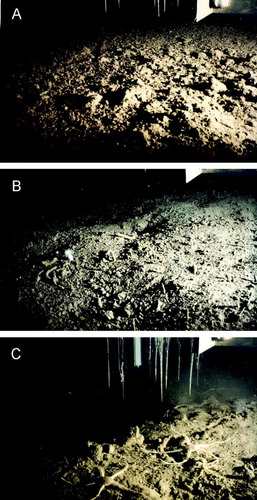
Microtransects in sediment recovered from water depths >100 m documented a large small-scale variability in the O2 distribution. Most was ascribed to polychaete activity and burrow structures, but the DOU varied by a factor >2, within a horizontal distance of a few millimeters even in areas without any visible faunal activity (Jørgensen et al. Citation2005). Parallel in situ measurements also revealed an extensive horizontal variability on the centimeter-scale that complicated area extrapolation of a few point measurements (Glud et al. 1998a). Detailed analysis of in situ microelectrode measurements and core incubations from a shallow-water Mediterranean embayment suggested a small-scale spatial variability in O2 uptake associated with ‘organic hot-spots’ (Rabouille et al. Citation2003). In situ microprofiles (n = 45) measured along a 175 m transect in central Sagami Bay (water depth 1450 m) showed that the DOU varied by a factor of >10 (average 2.6±1.6 mmol m−2 day−1), while the O2 penetration depth varied by a factor of 6 (average 3.5±1.3 mm). The variability in DOU and O2 penetration depth appeared to be associated with a small-scale heterogeneity that was smaller than the distance between two neighboring microelectrodes on the measuring cylinder (∼3 cm) (Glud et al. Citation2005). Parallel in situ planar O2 optode measurements (n = 6) provided additional information on the O2 distribution and allowed the extraction of ∼350 vertical microprofiles separated by a horizontal distance down to 1 mm. Detailed statistical analysis of the combined data-set revealed that the O2 penetration varied at a characteristic patch size of ∼2 cm (i.e. profiles separated by less than this spatial distance were more similar than profiles separated by larger distances) (Glud et al. Citation2005). A similar investigation performed in central Øresund, Denmark indicated a characteristic patch size <0.5 cm (Glud et al. Citation2001). Based on these investigations, variations in the O2 penetration depth of sediments appear to be structured in small-scale patches with a characteristic size between 5 and 20 mm.
Similar observations were made recently by deploying a transecting microprofiler that resolved 132 microprofiles within an area of 25 cm2. Even though the O2 isolines roughly followed the sediment relief, the O2 penetration depth – a proxy for the microbial activity – expressed extreme small-scale variability (A). The underlying reason for this pattern remains to be resolved, but it could be associated with characteristic faunal behavior or the size distribution of sedimenting aggregates. Reasonable fits between DOU and O2 penetration depths as derived from compiled in situ O2 microprofiles have previously been used as a general indication of: (1) steady-state benthic O2 distribution; (2) that activity and organic material was evenly distributed in the upper sediment; and (3) that bioirrigation was negligible at least for shelf and slope sediments (Cai and Sayles Citation1996). The measurements in Sagami Bay suggest otherwise (B) and the evidence that the O2 environment of marine sediments is highly variable and dynamic is increasing.
Figure 24. (A) The in situ O2 concentration across the sediment water interface as derived from 33 O2 microprofiles measured at an equistant distance of 7.0 mm. The relative position of the sediment surface was derived from a distinct break in the concentration gradients. (B) The DOU depicted as a function of the O2 penetration depth as derived from individual O2 microprofiles measured along two microtransects (n = 60). The solid line indicates L = 2ϕDs (Cw/DOU), which has been proposed as a relation for describing the O2 penetration (L) as a function of the O2 concentration (Cw) and the DOU in homogenous sediments at steady state (Cai & Sayles Citation1996). The equation describes the general trend of the data, but the scatter indicates a substantial heterogeneity in the controls regulating the O2 distribution.
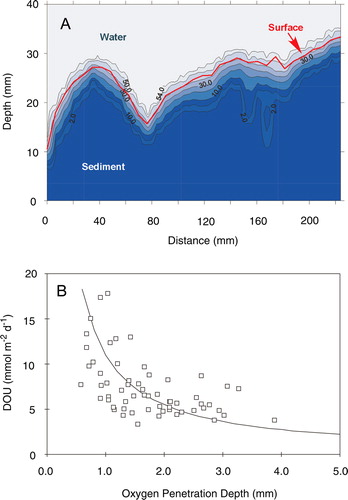
The existence of anoxic microniches in oxic sediments has been repeatedly discussed and postulated for almost half a century in order to explain porewater profiles and organism distributions indicating anaerobic activity in otherwise presumed oxic environments (e.g. Emery & Rittenberg 1956; Jørgensen Citation1977; Jahnke Citation1985; Brandes & Devol Citation1995; Sakita & Kusda Citation2000). However, whereas reduced microniches in suboxic sediment layers are commonly observed as black enclosures or spots (e.g. Jørgensen Citation1977), no one has to my knowledge encountered a true anoxic microniche despite measurements of thousands of O2 microprofiles.
Anoxic microniches have been demonstrated in suspended marine snow aggregates (e.g. Ploug et al. Citation1997), but it is generally anticipated to be an ephemeral phenomenon with minor quantitative importance for the pelagic environment (Simon et al. Citation2002). However, since such aggregates or flocks settle on the sediment, any advective O2 transport is retarded and the geometry of the diffusive-mediated O2 supply is changed (e.g. Ploug & Grossart Citation1999). Theoretical considerations have shown how the potential development of an anoxic microniche depends on the microbial respiration rate in the aggregate, the activity of the surrounding sediment, the aggregate size, the O2 concentration of the water phase and the O2 penetration depth of the sediment (e.g. Jørgensen Citation1977; Jahnke Citation1985; Brandes & Devol Citation1995). In areas with relatively shallow O2 penetration, a potential anoxic microniche will presumably fuse with the zero-isoline of the sediment and merely lead to a change in the topographic relief of the oxic–anoxic interface. Indications of anaerobic processes in the presumed oxic sediment horizon as inferred from porewater profiles (e.g. Brandes & Devol Citation1995) are in many instances probably the consequence of an area integration of solute concentrations across an oxic–anoxic interface that on the scale of millimeters to centimeters can exhibit an extensive topography (). However, planar optodes represent a complementary tool that can provide insights into the microdynamics of O2 around settling aggregates. Continuous O2 imaging during a flume study showed that short-lived (<7–8 h) true anoxic microniches developed during the degradation of 1–2 mm large diatom aggregates that settled on recovered sediment (). Such events are difficult to capture in situ or to study by invasive microelectrode measurements but can be ‘induced’ in front of a planar optode. Planar optode measurements have also documented that larger anoxic niches can develop around degrading Ulva lactuca pieces buried in permeable sand with a broad oxic zone induced by advection (Franke et al. Citation2006). Interpretation of planar optode-derived O2 images have to account for the fact that measurements are performed along a wall which affects the diffusion geometry (see below) – but experiments using planar optode imaging show that anoxic microniches can be induced in natural sediments and such data will help us to validate and optimize theoretical models allowing us to evaluate the potential importance of anoxic microniches for the benthic diagenesis.
Figure 25. The O2 dynamic around a 2 mm large skelatonema aggregate placed on a dark-incubated, homogenized sediment. A true anoxic microniche evolves after a lag period as the aggregate gradually decompose (Glud, Nordi, Zang, Sochaczewski & Davidson, manuscript in preparation).
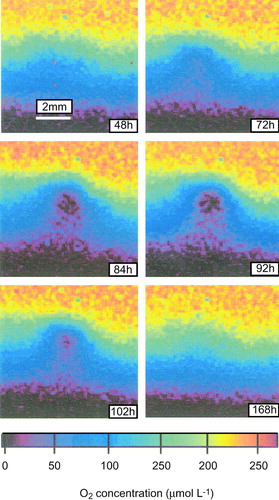
Whereas the existence of anoxic microniches remains controversial, the importance of oxic micro- or mininiches have been documented in a number of studies. Oxic microniches are most commonly induced by faunal activity or burrow flushing (see above), irregular advection of permeable sediments (Cook et al. Citation2007a) or leakage from plant roots (Caffrey & Kemp Citation1991). Seagrasses are estimated to cover ∼10% of the global coastal zone and represent an important component in many coastal ecosystems (e.g. Larkum et al. Citation2006). They are obligate aerobes and thus maintain an efficient O2 supply to their root system via interconnected gas lacunae. This may lead to an O2 loss along the roots and various incubation approaches of entire root systems in artificial media have been applied to estimate the total O2 loss from seagrass and macrophyte roots (e.g. Sand-Jensen et al. Citation1982; Caffrey & Kemp Citation1991). However, such approaches poorly reflect natural conditions and give no insight on where the O2 leakage occurs.
Microsensor studies have confirmed that some seagrasses develop a barrier toward O2 permeation along most of the root length (Connell et al. Citation1999), but only very recently it was documented that for Zostera marina only the very root tips – representing less than a few percent of the rhizosome area – apparently leak O2 to the surrounding sediment (Jensen et al. Citation2005). The radial O2 loss induced small oxic lenses of 2×6 mm around the root tips depending on the photosynthetic activity of the plant (Jensen et al. Citation2005). A parallel planar optode study on the entire rhizosphere growing in intact sediment beds confirmed these findings and documented the extreme dynamic of such microniches (Frederiksen & Glud Citation2006). Oxygen loss from the root tips depended on the photosynthetic activity of the plant, the O2 concentration in the overlying water and the root age (Frederiksen & Glud Citation2006). The roots of the investigated plants grew ∼9 mm day−1, and the rhizosphere was thus characterized by a constantly changing mosaic of oxic microniches that developed into reduced sediment leaving an anoxic but oxidized shield around the mature roots ( ). As the roots became older than 7 days they stopped growing and O2 leakage ceased. For actively growing roots, O2 leakage only ceased as the O2 concentration of the overlying water decreased below 70 µM (25% air saturation) in darkness – at this point the shielding O2 niche around the root tips had vanished and potential reduced phytotoxins like H2S and Fe2 + could enter the root system. Extrapolating the findings to a typical seagrass bed with a shoot-density of ∼900 m2, the diurnal O2 leakage from the root system only corresponded to 10–15% of the O2 uptake along the primary interface (Jensen et al 2005; Frederiksen & Glud Citation2006) and, as such, O2 leakage from the rhizosphere only played a minor role for the total benthic O2 consumption rate. Nevertheless, the radial O2 loss from the root tips might have important biogeochemical consequences locally by increasing the sulfide buffer capacity, but the transient nature of the microniches probably inhibits the development of large densities of aerobic sulfide oxidizing bacteria or nitrifiers. Combined with intense competition for NH4 + around active plant roots this explains the apparent lack of coupled nitrification–denitrification in seagrass rhizospheres (e.g. Risgaard-Petersen et al. Citation1998). It remains to be shown to what extent O2 leakage from other seagrasses exhibits similar dynamic as observed for Zostera marina. However, preliminary planar optode measurements performed in the rhizosphere of the tropical mangrove tree Avicennia marina also showed extensive dynamics where O2 leakage was regulated by root age, light exposure and ambient O2 availability as experienced during diel and tidal cycles (R. N. Glud et al., unpublished results ).
Figure 26. (A) Black and white image of a Zostera marina rhizosphere with corresponding O2 images obtained at 500 µmol photons m−2 s−1 (A1) and in darkness (A2). (B, C) Series of O2 images obtained at a 22 h interval (B, B2, B3) with corresponding black and white images (C1, C2, C3) (redrawn from Frederiksen & Glud Citation2006).
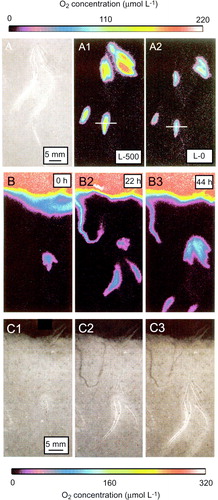
Experimental considerations of planar optode studies
Planar optode measurements complement traditional microsensor approaches. They overcome the problem of searching ‘for the needle in the haystack’ and they provide a much better temporal and spatial resolution of the O2 distribution. Furthermore, they can depict the O2 dynamics at a given area over many days. As such, they provide new insights into O2 dynamics around rhizospheres, microbial hot-spots, macro- and meiofauna, structures in permeable sands, and within phototrophic communities (Glud et al. Citation1999c, Citation2005; Precht et al. Citation2004; Wenzhöfer & Glud Citation2004; Franke et al. Citation2006; Frederiksen & Glud Citation2006; Oguri et al. Citation2006; Polerecky et al. 2006). By combining the technique with inverted periscopes, in situ investigations can be performed (Glud et al. Citation2001, Citation2005). The number of research groups applying and refining the technique is steadily increasing and other solutes like H+, CO2 and NH4 + can now be imaged by similar approaches (e.g. Hulth et al. Citation2002; Strömberg & Hulth Citation2005; Zhu et al. Citation2005, Citation2006a ; Stahl et al. 2007).
A detailed discussion on the limitations and problems of different measuring approaches is beyond the scope of the present review. However, when evaluating planar optode data it is important to realize that the approach has limitations. The main constraint is that the work is being conducted along a wall. In the case of biofilm studies, this can be turned into an advantage as the O2 dynamics can be studied non-invasively at the base of a biofilm growing directly on the sensor (Glud et al. Citation1998b). However, in most applications O2 dynamics are studied around objects or structures positioned along the planar optode wall. Thereby, the sensor acts as an impermeable wall and will distort the three-dimensional O2 distribution (Polerecky et al. Citation2006). In case of radial or spherical diffusion geometry the planar optode will provide a skewed image of the O2 distribution around the structure. Assuming well-defined geometry, simple diffusion models can be used to ‘correct’ for the presence of an impermeable barrier (Frederiksen & Glud Citation2006; Polerecky et al. Citation2006). However, more elaborate work is in progress quantifying the distortion for various geometries as a function of solute transport and consumption rates. In principle, such models can be used to correct for the impermeable wall, but in most instances that will not be practical – especially during in situ work. But the models can be used to bracket the potential distortions. In general, one simply must be aware of the limitations when interpreting two-dimensional O2 images and deriving quantitative estimates.
Another problem of planar optodes is that a thin water film will stick to the sensor. Along interfaces between regions of advective and diffusive solute transport (i.e. the sediment–water interface, along burrow linings, the interstice of permeable sands) the presence of a wall can lead to distorted concentration gradients. Thus, calculations based on DBL gradients, for example obtained with planar optodes, should be done with caution (Glud et al. Citation1996b). A different problem is the potential interference with animal behavior. Walls may either attract or detract burrowing infauna dependent upon the sediment type (Dorgan et al. Citation2005) – and irrigation patterns may change if animals are situated along an impermeable wall that does not consume O2 or release H2S.
Specific problems for different planar optode set-ups should be accounted for in order to avoid artefacts. It would be too elaborate to discuss this here, but a general concern is related to light-scattering or -guidance in the various materials between the sensor chemistry and the camera lens (i.e. the support foil and the aquarium or periscope wall; see Franke Citation2005). This potential problem causes luminescent signals in one part of the image to affect other parts of the image and obtained O2 images could thus appear smeared. The effect depends on the applied light sources, filter settings, sensors, and materials but can be minimized and maybe even eliminated by proper choice of materials and calibration routines. In situ deployments pose a completely different set of problems where changes in local hydrodynamics or solute and particle smearing during periscope insertion potentially can affect the obtained data. Still more work is needed to evaluate the potential problems of using planar optodes, but interferences can often be avoided by proper choice of experimental set-up and – as for many other techniques – avoiding over-interpretation and ignoring inherent caveats. Complementary use of different available techniques often provides the best insight and the best quantitative basis for resolving benthic O2 dynamics.
Benthic microphytic production and O2 dynamics of photic sediments
In coastal regions, sunlight may penetrate the water column and reach the sediment surface. The spectral composition of light at the sediment surface differs from sunlight due to the specific absorption spectra of water, dissolved particles and pelagic primary producers, but may still sustain a significant benthic primary production (Cahoon Citation1999; Gattuso et al. Citation2006). The maximum water depth for actively growing benthic microalgae rarely exceeds 20–40 m, but active coralline macroalgae have been observed at depths well below 200 m, indicating that the area of benthic primary production can be quite extensive in oligotrophic regions (Steneck Citation1986).
In extreme environments with reduced metazoan grazing, i.e. hot springs, hypersaline ponds or ice-covered lakes with reduced or no metazoan grazing, the phototrophic communities gradually develop into thick, cyanobacteria-dominated microbial mats bearing resemblance to fossilized Precambrian stromatolitic communities (e.g. Castenholz Citation1984; Vopel & Hawes Citation2006). However, in typical coastal settings, benthic microphytes represent an excellent food source, and the fixed carbon is quickly moved up through the different trophic levels (e.g. Middelburg et al. Citation2000). Nevertheless, even in regions with thriving benthic fauna, the seafloor is often covered by brown or dark green phototrophic communities dominated by diatoms, dinoflagellates or cyanobacteria (). The benthic microphytes can take advantage of the nitrogen and phosphorus that is released from the underlying sediment and thereby deprive the pelagic community a nutrient source. In nutrient-limited settings with good light availability, they have a clear advantage over pelagic primary producers. Benthic microalgae compete efficiently with the microbial community for nutrients and their O2 production has profound effect on other diagenetic processes such as denitrification, nitrification, metal oxidation and sulfide oxidation (Rysgaard et al. 1995; Epping & Jørgensen Citation1996; Dalsgaard Citation2003).
Figure 27. (A) Photograph obtained at 20 m water depth in Young Sound (NE Greenland). The brown patches reflect occurrence of benthic diatoms (photograph by P.B. Christensen and M. Sejr). (B) Photograph taken at 2 m water depth at Heron Island (Australia). The sediment is covered by a layer of benthic dinoflagellates scarred by Holothurians grazing (photograph by N. Patten).
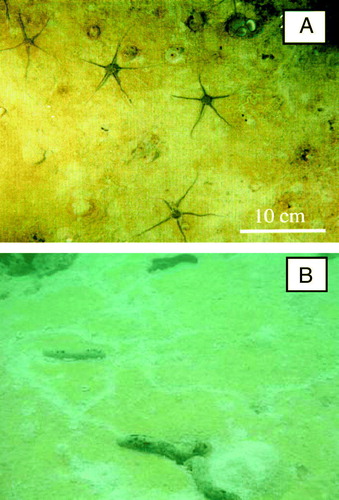
The potential importance of the benthic microphytic production in coastal ecosystems has received surprisingly little attention as compared to pelagic production especially in Arctic and tropical regions, and most benthic work in temperate settings has focused on intertidal communities (Cahoon Citation1999; Middelburg et al. Citation2005). Recent studies indicate a large importance of subtidal benthic microphytic production for ecosystem carbon cycling (Jahnke et al. Citation2000; Wenzhöfer et al. Citation2000; Glud et al. Citation2002; Dalsgaard Citation2003; Heil et al. Citation2004). The relatively few available studies make general conclusions and extrapolation to larger areas difficult. As an example; to my knowledge at present only five studies have quantified the benthic microphytic photosynthesis of polar regions that host roughly 30% of the global shelf area. To further complicate matters, the few available studies use different measuring techniques such as 14C incubation, various chamber incubation methods, and microsensor-based methods, that to various degrees each expresses gross or net photosynthetic activity. Studies on benthic primary production have so far been under-appreciated, and more studies on benthic primary production are needed to fully access coastal carbon cycling.
Each of the measuring strategies for accessing benthic primary production has its limitations and problems (e.g. Revsbech et al. Citation1981). However, microsensor-based measurements offer the possibility to study a given spot in extreme detail and to evaluate factors controlling the photosynthesis and related O2-consuming processes (e.g. Revsbech & Jørgensen Citation1983; Kühl et al. Citation1996).
O2 microsensor measurements in benthic microphytic communities
Oxygen microprofiles in light-exposed microphyte communities demonstrate supersaturation just below the sediment–water interface and a relatively large O2 penetration depth (). However, the photic zone is typically less than 1 mm due to the strong light attenuation within the compact communities (Kühl & Jørgensen Citation1992). The lower boundary for the zone of net O2 production is typically indicated by a turning-tangent on the concentration profile. From such O2 concentration profiles, the net photosynthetic activity can be calculated by accounting for the diffusive export of O2 away from the photic horizon (i.e. the upward flux through the DBL and the downward flux towards the deeper sediment layer) (). At light-saturating photosynthesis, the upward flux typically represents >70% of the total O2 export from the photic zone (Christensen et al. 2000 ; Wenzhöfer et al. Citation2000). The depth profile of net O2 production/consumption can be derived from analysis of the curvature of the steady-state O2 concentration profile as outlined above (Berg et al. Citation1998) or from transient O2 measurements at the respective sediment depth during light eclipse (Epping et al. Citation1999). However, even at moderate light intensities, the O2 concentration at the sediment surface can become supersaturated and bubble formation can complicate or invalidate flux calculations (Jørgensen et al. Citation1983).
Figure 28. An O2 microprofile measured in a sediment core recovered from 2 m water depth in Helsingør harbor. The sediment surface was covered by benthic diatoms and was exposed to a downwelling irradiance of 600 µmol photon m−2 s−1. The upward (Jup) and downward flux (Jdown) amounted to 190 and 63 mmol m−2 day−1, respectively, as calculated from Fick's first law of diffusion. The net photosynthesis was thus 253 mmol m−2 day−1. The depth profile of gross photosynthesis (bars) measured by the light–dark-shift technique equaled 339 mmol m−2 day−1. The respiration of the photic zone was thus 86 mmol m−2 day−1, while the O2 consumption of the upper millimeters during darkness only was 40 mmol m−2 day−1 (redrawn from Glud 2006).
Depth-integrated benthic net photosynthetic rates increase with light and gradually reach a saturation level but the community rarely expresses photoinhibition (). This is due to a gradual expansion of the photic zone with increasing light, and that downward migration allows organisms at the sediment surface to escape inhibiting light conditions. The photosynthetic capacity can be evaluated from plots of photosynthesis versus irradiance (PE relations) and derived key parameters like maximal photosynthetic activity (Pmax), the light compensation point and the initial increase of the O2 release (α) often differ markedly among communities (). The variability is mainly caused by variations in the adaptation to the local light conditions and the biomass. However, microphytobenthic communities quickly adapt to changing light conditions, and depth transects of in situ PE relations reflecting a gradual adaptation to lower light availability merge within hours (or days) when the communities are exposed to the same light conditions (Kühl et al. Citation2001; Glud et al. Citation2002).
Figure 29. PE relations as measured in three benthic communities all dominated by benthic diatoms. The data-sets were fitted by Pnet=Pmax(1 − exp(−αEd/Pmax)) + R, where Ed is the downwelling irradiance and R expresses the O2 consumption in darkness (for other constants see text). A few values used for the fitting procedure are off-scale data from Wenzhöfer et al. (Citation2000), Christensen et al. (Citation2003) and Glud et al. (Citation2002).
The depth profile of gross primary production can be determined by the so-called light–dark shift technique (Revsbech & Jørgensen Citation1983) (). In short, the technique calculates the gross primary production at a given depth from the rate by which O2 concentration declines after darkening assuming that the rate is equal to the steady-state O2 production in light. The approach assumes that O2 consumption and the O2 concentration gradients are unchanged during darkening and detailed investigations have documented that; in essence this is true as long as one uses the initial rate of O2 decline (Glud et al. Citation1992). If longer dark incubations (>1 s) are used, the activity profile will be smeared due to a net diffusion of O2 down the concentration gradients (Glud et al. Citation1992; Lassen et al. Citation1998). When longer dark incubations (i.e. 3–5 s) are applied in communities with steep concentration gradients and high photosynthetic activity the smearing will be extensive and the photosynthetic profiles will only poorly reflect the original activity distribution (Lassen et al. Citation1998). However, the depth-integrated O2 decline during darkness remains constant for at least 5 s (i.e. the O2 consumption rate within the photic zone is constant during this time interval) (Glud et al. Citation1992).
The depth-integrated gross photosynthetic activity exceeds the net photosynthesis (i.e. the O2 export from the photic zone). The difference is related to concurrent O2 consumption within the photic zone. Detailed microsensor investigations have shown that O2 consumption during light exposure is stimulated from 30 to more than 100% as compared to conditions in darkness (e.g. Glud et al. Citation1992; Canfield & Des Marais Citation1993; Kühl et al. Citation1996; Epping et al. Citation1999; Fenchel & Glud Citation2000).
The high gross photosynthetic activity of dense microphytobenthic communities leads to elevated pH and O2 concentrations, while CO2 becomes depleted. This is a hostile environment with many O2 radicals, and conditions are expected to induce intensive photorespiration (i.e. O2 reduction by RuBisCo) (Glud et al. Citation1992; Kühl et al. Citation1996). In such instances, leakage of photosynthates from photorespiration probably serves as an important carbon source for the heterotrophic organisms, and microautoradiography has shown cross-feeding of glycolate from the phototrophic to the heterotrophic community in microbial mats (e.g. Bateson & Ward Citation1988). Highly active phototrophic communities thereby, to a large extent, recycle the fixed carbon – i.e. photo-excretion stimulates heterotrophic activity which then produces CO2 and concurrently consumes O2. This activity lowers the extreme O2 levels of the community. Planar optode measurements in microbial mats have documented how light-stimulated photosynthesis enhances net O2 consumption in neighboring cell clusters especially during saturating light conditions – presumably as a consequence of photo-excretion (Glud et al. Citation1999c). At night, the accumulated labile organic material may lead to intensified heterotrophic activity that gradually declines as the labile carbon pool gradually becomes exhausted (Fenchel & Glud Citation2000; Tang & Kristensen Citation2007).
Light-stimulated O2 consumption is therefore mainly ascribed to elevated heterotrophic activity and photorespiration. However, intensified oxidation of reduced inorganic constituents that have accumulated in darkness can also be of quantitative importance. With a complementary microsensor-core-incubation study a budget for the 162 mmol m−2 day−1 of O2 produced during 12 h light by microphytobenthic photosynthesis was established. The stimulated heterotrophic activity/photorespiration was by far the dominant O2-consuming process, while export and oxidation processes were minor O2 sinks (). During the night, the mat went almost anoxic, and the relatively low O2 consumption rate (44 mmol m−2 day−1) was presumably dominated by oxidation of H2S produced by the sulfate-reducing bacteria (Fenchel & Glud Citation2000). Even though it is a common procedure, it cannot be recommended to estimate O2 consumption rates during light exposure from dark profiles. Similarly for chamber experiments, dark-incubated chambers do not express the O2 consumption rate in light and, furthermore, net rates in light and darkness compare the activity of different depth intervals as the O2 penetration depth differs between the two situations (Epping & Jørgensen Citation1996).
Figure 30. The relative importance of processes responsible for consuming the O2 produced during 12 h light exposure of a microphytobenthic community. The ‘respiration’ term includes photorespiration (data from Fenchel & Glud Citation2000).
In cohesive phototrophic communities, the DBL thickness affects to what extent the produced O2 is consumed or exported (Kühl et al. Citation1996; Garcia-Pichel et al. Citation1999; Larkum et al. Citation2003). By increasing the free flow velocity, the DBL thickness will decrease, and the upward O2 flux will increase. To the extent the gross photosynthesis is constant, the downward flux and the O2 consumption rate will decrease correspondingly (). If gross photosynthetic rates are limited by DIC availability, a reduction in the DBL thickness could be expected to increase the gross photosynthesis.
Figure 31. The upward (black) and downward (grey) O2 fluxes along with the inherent O2 consumption rate of the photic zone (white) as measured in a cyanobacteria-dominated biofilm exposed to different flow velocities. With increasing flow the upward O2 flux increases while the downward flux and respiration decreases. The total O2 production increases slightly with the flow presumably as a consequence of a higher DIC supply from the overlying water phase (data from Kühl et al. Citation1996).
Temperature is another important factor controling benthic photosynthesis and coupled O2 consumption (Wieland & Kühl Citation2000; Hancke & Glud Citation2004). Measurements in diatom-covered sediments expressed a gross photosynthetic Q10 response of 2.2–2.6 while the O2-consuming processes had Q10 values of 2.6–5.6 in the temperature range from 0 to ∼20°C. The sediment inhabited by the benthic microphytes and exposed to constant light conditions thus gradually turned net heterotrophic with increasing temperature (Hancke & Glud Citation2004). Whether this pattern only represents a short-term (diurnal) temperature response or also is induced by seasonal temperature changes still remains to be investigated. Salinity appears to be of minor importance as an environmental control for benthic photosynthesis (Garcia-Pichel et al. Citation1999).
As shown above, O2 microsensors can provide very detailed insights into the O2 dynamics of microphytobenthic communities including rates of O2 consumption and net and gross photosynthetic rates. However, the main problem in using such measurements for estimating benthic primary production is to extrapolate the findings beyond the investigated spot. Marine phototrophic sediments are extremely heterogeneous, and the resolved O2 exchange rates and O2 penetration depths vary extensively even within a few centimeters. It takes at least 30–40 min to obtain one data-set of net and gross photosynthesis which sets a limit to how many parallel measurements can be obtained, even when using sensor arrays (Holst et al. Citation1997). Planar optodes can complement traditional microsensor approaches, but the limitations of working along a wall and potential smearing during sensor insertion makes this approach less suited for accessing in situ benthic productivity.
The fluorescence emitted by the photosynthetic apparatus has been used as a proxy for biomass and photosynthetic activity of benthic microphytes (Schreiber et al. Citation1994; Hartig et al. Citation1998; Barranguet & Kromkamp Citation2000; Kühl et al. Citation2001; Glud et al. Citation2002). Using a diver-operated underwater Pulse Amplitude Modulated fluorometer (Diving PAM) that applies the ‘pulse saturation technique’, two relatively robust proxies for microphytobenthic biomass and photosynthesis can be measured in situ within a few minutes: the minimal florescence, F0, and the electron transport rate between photosystem II and I, ETR (Schreiber et al. Citation1986; Kühl et al. Citation2001). Empirical relationships between ETR and net photosynthesis derived from microprofiles have been established facilitating area extrapolation of microsensor measurements (Glud et al. Citation2002). Such relationships are far from universal, and frequent intercalibration during a study is required to obtain trustworthy results, but the technique may overcome the prime limitations of using microsensors for quantification of benthic primary production. PAM imaging applied either vertically across the sediment surface via inverted periscopes or horizontally above the sediment surface represents a promising approach to resolve and overcome small-scale variability in microphytobenthic distribution and activity (Grunwald & Kühl Citation2004).
A study in Young Sound NE Greenland showed that benthic diatoms covered the sediment surface at water depths <30 m (with a maximum biomass at 20 m water depth; Glud et al. Citation2002). The area hosting benthic productivity was equivalent to 15.1 km2 or 12% of the outer sound. By using a microsensor-derived PE relationship for net photosynthesis and accounting for light conditions and the diatom coverage at the respective depths, the net benthic photosynthetic rate for the sound was quantified. The estimated integrated net photosynthetic rate during the 80-day sea-ice-free period amounted to 311 tons C (Glud et al. Citation2002). For comparison, the gross primary production of the pelagic community for the same area and period estimated from short-term 14C incubations amounted to 113 tons C (Rysgaard et al. 1999 ; Glud et al. Citation2002). Thus, benthic primary production completely dominated the ecosystem production at water depth above 30 m (). Accounting for the entire sound, with an average water depth of 100 m, benthic microphytic net photosynthesis still amounted to 27% of the gross primary production of the water column. Even though the contribution from vascular macroalgae dominated, the budget underlines the potential importance of benthic microphytes for coastal ecosystem function and the need for further studies evaluating and quantifying benthic photosynthetic activity (Krause-Jensen et al. Citation2007).
Figure 32. The relative contribution of the respective primary producers to system production integrating areas having <30 m water depth in Young Sound (NE Greenland). The pelagic production expresses gross rate while the benthic compartments are net rates. An insignificant contribution from sea-ice algae has been ignored (data from Glud et al. Citation2002).
Most assessments of microphytobenthic primary production have been done by 14C-labeled DIC incubations or from chamber-derived benthic O2 exchange rates. The main problem with 14C incubations is estimating the specific activity of the DIC available for the phototrophic community during the incubation. This is complicated due to the extreme temporal and spatial variability and the steep DIC concentration gradient of intact communities. Slurry approaches that evenly distribute the tracer have been applied, but these drastically change the microenvironmental controls that regulate the activity. It is therefore difficult to quantify in situ benthic production from 14C incubations (Revsbech et al. Citation1981). Net photosynthesis calculated from chamber-derived total exchange rates of O2 are confounded by fauna-related O2 consumption and exchange across enclosed patches of bare sediment without microphyte coverage (Glud et al. Citation2002). None of the generally applied techniques are ideal, and to obtain trustworthy estimates, a combination of several complementary approaches is recommended.
Primary production in permeable sediments
Chamber incubations have shown that permeable sand holds a large potential for benthic primary production (Jahnke et al. Citation2000). Enhanced percolation as induced by increased stirring in cylindrical chambers (Janssen et al. Citation2005) often stimulates the O2 release rate of permeable sediments hosting microphytobenthic communities (). A recent study in sand demonstrated that percolation lowered the interstitial pH and overcame the diffusion-limited CO2 supply to benthic microphytes. Thereby, advection stimulated the depth-integrated benthic photosynthesis by 20% (Cook & Røy Citation2006). In permeable sediments, the enhanced solute transport may thus lower the photosynthetic stress (i.e. the O2/DIC ratio) and overcome the diffusion-limited DIC supply experienced by cohesive microphytic communities. The very few available O2 release rates of light-exposed sandy sediments are comparable to rates from cohesive sediments. This underlines the potential importance of primary production in coastal settings hosting permeable sand (Jahnke et al. Citation2000).
Figure 33. The O2 exchange rates measured in situ by circular chambers kept at different stirring/percolation rates. Measurements were performed at day and night and before (grey bars) and after (white bars) a massive bloom of dinoflagellates had covered the sand surface (B). Enhanced percolation clearly stimulated the benthic primary production and O2 consumption at night time prior to the bloom. The bloom lowered the permeability of the sediment and thus the imposed pressure gradient did not induce percolation and the O2 exchanges rates became less sensitive to stirring. 0 RPM mean that the overlying water was gently mixed without inducing a partial pressure gradient (redrawn from Glud et al. Citation2008).
Unless grazing or hydrodynamic forces keep the microphytobenthic biomass low, the sediment will gradually plug up, and advection will be reduced and eventually cease. A shift from an advective to a diffusive-dominated benthic system was observed as coral mass-spawning products were advected into carbonate sand at Heron Island, Australia. This induced a benthic bloom of dinoflagellates that took advantage of the released nutrients. Their coverage plugged up the sand until intensified grazing had re-set the system after 8–10 days ().
Concluding remarks
As described above, O2 exchange measurements represent a widely applied proxy for quantifying the benthic carbon mineralization and the primary production. During the last decades, much has been learned about benthic O2 dynamics. The introduction of in situ technology and O2 microsensors to aquatic biology represented milestones in this. Microsensors provided new and much better insights into benthic O2 dynamics, and new questions in relation to cycling of organic material in sediment were raised and addressed. This is a good example of how science benefits and progresses from the introduction of new technologies. However, there still exist many open questions that will require our attention in the coming years and many environments like permeable sands, the polar regions, the open oceans and the deep trenches are grossly under-studied. New exciting technologies like ‘eddy correlation’ and ‘planar optodes’ are now providing better insights, but also allow us to raise new fundamental questions about the function and activity of marine sediments; processes and benthic systems that previously were difficult to address quantitatively are now within our reach. The recent developments of benthic observatories and cable networks represent major advances. There is a huge potential in linking in situ operating systems for monitoring benthic O2 dynamics to such platforms, allowing a much better understanding of the temporal and spatial variability in benthic O2 dynamics and carbon cycling.
Editorial responsibility: Tom Fenchel
Acknowledgements
This manuscript is a shortened and revised version of the summary that was enclosed with my dissertation that was defended at the Faculty of Natural Sciences, University of Copenhagen on 26 June 2007 (the full thesis can be delivered from the secretariat of the faculty or from me). I would like to take this opportunity to thank many people: the defense-committee Kaj Sand-Jensen, Richard A. Jahnke and Clare E. Reimers for their efforts in evaluating my dissertation; thanks to the very many colleagues and co-authors with whom I have collaborated and to the very many TAs who have assisted me and helped me with all kinds of problems during my work; and thanks to my ‘mentors’ Bo Barker Jørgensen, Tom Fenchel and Niels Peter Revsbech, who all in their way have inspired me since I started as a student at the Department for Genetics and Ecology at Aarhus University. Thanks to Don Canfield, Tom Fenchel, Fillip Meysman and Jack Middelburg who all read and constructively commented upon the manuscript. Thanks to The Danish National Science Research Council, The Carlsberg Foundation, The European Commission and The Max Planck Society for financial support.
Notes
Published in collaboration with the University of Bergen and the Institute of Marine Research, Norway, and the Marine Biological Laboratory, University of Copenhagen, Denmark
Related Research Data
References
- Aller , JY and Aller , RC. 1986 . Evidence for localized enhancement of biological activity associated with tube and burrow structures in deep-sea sediments at the HEBBLE site, western North Atlantic . Deep-Sea Research I , 33 : 755 – 90 .
- Aller , RC. 1990 . Bioturbation and manganese cycling in hemipelagic sediments . Philosophical Transactions of the Royal Society of London A , 331 : 51 – 8 .
- Aller , RC. 1994 . Bioturbation and remineralization of sedimentary organic matter: effects of redox oscillation . Chemical Geology , 114 : 331 – 45 .
- Aller , RC. 2001 . “ Transport and reactions in the bioirrigated zone ” . In The Benthic Boundary Layer , Edited by: Boudreau , B and Jørgensen , BB . 269 – 301 . New York : Oxford University Press .
- Aller , RC. 2004 . Conceptual models of early diagenetic processes: the muddy seafloor as an unsteady, batch reactor . Journal of Marine Research I , 62 : 815 – 35 .
- Aller , RC and Aller , JY. 1992 . Meiofauna and solute transport in marine muds . Limnology and Oceanography , 37 : 1018 – 33 .
- Aller , RC , Hall , POJ , Rude , PD and Aller , JY. 1998 . Biogeochemical heterogeneity and suboxic diagenesis in hemipelagic sediments of the Panama Basin . Deep-Sea Research I , 45 : 133 – 65 .
- Aller , RC and Yingst , JY. 1985 . Effects of the marine deposit feeders Heteromastus filiformis (Polychaeta), Macoma baltica (Bivalvia), and Tellina texana (Bivalvia) on averaged sedimentary solute transport, reaction rates, and microbial distributions . Journal of Marine Research I , 43 : 615 – 45 .
- Ambrose , WG , Clough , LM , Tilney , PR and Beer , L. 2001 . Role of echinoderms in benthic remineralization in the Chukchi Sea . Marine Biology , 139 : 937 – 49 .
- Anderson , LG , Hall , POJ , Iverfeldt , Å , Rutgers van der Loeff , MM , Sundby , B and Westerlund , SFG. 1986 . Benthic respiration measured by total carbonate production . Limnology and Oceanography , 31 : 319 – 29 .
- Andersson , HJ , Wijsman , JWM , Herman , PMJ , Middelburg , JJ , Soetaert , K and Heip , C. 2004 . Respiration patterns in the deep Ocean . Geophysical Research Letters , 31 : L03304
- Andersson , LA and Sarmiento , JL. 1994 . Redfield ratios of remineralizaton determined by nutrient data-analysis . Global Biogeochemical Cycles , 8 : 65 – 80 .
- Andrews , D and Bennett , A. 1981 . Measurements of diffusivity near the sediment–water interface with a fine-scale resistivity probe . Geochimica et Cosmochimica Acta , 45 : 2169 – 75 .
- Archer , D and Devol , A. 1992 . Benthic oxygen fluxes on the Washington shelf and slope: a comparison of in situ microelectrode and chamber flux measurements . Limnology and Oceanography , 37 : 614 – 29 .
- Archer , D , Emerson , S and Smith , CR. 1989 . Direct measurement of the diffusive sublayer at the deep sea floor using oxygen microelectrodes . Nature , 340 : 623 – 6 .
- Archer , D and Meier-Reimer , E. 1994 . Effect of deep-sea sedimentary calcite preservation on atmospheric CO2 concentration . Nature , 367 : 260 – 3 .
- Arnosti , C and Jørgensen , BB. 2003 . High activity and low temperature optima of extracellular enzymes in Arctic sediments: implications for carbon cycling by heterotrophic microbial communities . Marine Ecology Progress Series , 249 : 15 – 24 .
- Banta , GT , Holmer , M , Jensen , MH and Kristensen , E. 1999 . Effects of two polychaete worms, Nereis diversicolor and Arinicola marina, on aerobic and anaerobic decomposition in a sandy marine sediment . Aquatic Microbial Ecology , 19 : 189 – 204 .
- Barranguet , C and Kromkamp , J. 2000 . Estimating production rates from photosynthetic electron transport in estuarine microphytobenthos . Marine Ecology Progress Series , 204 : 39 – 52 .
- Bateson , MM and Ward , DM. 1988 . Photoexcretion and fate of glycolate in a hot spring cyanobacterial mat . Applied and Environmental Microbiology , 54 : 1738 – 43 .
- Behrenfeld , MJ and Falkowski , PG. 1997 . Photosynthesis rates derived from satellite-based chlorophyll concentration . Limnology and Oceanography , 42 : 1 – 20 .
- Behrens , JW , Stahl , HJ , Steffensen , JF and Glud , RN. 2007 . Oxygen dynamics around buried lesser sandeel, Ammodytes tobiannus (Linnaeus, 1785); mode of ventilation and metabolic requirements . Journal of Experimental Biology , 210 : 1006 – 14 .
- Bender , M and Heggie , DT. 1984 . Fate of organic carbon reaching the sea floor: a status report . Geochimica et Cosmochimica Acta , 48 : 977 – 86 .
- Bender , M , Jahnke , R , Weiss , R , Martin , W , Heggie , DT , Orchardo , J and Sowers , T. 1989 . Organic carbon oxidation and benthic nitrogen and silica dynamics in San Clemente Basin, a continental borderland site . Geochimica et Cosmochimica Acta , 53 : 685 – 97 .
- Berelson , WM. 2002 . Particle sinking rates increase with depth in the ocean . Deep-Sea Research I , 49 : 237 – 51 .
- Berelson , WM , Hammond , DE and Johnson , KS. 1987 . In situ benthic flux measurement devices: bottom lander technology . Marine Technology Society Journal , 21 : 26 – 32 .
- Berelson , WM , Hammond , DE , O'Neill , D , Xu , X-M , Chin , C and Zukin , J. 1990 . Benthic fluxes and pore water studies from sediments of the central equatorial north Pacific: nutrient diagenesis . Geochimica et Cosmochimica Acta , 54 : 3001 – 12 .
- Berelson , WM , McManus , J , Coale , KH , Johnson , KS , Kilgore , T , Burdige , D and Pilskaln , C. 1996 . Biogenic matter diagenesis on the sea floor: a comparison between two continental margin transects . Journal of Marine Research I , 54 : 731 – 62 .
- Berg , P , Risgaard-Petersen , N and Rysgaard , S. 1998 . Interpretation of measured concentration profiles in sediment pore water . Limnology and Oceanography , 43 : 1500 – 10 .
- Berg , P , Røy , H , Janssen , F , Meyer , V and Jørgensen , BB. 2003a . Oxygen uptake by aquatic sediments measured with a novel non-invasive eddy-correlation technique . Marine Ecology Progress Series , 261 : 75 – 83 .
- Berg , P , Røy , H and Wiberg , PL. 2007 . Eddy correlation flux measurements: the sediment surface area that contributes to the flux . Limnology and Oceanography , 52 : 1672 – 84 .
- Berg , P , Rysgaard , S , Funch , P and Sejr , M. 2001 . Effects of bioturbation on solute and solids in marine sediments . Aquatic Microbial Ecology , 26 : 81 – 94 .
- Berg , P , Rysgaard , S and Thamdrup , B. 2003b . Dynamic modeling of early diagenesis and nutrient cycling. A case study in an arctic marine sediment . American Journal of Science , 303 : 905 – 55 .
- Berger , WH , Fisher , K , Lai , C and Wu , G. 1988 . “ Ocean carbon flux: global maps of primary production and export production ” . In Biogeochemical Cycling and Fluxes Between the Deep Euphotic Zone and Other Realms , Edited by: Agegian , CR . 131 – 76 . Silver Spring, MD : NOAA Undersea Research Program .
- Berner , RA. 1980 . Early Diagenesis: A Theoretical Approach , Princeton, NJ : Princeton University Press. 241 p .
- Berner , RA. 1987 . Models for carbon and sulfur cycles and atmospheric oxygen – application to paleozoic geologic history . American Journal of Science , 287 : 177 – 96 .
- Berner , RA and Canfield , DE. 1989 . A new model for atmospheric oxygen over phanerozoic time . American Journal of Science , 289 : 333 – 61 .
- Billett , DSM , Lampitt , RS , Rice , AL and Mantoura , RFC. 1983 . Seasonal sedimentation of phytoplankton to the deep-sea benthos . Nature , 302 : 520 – 2 .
- Boucher , G , Clavier , J and Garrigue , C. 1994 . Oxygen and carbon dioxide fluxes at the water–sediment interface of a tropical lagoon . Marine Ecology Progress Series , 107 : 185 – 93 .
- Boudreau , BP. 2001 . “ Solute transport above the sediment–water interface ” . In The Benthic Boundary Layer , Edited by: Boudreau , B and Jørgensen , BB . 104 – 23 . New York : Oxford University Press .
- Boudreau , BP and Guinasso , NL . 1982 . “ The influence of a diffusive sublayer on aggregation, dissolution and diagenesis at the sea floor ” . In The Dynamic Environment of the Seafloor , Edited by: Fanning , KA and Manheim , M . 115 – 45 . Lexington, MA : Lexington Books .
- Boudreau , BP and Meysman , FJR. 2006 . Predicted tortuosity of muds . Geology , 34 : 693 – 6 .
- Boudreau , BP and Scott , MR. 1978 . A model for the diffusion controlled growth of deep-sea manganese nodules . American Journal of Science , 278 : 903 – 29 .
- Bouldin , DR. 1968 . Models for describing the diffusion of oxygen and other mobile constituents across the mud–water interface . Journal of Ecology , 56 : 77 – 87 .
- Brand , A , Muller , B , Wuest , A , Dinkel , C , Revsbech , NP Nielsen , LP . 2007 . Microsensor for in situ flow measurements in benthic boundary layers at submillimeter resolution with extremely slow flow . Limnology and Oceanography Methods , 5 : 185 – 91 .
- Brandes , JA and Devol , AH. 1995 . Simultaneous nitrate and oxygen respiration in coastal sediments: evidence for discrete diagenesis . Journal of Marine Research I , 53 : 771 – 97 .
- Buchholtz-ten Brink , MR , Gust , G and Chavis , C. 1989 . Calibration and performance of a stirred benthic chamber . Deep-Sea Research I , 36 : 1083 – 101 .
- Caffrey , JM and Kemp , WM. 1991 . Seasonal and spatial patterns of oxygen production, respiration and root rhizome release in Potamogeton perfoliatus L. and Zostera marina L . Aquatic Botany , 40 : 109 – 28 .
- Cahoon , LB. 1999 . The role of benthic microalgae in neritic ecosystems . Oceanography and Marine Biology: An Annual Review , 37 : 47 – 86 .
- Cai , WJ and Sayles , FL. 1996 . Oxygen penetration depths and fluxes in marine sediments . Marine Chemistry , 52 : 123 – 31 .
- Canfield , DE. 1993 . “ Organic matter oxidation in marine sediments ” . In Interactions of C, N, P and S Biogeochemical Cycles and Global Change , Edited by: Wollast , R , Mackenzie , FT and Chou , L . 333 – 63 . Berlin : Springer .
- Canfield , DE. 1994 . Factors influencing organic carbon preservation in marine sediments . Chemical Geology , 114 : 315 – 29 .
- Canfield , DE and Des Marais , DJ. 1993 . Biogeochemical cycles of carbon, sulfur, and free oxygen in a microbial mat . Geochimica et Cosmochimica Acta , 58 : 3971 – 84 .
- Canfield , DE , Jørgensen , BB , Fossing , H , Glud , RN , Gundersen , JK Ramsing , NB . 1993 . Pathways of organic carbon oxidation in three continental margin sediments . Marine Geology , 113 : 2740
- Canfield DE , Kristensen E , Thamdrup B . 2005 . Aquatic Geomicrobiology . London : Elsevier . 640 p. (Advances in Marine Biology; 48) .
- Castenholz , RW. 1984 . “ Composition of hot spring microbial mats: a summary ” . In Microbial Mats: Stromatolites , Edited by: Cohen , Y , Castenholz , RW and Halvorsen , HO . 101 – 19 . New York : Liss .
- Christensen , JP. 2000 . A relationship between deep-sea benthic oxygen demand and oceanic primary production . Oceanologica Acta , 23 : 65 – 82 .
- Christensen , PB , Glud , RN , Dalsgaard , T and Gillespie , P. 2003 . Implication of long line mussel farming on benthos, oxygen and nitrogen dynamics in coastal sediments . Aquaculture , 218 : 567 – 88 .
- Christensen , B , Vedel , A and Kristensen , E. 2000 . Carbon and nitrogen fluxes in sediment inhabited by suspension-feeding (Nereis diversicolor) and non-suspension-feeding (N. virens) polychaetes . Marine Ecology Progress Series , 192 : 203 – 217 .
- Connell , EL , Colmer , TD and Walker , DI. 1999 . Radial oxygen loss from intact roots of Halophila ovalis as a function of distance behind the root tip and shoot illumination . Aquatic Botany , 63 : 219 – 28 .
- Cook , PLM and Røy , H. 2006 . Advective relief of CO2 limitation in microphytobenthos in highly productive sandy sediments . Limnology and Oceanography , 51 : 1594 – 601 .
- Cook , PLM , Wenzhöfer , F , Glud , RN and Huettel , M. 2007a . Benthic solute exchange and carbon mineralization in two shallow subtidal sandy sediments: impact of advective porewater exchange . Limnology and Oceanography , 52 : 1943 – 63 .
- Cook , PLM , Wenzhöfer , F , Rysgaard , S , Galaktionov , OS , Meysman , FJR Eyre , BD . 2007b . Quantification of denitrification in permeable sediments: insights from a 2-dimensional simulation analysis and experimental data . Limnology and Oceanography Methods , 4 : 294 – 307 .
- Cowan , JLW , Pennock , JR and Boynton , WR. 1996 . Seasonal and interannual patterns of sediment–water nutrient and oxygen fluxes in Mobile Bay, Alabama (USA): regulating factors and ecological significance . Marine Ecology Progress Series , 141 : 229 – 45 .
- Dalsgaard , T. 2003 . Benthic primary production and nutrient cycling in sediments with benthic microalgae and transient accumulation of macroalgae . Limnology and Oceanography , 48 : 2138 – 50 .
- de Beer , D , Wenzhöfer , F , Ferdelman , TG , Boehme , SE , Huettel , M Beusekom van , JEE . 2005 . Transport and mineralization rates in North sea sandy intertidal sediments, Sylt-Rømø Basin, Waden Sea . Limnology and Oceanography , 50 : 113 – 27 .
- del Giorgio , PA and Williams , PJ le B. 2005 . Respiration in Aquatic Ecosystems , 315 Oxford : Oxford University Press .
- Dorgan , KM , Jumars , PA , Johnson , B , Boudreau , BP and Landis , E. 2005 . Burrow extension by crack propagation . Nature , 433 : 475 – 5 .
- Duineveld , GCA , de Wilde , PAWJ , Berghuis , EM , Kok , A and Kromkamp , J. 1997a . Benthic respiration and standing stock on two contrasting continental margins in the western Indian Ocean: the Yemen–Somali upwelling region and the margin off Kenya . Deep-Sea Research I , 44 : 1293 – 317 .
- Duineveld , GCA , Lavaleye , MSS , Berghuis , EM , de Wilde , PAWJ , van der Weele , J Kok , A . 1997b . Patterns of benthic fauna and benthic respiration on the Celtic continental margin in relation to the distribution of phytodetritus . Internationale Revue der Gesamten Hydrobiologie , 82 : 395 – 424 .
- Elberling , B and Damgaard , LR. 2001 . Microscale measurements of oxygen diffusion and consumption in subaqueous sulphide tailings . Geochimica et Cosmochimica Acta , 65 : 1897 – 905 .
- Emery , KO. 1969 . Relict sediments on continental shelves of the world . American Association of Petroleum Geologists Bulletin , 52 : 445 – 64 .
- Emery , KO and Rittenberg , SC. 1956 . Early diagenesis of California Basin sediments. 1. Spatial and temporal scales . Marine Biology , 127 : 289 – 95 .
- Epping , EHG and Helder , W. 1997 . Oxygen budgets calculated from in situ microprofiles for Northern Adriatic sediments . Continental Shelf Research I , 17 : 1737 – 64 .
- Epping , EHG and Jørgensen , BB. 1996 . Light-enhanced oxygen respiration in benthic phototrophic communities . Marine Ecology Progress Series , 139 : 193 – 203 .
- Epping , EHG , Khalili , A and Thar , R. 1999 . Photosynthesis and dynamics of oxygen consumption in a microbial mat as calculated from transient oxygen microprofiles . Limnology and Oceanography , 44 : 1936 – 48 .
- Epping , E , van der Zee , C , Soetaert , K and Helder , W. 2002 . On the oxidation and burial of organic carbon in sediments of the Iberian margin and Nazare Canyon (NE Atlantic) . Marine Ecology Progress Series , 52 : 399 – 431 .
- Eyre , BD and Balls , P. 1999 . A comparative study of nutrient behaviour along salinity gradient of tropical and temperate estuaries . Estuaries , 22 : 313 – 26 .
- Eyre , BD and Ferguson , AJP. 2005 . Benthic metabolism and nitrogen cycling in a subtropical east Australian estuary (Brunswick): temporal variability and controlling factors . Limnology and Oceanography , 50 : 81 – 96 .
- Eyre , B and Ferguson , AJP. 2006 . Impact of a flood event on benthic and pelagic coupling in a subtropical east Australian estuary (Brunswick) . Estuarine, Coastal and Shelf Science , 66 : 111 – 22 .
- Fenchel , T. 1986 . Protozoa filter feeding . Progress in Protistology , 1 : 65 – 113 .
- Fenchel , T. 1994 . Motility and chemosensory behaviour of the sulphur bacterium Thiovulum majus . Microbiology , 140 : 3109 – 16 .
- Fenchel , T. 1996a . Worm burrows and oxic microniches in marine sediments. 1. Spatial and temporal scales . Marine Biology , 127 : 289 – 95 .
- Fenchel , T. 1996b . Worm burrows and oxic microniches in marine sediments. 2. Distribution patterns of ciliated protozoa . Marine Biology , 127 : 297 – 301 .
- Fenchel , T and Glud , RN. 1998 . Veil architecture in a sulphide-oxidizing bacterium enhances countercurrent flux . Nature , 394 : 367 – 9 .
- Fenchel , T and Glud , RN. 2000 . Benthic primary production and O2–CO2 dynamics in a shallow water sediment: spatial and temporal activity . Ophelia , 53 : 159 – 71 .
- Fenchel , T and Jørgensen , BB. 1977 . “ Detritus food chains of aquatic systems: the role of bacteria ” . In Advances in Microbial Ecology 1 , Edited by: Alexander , M . 1 – 58 . New York : Plenum Press .
- Fenchel , T , King , GM and Blackburn , TH. 1998 . Bacterial Biogeochemistry: The Ecophysiology of Mineral Cycling , 307 San Diego, CA : Academic Press .
- Fischer , G , Ratmeyer , V and Wefer , G. 2000 . Organic carbon fluxes in the Atlantic and Southern Ocean: relationship to primary production compiled from satellite radiometer data . Deep-Sea Research I , 47 : 1961 – 97 .
- Flach , E , Lavalaye , M , de Sigter , H and Thomsen , L. 1998 . Feeding types of the benthic community along the NW European continental margin: spatial and temporal variability in activity and biomass . Progress in Oceanography , 42 : 209 – 23 .
- Forster , S , Glud , RN , Gundersen , JK and Huettel , M. 1999 . In situ study of bromide tracer and oxygen flux in coastal sediments . Estuarine, Coastal and Shelf Science , 49 : 813 – 27 .
- Forster , S and Graf , G. 1995 . Impact of irrigation on oxygen flux into the sediment: intermittent pumping by Callianassa subterranean and ‘piston-pumping’ by Lanice conchilega . Marine Biology , 123 : 335 – 46 .
- Fossing H , Berg P , Thamdrup B , Rysgaard S , Sørensen HM , Nielsen K. . 2002 . Ilt- og nærringsstofflux model for Århus Bugt og Mariager Fjord. Aarhus (Denmark): Danmarks Miljøundersøgelser . Faglig Rapport fra DMU No. 416 .
- Fossing , H , Gallardo , VA , Jørgensen , BB , Hüttel , M , Nielsen , L Schulz , H . 1995 . Concentration and transport of nitrate by the mat-forming sulphur bacterium Thioploca . Nature , 374 : 713 – 5 .
- Franke , U. 2005 . Application of planar optodes in biological aquatic systems [PhD thesis] , [Bremen (Germany)] : University of Bremen, Fachbereich Biologie/Chemie .
- Franke , U , Polerecky , L , Precht , E and Huettel , M. 2006 . Wave tank study of particulate organic matter degradation in permeable sediments . Limnology and Oceanography , 51 : 1084 – 96 .
- Frederiksen , M and Glud , RN. 2006 . Oxygen dynamics in the rhizosphere of Zostera marina: a two-dimensional planar optode study . Limnology and Oceanography , 51 : 1072 – 83 .
- Froelich , PN , Klinkenhammer , GP , Bender , ML , Luedtke , NA , Heath , GR Cullen , D . 1979 . Early oxidation of organic matter in pelagic sediments of the eastern equatorial Atlantic: suboxic diagenesis . Geochimica et Cosmochimica Acta , 43 : 1075 – 90 .
- Garcia-Pichel , F. 1989 . Rapid bacterial swimming measured in swarming cells of Thiovulum majus . Journal of Bacteriology , 171 : 3560 – 3 .
- Garcia-Pichel , F , Kühl , M , Nübel , U and Muyzer , G. 1999 . Salinity-dependent limitation of photosynthesis and oxygen exchange in microbial mats . Journal of Phycology , 35 : 227 – 38 .
- Gattuso , JP , Gentilli , B , Duarte , C , Kleypass , J , Middelburg , JF and Antoine , D. 2006 . Light availability in the coastal ocean: impact on the distribution of benthic photosynthetic organism and contribution to primary production . Biogeoscience , 3 : 489 – 513 .
- Gerlach , SA , Hahn , A and Schrage , M. 1985 . Size spectra of benthic biomass and metabolism . Marine Ecology Progress Series , 26 : 161 – 73 .
- Gilbert , F , Hulth , S , Strömberg , N , Ringdahl , K and Poggiale , J-C. 2003 . 2D optical quantification of particle reworking activities in marine surface sediments . Journal of Experimental Marine Biology and Ecology , 285 : 251 – 63 .
- Glud , RN. 2006 . “ Microscale techniques to measure photosynthesis: a mini-review ” . In Functioning of Microphytobenthos. Amsterdam: Royal Netherlands Academy of Arts and Sciences Edited by: Kromkamp , JC , de Brouwer , JFC , Blanchard , GF , Forster , RM and Creach , V . 31 – 42 .
- Glud , RN , Berg , P , Fossing , H and Jørgesen , BB. 2007 . Effect of the diffusive boundary layer (DBL) on the benthic mineralization and O2 distribution: a theoretical modelling exercise . Limnology and Oceanography , 52 : 547 – 57 .
- Glud , RN and Blackburn , N. 2002 . The effect of chamber size on benthic oxygen uptake measurements: a simulation study . Ophelia , 56 : 23 – 31 .
- Glud , RN , Eyre , B and Patten , N. 2008 . Biogeochemical responses to coral mass spawning at the Great Barrier Reef: effects on respiration and primary production . Limnology and Oceanography , 53 : 1014 – 24 .
- Glud , RN and Fenchel , T. 1999 . The importance of ciliates for interstitial solute transport in benthic communities . Marine Ecology Progress Series , 186 : 87 – 93 .
- Glud , RN , Forster , S and Huettel , M. 1996a . Influence of radial pressure gradients on solute exchange in stirred benthic chambers . Marine Ecology Progress Series , 141 : 303 – 11 .
- Glud , RN and Gundersen , JK. 2002 . “ Exchange and microdistribution of solutes at the benthic interface: an in situ study in Aarhus Bight, Denmark ” . In Environmental Electrochemistry: Analyses of Trace Element Biogeochemistry , Edited by: Taillefert , M . 144 – 61 . Washington, DC : American Chemical Society .
- Glud , RN , Gundersen , JK and Holby , O. 1999a . Benthic in situ respiration in the upwelling area off central Chile . Marine Ecology Progress Series , 180 : 7 – 21 .
- Glud , RN , Gundersen , JK , Jørgensen , BB , Revsbech , NP and Schulz , HD. 1994a . Diffusive and total oxygen uptake of deep-sea sediments in the eastern South Atlantic Ocean: in situ and laboratory measurements . Deep-Sea Research I , 41 : 1767 – 88 .
- Glud RN , Gundersen JK , Ramsing NB . 2000a . Electrochemical and optical oxygen microsensors for in situ measurements . In: Buffle J , Horvai G In Situ Monitoring of Aquatic Systems: Chemical Analysis and Speciation . Chichester, , UK : John Wiley & Sons . p 19 – 74 . ( IUPAC Series on Analytical and Physical Chemistry of Environmental Systems; 6 ).
- Glud , RN , Gundersen , JK , Revsbech , NP and Jørgensen , BB. 1994b . Effects on the benthic diffusive boundary layer imposed by microelectrodes . Limnology and Oceanography , 39 : 462 – 7 .
- Glud , RN , Gundersen , JK , Revsbech , NP , Jørgensen , BB and Huttel , M. 1995a . Calibration and performance of the stirred flux chamber from the benthic lander Elinor . Deep-Sea Research I , 42 : 1029 – 42 .
- Glud , RN , Gundersen , JK , Røy , H and Jørgensen , BB. 2003 . Seasonal dynamics of benthic O2 uptake in a semi-enclosed bay: importance of diffusion and fauna activity . Limnology and Oceanography , 48 : 1265 – 76 .
- Glud , RN , Holby , O , Hofmann , F and Canfield , DE. 1998a . Benthic mineralization in Arctic sediments (Svalbard) . Marine Ecology Progress Series , 173 : 237 – 51 .
- Glud , RN , Jensen , K and Revsbech , NP. 1995b . Diffusivity in surficial sediments and benthic mats determined by use of a combined N2O–O2 microsensor . Geochimica et Cosmochimica Acta , 59 : 231 – 7 .
- Glud , RN , Klimant , I , Holst , G , Kohls , O , Meyer , V Kühl , M . 1999b . Adaptation, test and in situ measurements with O2 microoptodes on benthic landers . Deep-Sea Research I , 26 : 171 – 83 .
- Glud , RN , Kühl , M , Khols , O and Ramsing , NB. 1999c . Heterogenity of oxygen production and consumption in a photosynthetic microbial mat as studied by planar optodes . Journal of Phycology , 35 : 270 – 9 .
- Glud , RN , Kühl , M , Wenzhöfer , F and Rysgaard , S. 2002 . Benthic diatoms of a high Arctic fjord (Young Sound, NE Greenland): importance for ecosystem primary production . Marine Ecology Progress Series , 238 : 15 – 29 .
- Glud , RN , Ramsing , NB , Gundersen , JK and Klimant , I. 1996b . Planar optodes, a new tool for fine scale measurements of two-dimensional O2 distribution in benthic communities . Marine Ecology Progress Series , 140 : 217 – 26 .
- Glud , RN , Ramsing , NB and Revsbech , NP. 1992 . Photosynthesis and photosynthesis-coupled respiration in natural biofilms quantified with microsensors . Journal of Phycology , 28 : 51 – 60 .
- Glud , RN , Riisgaard-Petersen , N , Thamdrup , B , Fossing , H and Rysgaard , S. 2000b . Benthic carbon mineralization in a high-Arctic sound (Young Sound, NE Greenland) . Marine Ecology Progress Series , 206 : 59 – 71 .
- Glud , RN , Rysgaard , S , Fenchel , T and Nielsen , PH. 2004 . A conspiuous H2S oxidizing microbial mat from a high-latitude Arctic fjord (Young Sound, NE Greenland) . Marine Biology , 145 : 51 – 60 .
- Glud , RN , Santegoeds , CM , de Beer , D , Kohls , O and Ramsing , NB. 1998b . Oxygen dynamics at the base of a biofilm studied with planar optodes . Aquatic Microbial Ecology , 14 : 223 – 33 .
- Glud , RN , Tengberg , A , Kühl , M , Hall , POJ , Klimant , I and Holst , G. 2001 . An in situ instrument for planar O2 optode measurements at benthic interfaces . Limnology and Oceanography , 46 : 2073 – 80 .
- Glud , RN , Wenzhöfer , F , Tengberg , A , Middelboe , M , Oguri , K and Kitasato , H. 2005 . Distribution of oxygen in surface sediments from central Sagami Bay, Japan: in situ measurements by microelectrodes and planar optodes . Deep-Sea Research I , 52 : 1974 – 87 .
- Graf , G. 1989 . Benthic–pelagic coupling in a deep-sea community . Nature , 341 : 437 – 9 .
- Green , MA , Aller , RC and Aller , JY. 1993 . Carbonate dissolution and temporal abundances of foraminifera in Long Island Sound sediments . Limnology and Oceanography , 38 : 331 – 45 .
- Grunwald , B and Kühl , M. 2004 . A system for imaging variable chlorophyll fluorescence of aquatic phototrophs . Ophelia , 58 : 79 – 89 .
- Gundersen JK , Glud RN , Jørgensen BB . 1995 . Havbundens iltomsætning. Copenhagen: Environmental Protection Agency . Havforskning fra Miljøstyrelsen, Hav-90 Faglig Rapport No. 57 .
- Gundersen , JK and Jørgensen , BB. 1990 . Microstructure of diffusive boundary layers and the oxygen uptake of the sea floor . Nature , 345 : 604 – 7 .
- Gundersen , JK , Jørgensen , BB , Larsen , E and Jannasch , HW. 1992 . Mats of giant sulphur bacteria on deep-sea sediments due to fluctuating hydrothermal flow . Nature , 360 : 454 – 5 .
- Hales , B and Emerson , S. 1997 . Calcite dissolution in sediments of the Ceara rise: in situ measurements of porewater O2, pH, and CO2(aq) . Geochimica et Cosmochimica Acta , 61 : 501 – 14 .
- Hales , B , Emerson , S and Archer , D. 1994 . Respiration and dissolution in the sediments of the western North Atlantic: estimates from models of in situ microelectrode measurements of porewater oxygen and pH . Deep-Sea Research I , 41 : 695 – 719 .
- Hall , POJ , Anderson , LG , Rutgers van der Loeff , MM , Sundby , B and Westerlund , SFG. 1989 . Oxygen uptake kinetics in the benthic boundary layer . Limnology and Oceanography , 34 : 734 – 46 .
- Hall , POJ , Brunnegård , J , Hulthe , G , Martin , WR , Stahl , H and Tengberg , A. 2007 . Dissolved organic matter in abyssal sediments; core recovery artifacts . Limnology and Oceanography , 52 : 19 – 31 .
- Hammond , DE , Cummins , KM , McManus , J , Berelson , WM , Smith , G and Spagnoli , F. 2004 . Methods for measuring benthic nutrient flux on the California margin: comparing shipboard core incubations to in situ lander results . Limnology and Oceanography Methods , 2 : 146 – 59 .
- Hammond , DE , McManus , J , Berelson , WM , Kilgore , TE and Pope , RH. 1996 . Early diagenesis of organic material in equatorial Pacific sediments: stoichiometry and kinetics . Deep-Sea Research I , 43 : 1365 – 412 .
- Hancke , K and Glud , RN. 2004 . Temperature effects on respiration and photosynthesis in three diatom dominated benthic communities . Aquatic Microbial Ecology , 37 : 265 – 81 .
- Hansen , K and Kristensen , E. 1997 . Impact of macrofaunal recolonization on benthic metabolism and nutrient fluxes in a shallow marine sediment previously overgrown with macroalgal mats . Estuarine, Coastal and Shelf Science , 45 : 613 – 28 .
- Hansen , LS and Blackburn , TH. 1992 . Effect of algal bloom deposition on sediment respiration and fluxes . Marine Biology , 112 : 147 – 52 .
- Hartig , P , Wolfstein , K , Lippemeier , S and Colijn , F. 1998 . Photosynthetic activity of natural microphytobenthos populations measured by fluorescence (PAM) and 14C-tracer methods: a comparison . Marine Ecology Progress Series , 166 : 53 – 62 .
- Hecker , B. 1990 . Photographic evidence for the rapid flux of particles to the sea floor and their transport down the continental slope . Deep-Sea Research I , 37 : 1773 – 82 .
- Heil , CA , Chaston , K , Jones , A , Bird , P , Longstaff , B Costanzo , S . 2004 . Benthic microalgae in coral reef sediments of the southern Great Barrier Reef, Australia . Coral Reefs , 23 : 336 – 43 .
- Heip , CHR , Duineveld , GA , Flach , E , Graf , G , Helder , W Herman , PMJ . 2001 . The role of the benthic biota in sedimentary metabolism and sediment–water exchange processes in the Goban Spur area (NE Atlantic) . Deep-Sea Research I , 48 : 3223 – 43 .
- Hinga , KR , Sieburth , JM and Heath , GR. 1979 . Supply and use of organic material at the deep-sea floor . Journal of Marine Research I , 37 : 581 – 600 .
- Høines , ÅS and Bergstad , OA. 2001 . Density of wintering sand eel in the sand recorded by grab catchers . Fisheries Research I , 49 : 295 – 301 .
- Holst , G , Glud , RN , Kühl , M and Klimant , I. 1997 . A microoptode array for fine scale measurements of oxygen distribution . Sensors and Actuators B , 38/39 : 122 – 9 .
- Holst , G and Grünwald , B. 2001 . Luminescence lifetime imaging with transparent oxygen optodes . Sensors and Actuators B , 75 : 78 – 90 .
- Holst , G , Kohls , O , Klimant , I , König , B , Kühl , M and Richter , T. 1998 . A modular luminescence lifetime imaging system for mapping oxygen distribution in biological samples . Sensors and Actuators B , 51 : 163 – 70 .
- Hondzo , M , Feyaerts , T , Donovan , R and O'Conner , BL. 2005 . Universal scaling of dissolved oxygen distribution at the sediment–water interface: a power law . Limnology and Oceanography , 50 : 1667 – 76 .
- Huettel , M and Webster , IT. 2001 . “ Porewater flow in permeable sediments ” . In The Benthic Boundary Layer , Edited by: Boudreau , B and Jørgensen , BB . 144 – 79 . New York : Oxford University Press .
- Huettel , M , Ziebis , W and Forster , S. 1996 . Flow-induced uptake of particulate matter in permeable sediments . Limnology and Oceanography , 41 : 309 – 22 .
- Hulth , S , Aller , RC , Engström , P and Selander , E. 2002 . A pH plate fluorosensor optode for early diagenetic studies of marine sediments . Limnology and Oceanography , 47 : 212 – 20 .
- Hulth , S , Blackburn , TH and Hall , POJ. 1994 . Arctic sediments (Svalbard): consumption and microdistribution of oxygen . Marine Chemistry , 46 : 293 – 316 .
- Hulth , S , Tengberg , A , Landén , A and Hall , POJ. 1997 . Mineralization and burial of organic carbon in sediments of the Southern Weddell Sea . Deep-Sea Research I , 44 : 955 – 81 .
- Hulthe , G , Hulth , S and Hall , POJ. 1998 . Effect of oxygen on degradation rate of refractory and labile organic matter in continental margin sediments . Geochimica et Cosmochimica Acta , 62 : 1319 – 28 .
- Hüttel , M and Gust , G. 1992a . Solute release mechanisms from confined cores in stirred benthic chambers and flume flows . Marine Ecology Progress Series , 82 : 187 – 97 .
- Hüttel , M and Gust , G. 1992b . Impact of bioroughness on the interfacial solute exchange in permeable sediments . Marine Ecology Progress Series , 89 : 253 – 67 .
- Iversen , N and Jørgensen , BB. 1993 . Diffusion coefficients of sulphate and methane in marine sediments: influence of porosity . Geochimica et Cosmochimica Acta , 57 : 571 – 8 .
- Jahnke , RA. 1985 . A model of microenvironments in deep-sea sediments: formation and effects on porewater profiles . Limnology and Oceanography , 30 : 956 – 65 .
- Jahnke , RA. 1990 . Early diagenesis and recycling of biogenetic debris at the seafloor, Santa Monica Basin, California . Journal of Marine Research I , 48 : 413 – 36 .
- Jahnke , RA. 1996 . The global ocean flux of particulate organic carbon: areal distribution and magnitude . Global Biogeochemical Cycles , 10 : 71 – 88 .
- Jahnke , RA. 2001 . “ Constraining organic matter cycling with benthic fluxes ” . In The Benthic Boundary Layer , Edited by: Boudreau , B and Jørgensen , BB . 302 – 11 . New York : Oxford University Press .
- Jahnke , RA and Christensen , MB. 1989 . A free vehicle benthic chamber instrument for sea-floor studies . Deep-Sea Research I , 36 : 625 – 37 .
- Jahnke , RA , Craven , DB and Gaillard , JF. 1994 . The influence of organic matter diagenesis on CaCO3 dissolution at the deep-sea floor . Geochimica et Cosmochimica Acta , 58 : 2799 – 809 .
- Jahnke , RA , Nelson , JR , Marinelli , RL and Eckman , JE. 2000 . Benthic flux of biogenic elements on the southeastern US continental shelf: influence of pore water advective transport and benthic microalgae . Continental Shelf Research I , 20 : 109 – 27 .
- Jahnke , RA , Reimers , C and Craven , DB. 1990 . Intensification of recyling of organic matter at the sea floor near ocean margins . Nature , 348 : 50 – 54 .
- Janssen , F , Faerber , P , Huettel , M , Meyer , V and Witte , U. 2005 . Pore-water advection and solute fluxes in permeable marine sediments (I): calibration and performance of a novel benthic chamber system Sandy . Limnology and Oceanography , 50 : 768 – 78 .
- Jensen , SI , Kühl , M , Glud , RN , Jørgensen , LB and Primé , A. 2005 . Oxygen microzones and radial oxygen loss from roots of Zostera marina . Marine Ecology Progress Series , 293 : 49 – 58 .
- Jørgensen , BB. 1977 . Bacterial sulfate reduction within reduced microniches of oxidized marine sediments . Marine Biology , 41 : 7 – 17 .
- Jørgensen , BB. 1982 . Ecology of the bacteria of the sulphur cycle with special reference to anoxic–oxic interface environments . Philosophical Transactions of the Royal Society of London B , 298 : 543 – 61 .
- Jørgensen BB . 1996a . Material flux in the sediment . In: Jørgensen BB , Richardson K Eutrophication in Coastal Marine Ecosystems . Washington, DC : American Geophysical Union . p 115 – 36 . ( Coastal and Estuarine Studies; 52 ).
- Jørgensen BB . 1996b . Case study – Aarhus Bay . In: Jørgensen BB , Richardson K Eutrophication in Coastal Marine Ecosystems . Washington, DC : American Geophysical Union . p 137 – 54 . ( Coastal and Estuarine Studies; 52 ).
- Jørgensen , BB. 2000 . “ Bacteria and marine biogeochemistry ” . In Marine Geochemistry , Edited by: Schulz , HD and Zabel , M . 169 – 201 . Berlin : Spinger .
- Jørgensen , BB. 2001 . “ Life in the diffusive boundary layer ” . In The Benthic Boundary Layer , Edited by: Boudreau , B and Jørgensen , BB . 348 – 73 . New York : Oxford University Press .
- Jørgensen , BB and Boudreau , B. 2001 . “ Diagenesis and sediment water exchange ” . In The Benthic Boundary Layer , Edited by: Boudreau , B and Jørgensen , BB . 211 – 38 . New York : Oxford University Press .
- Jørgensen , BB and Des Marais , D. 1990 . The diffusive boundary layer of sediments: oxygen microgradients over a microbial mat . Limnology and Oceanography , 35 : 1343 – 55 .
- Jørgensen , BB , Glud , RN and Holby , O. 2005 . Oxygen distribution and bioirrigation in Arctic fjord sediments (Svalbard, Barents Sea) . Marine Ecology Progress Series , 292 : 85 – 95 .
- Jørgensen , BB and Revsbech , NP. 1983 . Colorless sulphur bacteria, Beggiatoa spp. and Thiovulum spp. in O2 and H2S microgradients . Applied and Environmental Microbiology , 45 : 1261 – 70 .
- Jørgensen , BB and Revsbech , NP. 1985 . Diffusive boundary layers and the oxygen uptake of sediment and detritus . Limnology and Oceanography , 30 : 111 – 22 .
- Jørgensen , BB , Revsbech , NP and Cohen , Y. 1983 . Photosynthesis and structure of benthic microbial mats: microelectrode and SEM studies of four cyanobacterial communities . Limnology and Oceanography , 28 : 1075 – 93 .
- Katsev , S , Sundby , B and Mucci , A. 2006 . Modelling vertical migration of the redox boundary in sediments: application to deep basins of the Arctic Ocean . Limnology and Oceanography , 51 : 1581 – 93 .
- Khalili , A , Basu , AJ and Huettel , M. 1997 . A non-Darcy model for recirculating flow through a fluid–sediment interface in a cylindrical container . Acta Mechanica , 123 : 75 – 87 .
- Klimant , I , Holst , G and Kühl , M. 1997a . A simple fiberoptic sensor to detect the penetration of microsensors into sediments and other biogeochemical systems . Limnology and Oceanography , 42 : 1638 – 43 .
- Klimant , I , Kühl , M , Glud , RN and Holst , G. 1997b . Optical measurements of oxygen and other environmental parameters in microscale: strategies and biological applications . Sensors and Actuators B , 38/39 : 29 – 37 .
- Klimant , I , Meyer , V and Kühl , M. 1995 . Fiber-optic oxygen microsensors, a new tool in aquatic biology . Limnology and Oceanography , 40 : 1159 – 65 .
- Klinkenberg , LJ. 1951 . Analogy between diffusion and electrical conductivity in porous rocks . Geological Society of America Bulletin , 62 : 559 – 64 .
- König , B , Kohls , O , Glud , RN and Kühl , M. 2005 . Fabrication and test of sol-gel based planar optodes for use in aquatic systems . Marine Chemistry , 97 : 262 – 76 .
- Kostka , JE , Thamdrup , B , Glud , RN and Canfield , DE. 1999 . Rates and parthways of carbon oxidation in permanently cold Arctic sediments . Marine Ecology Progress Series , 180 : 7 – 21 .
- Krause-Jensen , D , Kuhl , M , Christensen , PB and Borum , J. 2007 . “ Benthic primary production in Young Sound, Northeast Greenland ” . In Carbon Cycling in Arctic Marine Ecosystems: Case Study – Young Sound. Meddelelser om Grønland, Bioscience 58 Edited by: Rysgaard , S and Glud , RN . 159 – 73 .
- Kristensen , E. 1988 . “ Benthic fauna and biogeochemical processes in marine sediments: microbial activities and fluxes ” . In Nitrogen Cycling in Coastal Marine Environments , Edited by: Blackburn , TH and Sørensen , J . 275 – 99 . New York : John Wiley .
- Kristensen , E. 2000 . Organic matter diagenesis at the oxic/anoxic interface in coastal marine sediments, with emphasis on the role of burrowing animals . Hydrobiology , 426 : 1 – 24 .
- Kristensen , E and Holmer , M. 2001 . Decomposition of plant materials in marine sediments exposed to different electron acceptors O2, NO3 −, SO4 2 − , with emphasis on substrate origin, degradation kinetics, and the role of bioturbation . Geochimica et Cosmochimica Acta , 65 : 419 – 33 .
- Kühl , M , Glud , RN , Borum , J , Roberts , R and Rysgaard , S. 2001 . Photosynthetic performance of surface associated algae below sea ice as measured with a pulse-amplitude-modulated (PAM) fluorometer and O2 microsensors . Marine Ecology Progress Series , 223 : 1 – 14 .
- Kühl , M , Glud , RN , Plough , H , Ramsing , NB and Revsbech , NP. 1996 . Microenvironmental control of photosnthesis and photosynthesis-coupled respiration in an epilithic cyanobacterial biofilm . Journal of Phycology , 32 : 799 – 812 .
- Kühl , M and Jørgensen , BB. 1992 . Spectral light measurements in microbenthic phototrophic communities with a fiber-optic microprobe coupled to a sensitive diode array detector . Limnology and Oceanography , 37 : 1813 – 23 .
- Kuwae , T , Kamio , K , Inoue , T , Miyoshi , E and Uchiyama , Y. 2006 . Oxygen exchange flux between sediment and water in an intertidal sandflat, measured in situ by the eddy-correlation method . Marine Ecology Progress Series , 307 : 59 – 68 .
- Lansard , B , Rabouille , C and Massias , D. 2003 . Variability in benthic fluxes during the winter–spring transition in coastal sediments: an estimation by in situ microelectrodes and laboratory mini-electrodes . Oceanographica Acta , 26 : 269 – 79 .
- Larkum , ADW , Koch , E-M and Kühl , M. 2003 . Diffusive boundary layers and photosynthesis of epilithic algal community of coral reefs . Marine Biology , 142 : 1073 – 82 .
- Larkum , AWD , Orth , EJ and Duarte , CM. 2006 . Seagrass, Biology, Ecology and Conservation , 691 Dordrecht, , Netherlands : Springer .
- Lassen , C , Glud , RN , Ramsing , NB and Revsbech , NP. 1998 . A method to improve the spatial resolution of photosynthetic rates obtained by oxygen microsensors . Journal of Phycology , 34 : 89 – 93 .
- Libelo , EL , MacIntyre , WG , Seitz , RD and Libelo , LF. 1994 . Cycling of water through the sediment–water interface by passive ventilation of relict biological structures . Marine Geology , 120 : 1 – 12 .
- Lohse , L , Helder , W , Epping , EHG and Balzer , W. 1998 . Recycling of organic matter along a shelf-slope transect across the NW European Continental Margin (Goban Spur) . Progress in Oceanography , 42 : 77 – 110 .
- Lomstein BAa Blackburn TH 1992 . Nitrogen cycling in the seafloor of Aarhus Bay . Copenhagen : Environmental Protection Agency . 74 p. Havforskning fra Miljøstyrelsen, Rapport No. 16 .
- Lorke , A , Müller , B , Maerki , M and Wüest , A. 2003 . Breathing sediments: the control of diffusive transport across the sediment–water interface by periodic boundary-layer turbulence . Limnology and Oceanography , 48 : 2077 – 85 .
- Mahaut , M-L , Sibuet , M and Shirayama , Y. 1995 . Weight-dependent respiration rates in deep-sea organisms . Deep-Sea Research I , 42 : 1575 – 82 .
- Meile , C and van Cappellen , P. 2003 . Global estimates of enhanced solute transport in marine sediments . Limnology and Oceanography , 48 : 777 – 86 .
- Meile , C and van Cappellen , P. 2005 . Particle age distribution and O2 exposure times: timescales in bioturbated sediments . Global Biogeochemical Cycles , 19 : GB3013
- Meysman , FJR , Galaktinov , O and Middelburg , JJ. 2005 . Irrigation patterns in permeable sediments induced by burrow ventilation: a case study of Arinicola marina . Marine Ecology Progress Series , 303 : 195 – 212 .
- Middelburg , JJ , Barranguet , C , Bushker , HTS , Herman , PMJ and Moens , T. 2000 . The fate of intertidal microphytobenthos carbon: an in situ 13C labelling study . Limnology and Oceanography , 45 : 1224 – 34 .
- Middelburg , JJ , Duarte , CM and Gattuso , J-P. 2005 . “ Respiration in coastal benthic communities ” . In Respiration in Aquatic Ecosystems , Edited by: del Giorgio , PA , Williams , PJ and le , B . 206 – 25 . Oxford : Oxford University Press .
- Miller-Way , T , Boland , GS and Twilley , RR. 1994 . Sediment oxygen consumption and benthic nutrient fluxes on the Louisiana continental shelf: a methodological comparison . Estuaries , 17 : 809 – 15 .
- Mincks , SL , Smith , CR and DeMaster , DJ. 2005 . Persistence of labile organic matter and microbial biomass in Antarctic shelf sediments: evidence of a sediment ‘food bank’ . Marine Ecology Progress Series , 300 : 3 – 19 .
- Møller , MM , Nielsen , LP and Jørgensen , BB. 1985 . Oxygen responses and mat formation by Beggiatoa spp . Applied and Environmental Microbiology , 50 : 373 – 82 .
- Moodley , L , Heip , CHR and Middelburg , JJ. 1998 . Benthic activity in sediments of the northwestern Adriatic Sea: sediment oxygen consumption, macrofauna and meiofauna dynamics . Journal of Sea Research I , 40 : 263 – 80 .
- Moodley , L , Middelburg , JJ , Soetaert , K , Boschker , HTS , Herman , PMJ and Heip , CHR. 2005 . Similar rapid response to phytodetritus deposistion in shallow and deep-sea sediments . Journal of Marine Research I , 63 : 457 – 69 .
- Munksby , N , Benthien , M and Glud , RN. 2002 . Flow-induced flushing of relict tube structures in the central Skagerak (Norway) . Marine Biology , 141 : 939 – 45 .
- Nair , RR , Ittekot , V , Manganini , SJ , Ramaswamy , V , Haake , B Degens , ET . 1989 . Increased particle flux to the deep ocean related to monsoons . Nature , 338 : 749 – 51 .
- Nelson , DC. 1992 . “ The genus Beggiatoa ” . In The Prokaryotes , 2nd ed , Edited by: Balows , A , Truperü , HG , Dworkin , M , Harder , W and Schleifer , KH . Vol. 6 , New York : Springer .
- Nielsen , LP , Christensen , PB , Revsbech , NP and Sørensen , J. 1990 . Denitrification and oxygen respiration in biofilms studied with a microsensor for nitrous oxide and oxygen . Microbial Ecology , 19 : 63 – 72 .
- Nielsen , LP and Glud , RN. 1996 . Denitrification in coastal sediment measured in situ by nitrogen isotope pairing technique applied to a benthic flux chamber . Marine Ecology Progress Series , 137 : 181 – 6 .
- Nishihara , GN and Ackerman , JD . 2007 . On the determination of mass transfer in concentration boundary layers . Limnology and Oceanography Methods , 5 : 88 – 96 .
- Oguri , K , Kitazato , H and Glud , RN. 2006 . Platinum octaetylporphyrin based planar optodes combined with UV-LED excitation light source: an ideal tool for high resolution O2 imaging in O2 depleted environments . Marine Chemistry , 100 : 95 – 107 .
- Olesen , M and Lundsgaard , C. 1995 . Sedimentation of autochthonous material from the euphotic zone of a coastal system . Estuarine, Coastal and Shelf Science , 41 : 475 – 90 .
- Pamatmat , MM. 1971 . Oxygen consumption by the seabed IV. Shipboad and laboratory experiments . Limnology and Oceanography , 16 : 536 – 50 .
- Pamatmat , MM and Banse , K. 1969 . Oxygen consumption by the seabed. II. In situ measurements to a depth of 180 m . Limnology and Oceanography , 14 : 250 – 9 .
- Pamatmat , MM and Fenton , D. 1968 . An instrument for measuring subtidal benthic metabolism in situ . Limnology and Oceanography , 13 : 537 – 40 .
- Parker , WR , Doyle , K , Parker , ER , Kershaw , PJ , Malcom , SJ and Lomas , P. 2002 . Benthic interface studies with landers. Consideration of lander/interface interactions and their design . Progress in Oceanography , 285 : 190 – 7 .
- Peterson , WT , Arcos , DF , McManus , GB , Dam , H , Bellantoni , D Johnson , T . 1988 . The nearshore zone during coastal upwelling: daily variability between primary and secondary production off central Chile . Progress in Oceanography , 20 : 1 – 40 .
- Pfannkuche , O. 1993 . Benthic response to sedimentation of particulate organic matter at the BIOTRANS station, 47°N, 20°W . Deep-Sea Research I , 40 : 135 – 149 .
- Pfannkuche , O. 2005 . “ Allothonous deep-sea benthic communities: functioning and forcing ” . In Interactions Between Macro- and Microorganisms in Marine Sediments , Edited by: Kristensen , E , Haese , RR and Kostka , JE . Washington, DC : American Geophysical Union. (Coastal and Estuarine Studies; 60) .
- Pfannkuche O , Boetius A , Lochte K . Lundgreen, Thiel H . 1999 . Responses of deep-sea benthos to sedimentation patterns in the North-east Atlantic in 1992 . Deep-Sea Research I 46 : 573 – 96 .
- Pfannkuche , O and Linke , P. 2003 . GEOMAR landers as long-term deep-sea observatories . Sea Technology , 44 : 50
- Pfannkuche , O and Soltwedel , T. 1998 . Small benthic size classes along the European continental margin: spatial and temporal variability in activity and biomass . Progress in Oceanography , 42 : 189 – 207 .
- Piepenburg , D , Blackburn , TH , von Dorrien , CF , Gutt , J , Hall , POJ Hulth , S . 1995 . Partitioning of benthic community respiration in the Arctic (northwest Barents Sea) . Marine Ecology Progress Series , 118 : 199 – 213 .
- Ploug , H and Grossart , HP. 1999 . Bacterial production and respiration in suspended aggregates – a matter of incubation method . Aquatic Microbial Ecology , 20 : 21 – 9 .
- Ploug , H , Kühl , M , Buchholz-Cleven , B and Jørgensen , BB. 1997 . Anoxic aggregates an ephemeral phenomenon in the pelagic environment . Aquatic Microbial Ecology , 13 : 285 – 94 .
- Polerecky , L , Franke , U , Werner , U , Grunwald , B and de Beer , D. 2005 . High spatial resolution measurements of oxygen consumption rates in permeable sediments . Limnology and Oceanography Methods , 3 : 75 – 85 .
- Polerecky , L , Volkenborn , N and Stief , P. 2006 . High temporal resolution oxygen imaging in bioirrigated sediments . Environmental Science & Technology , 40 : 5763 – 9 .
- Pomeroy , LR , Wiebe , WJ , Deibel , D , Thompson , RJ , Rowe , GT and Pakulsik , JD. 1991 . Bacterial response to temperature and substrate concentration during the Newfoundland spring bloom . Marine Ecology Progress Series , 75 : 143 – 59 .
- Precht , E , Franke , U , Polerecky , L and Huettel , M. 2004 . Oxygen dynamics in permeable sediments with a wave-driven pore water exchange . Limnology and Oceanography , 49 : 693 – 705 .
- Queric , NV , Soltwedel , T and Arntz , WE. 2004 . Application of a rapid direct viable count method to deep-sea sediment bacteria . Journal of Microbial Methodology , 57 : 351 – 67 .
- Rabouille , C , Denis , L , Dedieu , K , Stora , G , Lansard , B and Grenz , C. 2003 . Oxygen demand in coastal marine sediments: comparing in situ microelectrodes and laboratory core incubations . Journal of Experimental Marine Biology and Ecology , 285 : 49 – 69 .
- Rao , DVS and Platt , T. 1984 . Primary production of Arctic waters . Polar Biology , 3 : 191 – 201 .
- Rasmussen , H and Jørgensen , BB. 1992 . Microelectrode studies of seasonal oxygen uptake in a coastal sediment: role of molecular diffusion . Marine Ecology Progress Series , 81 : 289 – 303 .
- Ray , AJ and Aller , RC. 1985 . Physical irrigation of relict burrows: implications for sediment chemistry . Marine Geology , 62 : 371 – 9 .
- Reimers , CE. 1987 . An in situ microprofiling instrument for measuring interfacial pore water. Gradients: methods and oxygen profiles from the North Pacific Ocean . Deep-Sea Research I , 34 : 2019 – 35 .
- Reimers , CE , Fischer , KM , Merewether , R , Smith , KL and Jahnke , RA. 1986 . Oxygen microprofiles measured in situ in deep ocean sediments . Nature , 320 : 741 – 4 .
- Reimers , CE and Glud , RN. 2000 . “ In situ chemical sensor measurements at the sediment–water interface ” . In Chemical Sensors in Oceanography , Edited by: Varney , M . 249 – 82 . Amsterdam : Gordon and Breach Science Publishers .
- Reimers , CE , Jahnke , RA and McCorkle , DC. 1992 . Carbon fluxes and burial rates over the continental slope and rise off central California with implications for the global carbon cycle . Global Biogeochemical Cycles , 6 : 199 – 224 .
- Reimers , CE , Jahnke , RA and Thomsen , L. 2001 . “ In situ sampling in the benthic boundary layer ” . In The Benthic Boundary Layer , Edited by: Boudreau , B and Jørgensen , BB . 245 – 63 . New York : Oxford University Press .
- Revsbech , NP. 1989a . An oxygen microelectrode with a guard cathode . Limnology and Oceanography , 34 : 474 – 8 .
- Revsbech , NP. 1989b . Diffusion characteristics of microbial communities determined by use of oxygen microsensors . Journal of Microbiological Methods , 9 : 111 – 22 .
- Revsbech , NP and Jørgensen , BB. 1983 . Photosynthesis of benthic microflora measured with high spatial resolution by the oxygen microprofile method: capabilities and limitations of the method . Limnology and Oceanography , 28 : 749 – 56 .
- Revsbech , NP and Jørgensen , BB. 1986 . “ Microelectrodes: their use in microbial ecology ” . In Advances in Microbial Ecology , Edited by: Marshall , M . Vol. 9 , 293 – 352 . New York : Plenum .
- Revsbech , NP , Jørgensen , BB and Blackburn , TH. 1980 . Oxygen in the sea bottom measured with a microelectrode . Science , 207 : 1355 – 6 .
- Revsbech , NP , Jørgensen , BB and Brix , O. 1981 . Primary production of microalgae in sediments measured by oxygen microprofile, H14CO3 − fixation and oxygen exchange methods . Limnology and Oceanography , 26 : 717 – 30 .
- Revsbech , NP , Nielsen , LP and Ramsing , NB. 1998 . A novel microsensor for determination of apparent diffusivity in sediments . Limnology and Oceanography , 43 : 986 – 92 .
- Rex , MA , Etter , RJ , Morris , JS , Crouse , J , McClain , CR , Johnson , NA , Stuart , CT , Deming , JW , Thies , R and Avera , R. 2006 . Global bathymetric patterns of standing stock and body size in the deep-sea benthos . Marine Ecology Progress Series , 317 : 1 – 8 .
- Rhoads , DC and Germano , JD. 1982 . Characterization of organism–sediment relations using sediment profile imaging: an efficient method of remote ecological monitoring of the seafloor Remots™ systems . Marine Ecology Progress Series , 35 : 253 – 94 .
- Riisgård , HU and Banta , GT. 1998 . Irrigation and deposit feeding by the lugworm Arenicola marina, characteristics and secondary effects on the environment. A review of our current knowledge . Vie et Milieu , 48 : 243 – 57 .
- Risgaard-Petersen , N , Dalsgaard , T , Rysgaard , S , Christensen , PB , Borum , J McGlathery , K . 1998 . Nitrogen balance of a temperate eelgrass Zostera marina bed . Marine Ecology Progress Series , 174 : 281 – 91 .
- Roberts , J. and McMinn , A. 2004 . Marine diffusive boundary layers at high latitude . Limnology and Oceanography , 49 : 934 – 9 .
- Roden , EE and Wetzel , RG. 1996 . Organic carbon oxidation and suppression of methane production by microbial Fe(III) oxide reduction in vegetated and unvegetated freshwater wetland sediments . Limnology and Oceanography , 41 : 1733 – 48 .
- Rosenberg , R , Hellman , B and Lundberg , A. 1996 . Benthic macrofaunal community structure in the Norwegian trench, deep Skagerak . Journal of Sea Research I , 35 : 181 – 8 .
- Rosenberg , R and Lundberg , L. 2004 . Photoperiodic activity pattern in the brittle star Amphiura filiformis . Marine Biology , 145 : 651 – 6 .
- Rowe , GT and Gardner , WD. 1979 . Sedimentation-rates in the slope water of the Northwest Atlantic Ocean measured directly with sediment traps . Journal of Marine Research I , 37 : 557 – 79 .
- Røy H Hüttel , Jørgensen BB . 2002 . The role of small-scale sediment topography for oxygen flux across the diffusive boundary layer . Limnology and Oceanography 47 : 837 – 47 .
- Røy H Huettel , Jørgensen BB . 2004 . Transmission of oxygen concentration fluctuations through the diffusive boundary layer overlying aquatic sediments . Limnology and Oceanography 49 : 686 – 92 .
- Røy H Hüttel , Jørgensen BB . 2005 . The influence of topography on the functional exchange surface of marine soft sediments, assessed from sediment topography measured in situ . Limnology and Oceanography 50 : 106 – 12 .
- Ruhl , HA and Smith , KL. 2004 . Shifts in deep-sea community structure linked to climate and food supply . Science , 305 : 513 – 5 .
- Rysggard , S , Christensen , PB and Nielsen , LP. 1995 . Seasonal variation in nitrification and denitrification in estuarine sediment colonized by benthic microalgae and bioturbating infauna . Marine Ecology Progress Series , 126 : 111 – 21 .
- Rysgaard , S , Christensen , PB , Sørensen , MV , Funch , P and Berg , P. 2000 . Marine meiofauna, carbon and nitrogen mineralization in sandy and soft sediments of Disko Bay, West Greenland . Aquatic Microbial Ecology , 21 : 59 – 71 .
- Rysgaard , S , Nielsen , TG and Hansen , B. 1999 . Seasonal variation in nutrients, pelagic primary production and grazing in a high-arctic coastal marine ecosystem, Young Sound, northeast Greenland . Marine Ecology Progress , 179 : 13 – 25 .
- Rysgaard S , Sejr MK . 2007 . Vertical flux of particulate organic matter in a high-arctic fjord: relative importance of terrestrial and marine sources . In: Rysgaard S, Glud RN, editors. Carbon Cycling in Arctic Marine Ecosystems: Case Study – Young Sound. Meddelelser om Grønland, Bioscience 58 : 109 – 19 .
- Rysgaard , S , Thamdrup , B , Riisgaard-Petersen , N , Fossing , H , Berg , P Christensen , BP . 1998 . Seasonal carbon and nutrient mineralization in a high-Arctic coastal marine sediment, Young Sound, Northeast Greenland . Marine Ecology Progress Series , 175 : 261 – 76 .
- Sachs O , Sauter EJ , Schluter M , Rutgers van der Loeff , M , Jerosch K , Holby O. . Benthic organic carbon flux and oxygen penetration reflect different plankton provinces in the Southern Ocean . Deep-Sea Research I . Forthcoming .
- Sakita , S and Kusda , T. 2000 . Modeling and simulation of microsites on vertical concentration profiles in sediments of aquatic zones . Water Science and Technology , 42 : 409 – 15 .
- Sand-Jensen , K , Prahl , C and Stokholm , H. 1982 . Oxygen release from roots of submerged aquatic macrophytes . Oikos , 38 : 349 – 54 .
- Santschi , PH , Anderson , RF , Fleisher , MQ and Bowles , W. 1991 . Measurements of diffusive sublayer thicknesses in the ocean by alabaster dissolution, and their implications for the measurements of benthic fluxes . Journal of Geophysical Research I , 96 : 10641 – 57 .
- Santschi , PH , Bower , P , Nyffeler , UP , Azevedo , A and Broecker , WS. 1983 . Estimates of the resistance to chemical transport posed by the deep sea boundary layer . Limnology and Oceanography , 28 : 899 – 912 .
- Sauter , EJ , Schlüter , M and Suess , E. 2001 . Organic carbon flux and remineralization in surface sediments from the northern North Atlantic derived from pore-water oxygen microprofiles . Deep-Sea Research I , 48 : 529 – 53 .
- Sayles , FL , Martin , WR and Deuser , WG. 1994 . Response of benthic oxygen demand to particulate organic carbon supply in the deep sea near Bermuda . Nature , 371 : 686 – 9 .
- Schink , DR and Guinasso , NL. 1977 . “ Modelling the influence of bioturbation and other processes on calcium carbonate dissolution at the sea floor ” . In The Fate of Fossil Fuel CO2 in the Oceans , Edited by: Andersen , NR and Malahoff , A . 375 – 99 . New York : Plenum .
- Schreiber U , Bilger W , Neubauer C . 1994 . Chlorophyll fluorescence as a non-intrusive indicator for rapid assessment of in vivo photosynthesis . In: Schulze HD , Caldwell MM Ecophysiology of Photosynthesis . Berlin : Springer . p 149 – 70 . ( Ecological Studies; 100 ).
- Schreiber , U , Schliwa , U and Bilger , W. 1986 . Continuous recording of photochemical and non-photochemical chlorophyll fluorescence quenching with a new type of modulation fluorometer . Photosynthesis Research I , 10 : 51 – 62 .
- Schröder , CR , Polerecky , L and Klimant , I. 2007 . Time-resolved pH/pO2 mapping with luminescent hybrid sensors . Analytical Chemistry , 79 : 60 – 70 .
- Schulz , HN , Brinkhoff , T , Ferdelman , TG , Hernandez-Marine , M , Teske , A and Jørgensen , BB. 1999 . Dense populations of a giant sulphur bacterium in Namibia shelf sediments . Science , 284 : 493 – 5 .
- Schulz , H and Jørgensen , BB. 2001 . Big bacteria . Annual Review of Microbiology , 55 : 105 – 37 .
- Seiter , K , Hensen , C and Zabel , M. 2005 . Benthic carbon mineralization on a global scale . Global Biogeochemical Cycles , 19 : GB1010
- Sejr MK Christensen PB . 2007 . Growth, production and carbon demand of macrofauna in Young Sound, with special emphasis on the bivalve Hiatella arctica and Mya truncate . In: Rysgaard S, Glud RN, editors. Carbon Cycling in Arctic Marine Ecosystems: Case Study – Young Sound. Meddelelser om Grønland, Bioscience 58 : 121 – 36 .
- Shaw , DA and Hanratty , TJ. 1977 . Turbulent mass transfer rates to a wall for large Schmidt numbers . American Institute of Chemical Engineers Journal , 23 : 28 – 37 .
- Simon , M , Grossart , HP , Schweitzer , B and Ploug , H. 2002 . Microbial ecology of organic aggregates in aquatic ecosystems . Aquatic Microbial Ecology , 28 : 175 – 211 .
- Smith , KL. 1978 . Bentic community respiration in the N.W. Atlantic Ocean: in situ measurements from 40 to 5200 m . Marine Biology , 47 : 337 – 47 .
- Smith , KL. 1987 . Food energy supply and demand: a discrepancy between particulate organic carbon flux and sediment community oxygen consumption in the deep ocean . Limnology and Oceanography , 32 : 201 – 20 .
- Smith , KL. 1989 . Short time-series measurements of particulate organic carbon flux and sediment community consumption in the North Pacific . Deep-Sea Research I , 36 : 1111 – 9 .
- Smith , KL and Baldwin , RJ. 1984 . Seasonal fluctuations in deep-sea sediment community oxygen consumption: central and eastern North Pacific . Nature , 307 : 624 – 5 .
- Smith , KL , Clifford , CH , Eliason , AH , Walden , R , Rowe , GT and Teal , JM. 1976 . A free vehicle for measuring benthic community metabolism . Limnology and Oceanography , 21 : 164 – 70 .
- Smith , KL , Glatts , RRC , Baldwin , RJ , Beaulieu , SE , Uhlman , AH Horn , RC . 1997 . An autonomous, bottom-transecting vehicle for making long time-series measurements of sediment community oxygen consumption to abyssal depth . Limnology and Oceanography , 42 : 1601 – 12 .
- Smith KL , Kaufman RS . 1999 . Long-term discrepancy between food supply and demand in the deep eastern North Pacific . Science 1174 – 7 .
- Smith , KL , Kaufmann , RS and Baldwin , RJ. 1994 . Coupling of near-bottom pelagic and benthic processes at abyssal depths in the eastern North Pacific Ocean . Limnology and Oceanography , 39 : 1101 – 18 .
- Smith , KL , Kaufmann , RS , Baldwin , RJ and Carlucci , AF. 2001 . Pelagic–benthic coupling in the abyssal eastern North Pacific: an 8-year time-series study of food supply and demand . Limnology and Oceanography , 46 : 543 – 56 .
- Smith , KL , White , GA and Laver , MB. 1978 . Oxygen uptake and nutrient exchange of sediments measured in situ using a free vehicle grab respirometer . Deep-Sea Research I , 26 : 337 – 46 .
- Solan , M , Wigham , BD , Hudson , IR , Kennedy , R , Coulon , CH Norling , K . 2004 . In situ quantification of bioturbation using time-lapse fluorescent sediment profile imaging (f-SPI), luminophore tracers and model simulation . Marine Ecology Progress Series , 271 : 1 – 12 .
- Ståhl H , Glud A , Schröder CR , Klimant I , Tengberg , Glud RN . 2007 . Time-resolved pH imaging in marine sediments with a luminescent planar optode . Limnology and Oceanography Methods 4 : 336 – 45 .
- Ståhl , H , Hall , POJ , Tengberg , A , Josefson , AB , Streftaris , N Zenetos , A . 2004a . Respiration and sequestering of organic carbon in shelf sediments of the oligotrophic northern Aegean Sea . Marine Ecology Progress Series , 269 : 33 – 48 .
- Ståhl , H , Tengberg , A , Brunnegaard , J , Bjørnholm , E , Forbes , TL Josefson , AB . 2004b . Factors influencing organic carbon recycling and burial in Skagerak sediments . Journal of Marine Research I , 62 : 867 – 907 .
- Ståhl , H , Tengberg , A , Brunnegård , J and Hall , POJ. 2004c . Recycling and burial of organic carbon in sediments of the Porcupine Abyssal plain, NE Atlantic . Deep-Sea Research I , 51 : 777 – 91 .
- Steinberger , N and Hondzo , M. 1999 . Diffusional mass transfer at sediment–water interface . Journal of Environmental Engineering , 2 : 192 – 200 .
- Sten-Knudsen , O. 2002 . Biological Membranes, Theory of Transport, Potentials and Electric Impulses , 671 Cambridge : Cambridge University Press .
- Steneck , RS. 1986 . The ecology of corraline algal crusts: convergent patterns and adaptive strategies . Annual Review of Ecology and Systematics , 17 : 273 – 303 .
- Stief , P , Altmann , D , de Beer , D , Bieg , R and Kureck , A. 2004 . Microbial activities in the burrow environment of the potamal mayfly Ephoron virgo . Freshwater Biology , 49 : 1152 – 63 .
- Strömberg , N and Hulth , S. 2005 . Assessing an imaging ammonium sensor using time correlated pixel-by-pixel calibration . Analytica Chimica Acta , 550 : 61 – 8 .
- Tahey , TM , Duineveld , GCA , de Wilde , AWJ , Berghuis , EM and Kok , A. 1996 . Sediment O2 demand, density and biomass of the benthos and phytopigments along the northwestern Adriatic coast: the extent of Po enrichment . Oceanologica Acta , 19 : 117 – 30 .
- Tang , M and Kristensen , E. 2007 . Impact of microphytobenthis and macrofauna on temporal variation of benthic metabolism in shallow coastal sediments . Journal of Experimental Marine Biology and Ecology , 349 : 99 – 112 .
- Tengberg , A , Almroth , E and Hall , POJ. 2003 . Resuspension and its effects on organic carbon recycling and nutrient exchange in coastal sediments: in situ measurements using new experimental technology . Journal of Experimental Marine Biology and Ecology , 285 : 119 – 42 .
- Tengberg A , De Bovee F , Hall P , Berelson E , Cicceri G , Crassous P , et al. 1995 . Benthic chamber and profile landers in oceanography – a review of design, technical solutions and functioning . Progress in Oceanography 35 : 253 – 94 .
- Tengberg , A , Hall , POJ , Andersson , U , Lindén , B , Styrenius , O Boland , G . 2005 . Intercalibration of benthic flux chambers II. Hydrodynamic characterization and flux comparisons in 14 different designs . Marine Chemistry , 94 : 147 – 73 .
- Tengberg , A , Hovdenes , J , Andersson , HJ , Brocandel , O , Diaz , R Herbert , D . 2006 . Evaluation of a life-time based optode to measure oxygen in aquatic systems . Limnology and Oceanography Methods , 4 : 7 – 17 .
- Tengberg , A , Stahl , H , Gust , G , Muller , V , Arning , U , Andersson , H and Hall , POJ. 2004 . Intercalibration of benthic flux chambers I. Accuracy of flux determinations and influence of chamber hydrodynamics . Progress in Oceanography , 60 : 1 – 28 .
- Thamdrup , B. 2000 . Bacterial manganese and iron reduction in aquatic sediments . Advances in Microbial Ecology , 16 : 41 – 94 .
- Thamdrup , B and Canfield , DE. 2000 . “ Benthic respiration in aquatic sediments ” . In Methods in Ecosystem Science , Edited by: Sala , O , Mooney , H , Jackson , R and Howarth , R . 86 – 103 . New York : Springer .
- Thamdrup , B and Fleischer , S. 1998 . Temperature dependence of oxygen respiration, nitrogen mineralization, and nitrification in Arctic sediments . Aquatic Microbial Ecology , 15 : 191 – 9 .
- Thamdrup , B , Glud , RN and Hansen , JW. 1994 . Manganese oxidation and in situ manganese fluxes from a coastal sediment . Geochimica et Cosmochimica Acta , 58 : 2563 – 70 .
- Thamdrup , B , Glud , RN and Hansen , JW. 2007 . Benthic carbon cycling in Young Sound, Northeast Greenland. In: Rysgaard S, Glud RN, editors. Carbon Cycling in Arctic Marine Ecosystems: Case Study – Young Sound. Meddelelser om Grønland . Bioscience , 58 : 138 – 57 .
- Thar , R and Kühl , M. 2002 . Conspicuous veils formed by vibrioid bacteria on sulfidic marine sediments . Applied and Environmental Microbiology , 68 : 6310 – 20 .
- Therkildsen , MS and Lomstein , B. 1993 . Seasonal variation in net benthic C-mineralization in a shallow estuary . FEMS Microbiology Ecology , 12 : 131 – 42 .
- Thibodeaux , LJ and Boyle , JD. 1987 . Bedform-generated convective transport in bottom sediment . Nature , 325 : 341 – 3 .
- Thibodeaux , LJ , Chang , LK and Lewis , DJ. 1980 . “ Dissolution rates of organic contaminants located at the sediments water interface of rivers, streams and tidal zones ” . In Contaminants and Sediments , Edited by: Baker , RA . Vol. 1 , Ann Arbor, MI : Ann Arbor Science .
- Thiel , H , Kirstein , KO , Luth , C , Luth , U , Luther , G Meyerreil , LA . 1994 . Scientific requirements for an abyssal benthic laboratory . Journal of Marine Systems , 4 : 421 – 39 .
- Timmerman , K , Banta , GT and Glud , RN. 2007 . Linking Arinicola marina irrigation behavior to oxygen transport and dynamics in sandy sediments . Journal of Marine Research I , 64 : 915 – 38 .
- Ullman , WJ and Aller , RC. 1982 . Diffusion coefficients in nearshore marine sediments . Limnology and Oceanography , 27 : 552 – 6 .
- Viollier , E , Rabouille , C , Apitz , SE , Breuer , E , Chaillou , G Dedieu , K . 2003 . Benthic biogeochemistry: state of the art technologies and guidelines for the future of in situ survey . Journal of Experimental Marine Biology and Ecology , 285/286 : 5 – 31 .
- Vogel , S and Bretz , WL. 1971 . Interfacial organisms: passive ventilation in the velocity gradient near surfaces . Nature , 175 : 210 – 11 .
- Volkenborn , N and Reise , K. 2006 . Lugworm exclusion experiment: responses by deposit feeding worms to biogenic habitat transformations . Journal of Experimental Marine Biology and Ecology , 330 : 169 – 79 .
- Vopel , K and Hawes , I. 2006 . Photosynthetic performance of benthic microbial mats in Lake Hoare, Antarctica . Limnology and Oceanography , 51 : 1801 – 12 .
- Vopel , K , Reick , CH , Arlt , G , Pöhn , M and Ott , JA. 2002 . Flow microenvironment of two marine peritrich ciliates with ectobiotic chemoautotrophic bacteria . Aquatic Microbial Ecology , 29 : 19 – 28 .
- Vopel , K , Thistle , D and Rosenberg , R. 2003 . Effect of the brittle star Amphiura filiformis (Amphiuridae, Echinodermata) on oxygen flux into the sediment . Limnology and Oceanography , 48 : 2034 – 45 .
- Weaver , PPE and Schultheiss , PJ. 1983 . Vertical open burrows in deep-sea sediments 2 m in length . Nature , 301 : 329 – 31 .
- Webb , AP and Eyre , BD. 2004a . The effects of two benthic chamber stirring systems on the diffusive boundary layer, oxygen flux, and passive flow through model macrofauna burrows . Estuaries , 27 : 352 – 61 .
- Webb , AP and Eyre , BD. 2004b . Effect of natural populations of burrowing thalassinidean shrimp on sediment irrigation, benthic metabolism, nutrient fluxes and denitrification . Marine Ecology Progress Series , 268 : 205 – 20 .
- Weiss , MS , Abele , U , Weckesser , J , Welte , W and Schulz , GE. 1991 . Molecular architecture and electrostatic properties of a bacterial porin . Science , 254 : 1627 – 30 .
- Wenzhöfer , F , Adler , M , Kohls , O , Hensen , C , Strotmann , B Boehme , S . 2001a . Calcite dissolution driven by benthic mineralization in the deep-sea: in situ measurements of Ca2+, pH, pCO2 and O2 . Geochimica et Cosmochimica Acta , 65 : 2677 – 90 .
- Wenzhöfer , F and Glud , RN. 2002 . Benthic carbon mineralization in the Atlantic: a synthesis based on in situ data from the last decade . Deep-Sea Research I , 49 : 1255 – 79 .
- Wenzhöfer , F and Glud , RN. 2004 . Small-scale spatial and temporal variability in benthic O2 dynamics of coastal sediments: impact of fauna activity . Limnology and Oceanography , 49 : 1471 – 81 .
- Wenzhöfer , F , Holby , O , Glud , RN , Nielsen , HK and Gundersen , JK. 2000 . In situ microsensor studies of a shallow water hydrothermal vent at Milos, Greece . Marine Chemistry , 69 : 43 – 54 .
- Wenzhöfer , F , Holby , O and Kohls , O. 2001b . Deep penetrating benthic oxygen profiles measured in situ by oxygen optodes . Deep-Sea Research I , 48 : 1741 – 55 .
- Wenzhöfer , F , Riess , W and Luth , U. 2002 . In situ macrofaunal respiration rates and their importance for benthic carbon mineralization on the northwestern Black Sea shelf . Ophelia , 56 : 87 – 100 .
- Wieland , A , Beer de , B , Damgaard , LR , Kühl , M , Dusschoten van , D and van As , H. 2001 . Fine-scale measurement of diffusivity in a microbial mat with nuclear magnetic resonance imaging . Limnology and Oceanography , 46 : 248 – 59 .
- Wieland , A and Kühl , M. 2000 . Irradiance and temperature regulation of oxygenic photosynthesis and O2 consumption in a hypersaline cyanobacterial mat, Solar Lake, Egypt . Marine Biology , 137 : 71 – 85 .
- Witte , U , Aberle , N , Sand , M and Wenzhöfer , F. 2003a . Rapid response of a deep-sea benthic community to POM enrichment: an in situ experimental study . Marine Ecology Progress Series , 251 : 27 – 36 .
- Witte , U and Pfannkuche , O. 2000 . High rates of benthic carbon remineralization in the abyssal Arabian sea . Deep-Sea Research I , 47 : 2785 – 804 .
- Witte , U , Wenzhöfer , F , Sommer , S , Boetius , A , Heinz , P Aberle , N . 2003b . In situ evidence of the fate of a phytodetritus pulse at the abyssal sea floor . Nature , 424 : 763 – 6 .
- Wollast , R. 1998 . “ Evaluation and comparison of the global carbon cycle in the coastal zone and in the open ocean ” . In The Sea: The Global Coastal Ocean: Processes and Methods , Edited by: Brink , KH and Robinson , AR . 213 – 52 . New York : John Wiley & Sons .
- Wyngaard , JC. 1990 . Scalar fluxes in the planetary boundary layer – theory, modelling and measurements . Boundary Layer Meteorology , 50 : 49 – 75 .
- Zenkevitch , LA. 1963 . Biology of the Seas of USSR , London : George Allan & Unwin .
- Zhu , QZ , Aller , RC and Fan , YZ. 2005 . High performance planar pH fluorosensor for two-dimensional pH measurements in marine sediment and water . Environmental Science & Technology , 39 : 8906 – 11 .
- Zhu , QZ , Aller , RC and Fan , YZ. 2006a . A new ratiometric, planar fluorosensor for measuring high resolution, two dimensional pCO2 distribution in marine sediments . Marine Chemistry , 101 : 40 – 53 .
- Zhu , QZ , Aller , RC and Fan , YZ. 2006b . Two dimensional pH distributions and dynamics in bioturbated marine sediments . Geochimica et Cosmochimica Acta , 70 : 4933 – 49 .
- Ziebis , W , Huettel , M and Forster , S. 1996 . Impact of biogenic sediment topography on oxygen fluxes in permeable seabeds . Marine Ecology Progress Series , 140 : 22