
ABSTRACT
Waste mitigation is recognised as the most effective strategy for managing construction and demolition waste. Designing out Waste (DoW) is an approach aimed at reducing waste during construction and demolition by improving project planning and design. Despite its recognition, limited research has been conducted on the factors influencing the implementation of DoW in construction. A questionnaire survey was conducted to collect data on DoW practices, barriers, and enablers from 76 construction practitioners in New South Wales, Australia. A model was developed and analysed using partial least squares structural equation modelling (PLS-SEM). The results indicate a significant relationship between DoW practices and two key barriers: Design-related Barriers and Lack of Experience and Skills. The results also show a significant relationship between Enablers and DoW. Three significant enabling variables identified in this study, which are good communication and coordination, Building Information Modelling (BIM), and utilisation of prefabrication, precast and 3D printing. However, no moderating influence of the enablers was identified in the relationship between the barriers and DoW practices. Through the developed model, this research provides insights into implementing DoW in construction by addressing multifaceted barriers and implementing interventions for effective waste reduction.
Introduction
Waste is a global concern, with the East Asia and Pacific region responsible for about 23% of worldwide waste (The Worold Bank, Citation2018). High-income nations, including Australia, significantly contribute to this issue (Doust, Battista, & Rundle, Citation2021). In 2018–2019, Australia generated 76 million tonnes of waste, a 10% increase from 2016 to 2017, with over half recycled and 27% sent to landfills (Australian Bureau of Statistics, Citation2020). The construction sector in Australia plays a substantial role in waste production. Per capita construction waste rose by 32% in 13 years (Pickin, Wardle, O’Farrell, Nyunt, & Donovan, Citation2020). In 2016–2017, this sector generated 12.7 million tonnes of waste, about 17% of all waste produced, costing over 2 billion AUD in waste services (Australian Bureau of Statistics, Citation2020). Construction waste volume increased by 22% from 2016–2017 to 2018–2019 (Australian Bureau of Statistics, Citation2020), with this upward trend expected to continue due to expanded construction activities in Australia.
Waste reduction is a key measure to mitigate the adverse environmental impact and alleviate the economic burden associated with waste management (NSW EPA, Citation2022). Waste mitigation, which entails adopting strategies and procedures aimed at preventing and reducing waste at its source (Keys, Baldwin, & Austin, Citation2000), has gained widespread acceptance as the most effective strategy. While several studies have examined construction waste mitigation in the design phase (Ajayi & Oyedele, Citation2018; Akinade et al., Citation2018; Laovisutthichai, Lu, & Bao, Citation2020; Olanrewaju & Ogunmakinde, Citation2020; Xu & Lu, Citation2019), basic waste reduction strategies and tools remain largely unexplored (Ajayi et al., Citation2017). Designing out Waste (DoW) has specifically emerged as an efficient strategy for waste minimisation by enhancing decision-making and improving the design process. Although DoW is recognised as the most efficient and cost-effective method of waste management (Yang, Xia, Thompson, & Flower, Citation2017), its application in the construction industry has yet to reach its full potential. The limited progress within the Australian construction sector regarding the adoption of waste mitigation strategies over the past two decades can be attributed to government policies that primarily prioritise waste recycling over waste minimisation (Doust et al., Citation2021).
While several studies focus on the barriers of waste management in construction in general (e.g. Udawatta et al., Citation2018), limited research can be found on the factors influencing DoW specifically. Therefore, the objective of this study is to identify the barriers and enablers of DoW practices, using Australia as a case study. Identifying such factors is crucial for understanding how DoW can be applied in practice more widely. The following section provides further details about DoW in construction, followed by a section on the barriers and enablers of waste mitigation drawn from the existing literature.
Designing out waste practice in construction
DoW is defined as an approach that controls resources effectively during the design phase of a project to reduce waste generated during the construction and demolition phases (Othman & Elsawaf, Citation2021). Keys et al.'s (Citation2000) study is one of the pioneering works that played a pivotal role in advocating the implementation of DoW in the construction sector. DoW practices in construction can be divided into three levels: strategies, guidelines, and tools.
Commitment from top management in construction firms is vital for successful waste mitigation (Camilleri, Citation2022). The adoption of ISO 14000 environmental management standards within the firm is an indicator of such commitment. However, according to Osmani et al. (Citation2008b), some UK architectural firms displayed limited ISO 14001 adoption, reflecting inadequate knowledge of waste issues. Another pertinent standard is the British Standard BS 8895, titled ‘Designing for Material Efficiency in Building Projects’. This standard offers recommendations for optimising material efficiency in design and construction, promoting virgin material reduction and waste prevention (Osmani, Citation2013).
In terms of guidelines, the Waste and Resource Action Programme (WRAP) can be implemented in construction projects (Laovisutthichai et al., Citation2020). Originating in the UK, WRAP offers five principles, which are design for material optimisation, design for recovery and reuse, design for waste-efficient procurement, design for off-site construction, and design for deconstruction and flexibility (Langdon, Citation2009). Although, the Better Practice Guidelines for Waste Management by the Environment Protection Authority (EPA) in New South Wales (NSW) encourage sustainable waste management in design and operation (NSW EPA, Citation2012), they lack specific design-related waste mitigation strategies. In addition, EPA's toolkit aids project managers in handling construction and demolition waste but lacks detailed waste reduction strategies during design and procurement (NSW EPA, Citation2020).
DoW tools like design reviews and meetings can identify waste mitigation opportunities in the project's early stages (Ajayi & Oyedele, Citation2018). Waste reduction meetings can be conducted periodically or on an ad-hoc basis and may involve the client as necessary (Baldwin, Poon, Shen, Austin, & Wong, Citation2009). However, these meetings are not commonly practised due to the perception that waste is inevitable and can be dealt with at another phase of the project (Akinade et al., Citation2018). Building Information Modelling (BIM) is another tool that supports waste mitigation by enhancing project performance through detailed modelling, visualisation, simulation, clash detection, enhanced coordination, and streamlined communication for better understanding and quicker decision-making (Ajayi et al., Citation2017; Akinade et al., Citation2018; Liu, Osmani, Demian, & Baldwin, Citation2015).
Designing out waste barriers and enablers
As mentioned earlier, there is a dearth of studies focusing on the barriers and enablers of DoW in the construction industry. However, existing studies have indicated several factors influencing waste minimisation in construction more broadly. An in-depth literature review has uncovered 15 barriers to waste minimisation as summarised in . The barriers can broadly be categorised into design-related, project-related, and designer-related barriers. For example, design changes can contribute to construction waste through several mechanisms such as re-work, demolition of existing structures or components, disposal of unused materials, reordering and repackaging, and material overordering.
Table 1. Barriers and enablers of waste minimisation in construction.
On the other hand, enablers are actions or conditions that facilitate DoW implementation. Enablers empower designers, contractors, and clients to effectively reduce construction and demolition waste (Batoul & Amna, Citation2019; Davis, Sher, Tang, & Newaz, Citation2018; Kabirifar, Mojtahedi, Wang, & Tam, Citation2020; Newaz, Davis, Sher, & Simon, Citation2020; Udawatta, Zuo, Chiveralls, & Zillante, Citation2015). For example, using incentives led to a substantial 23% waste reduction in a Hong Kong hotel redevelopment project (Seneviratne, Rameezdeen, & Amaratunga, Citation2015). Eight potential enablers have been identified through the literature review as shown in . For instance, the utilisation of prefabrication, precast and 3D printing can mitigate waste at its source by several means such as reducing site work, allowing for more recyclable materials to be used, promoting customisation and optimisation of design and structures, creating on-demand production and reducing the need for large inventories, and producing components with high precision thereby reducing the need for on-site adjustments and cutting waste. In addition, good communication and coordination among designers and professionals help to ensure efficient planning, accurate project specifications, optimum construction processes, and design for efficiency in terms of material use. The empirical research will validate the identified barriers and enablers of waste minimisation and evaluate their relevance and influence on DoW practices, as detailed in the next sections.
Research method
Method of data collection
A questionnaire survey was conducted to gather data from professionals in the construction sector in NSW, Australia. The survey is used to validate the factors of DoW and test the relationship between the barriers, enablers and DoW practices. The survey consisted of four sections. The first section collected background information about the respondents, including their education, job title, years of experience in the construction industry, and project types. The second section focused on DoW practices in construction. The third and fourth sections covered DoW barriers and enablers. Respondents rated these DoW factors on a five-point Likert scale, ranging from ‘strongly disagree’ to ‘strongly agree’ with each statement.
A probability random sampling method was employed to target construction industry professionals in NSW, including designers, architects, construction project managers, engineering managers, and sustainability managers. NSW was chosen for its status as the most economically vibrant Australian state with the highest construction activity levels. The population size of relevant professionals was estimated using data from the Labour Market Information Portal (LMIP, Citation2021), indicating around 340,000 professionals employed in the construction industry in NSW at the time of conducting this study. Given this population size, a sample of approximately 196 respondents was determined using relevant sample size equations by considering a 95% confidence level and 0.07 confidence interval (Moinester & Gottfried, Citation2014; Riley et al., Citation2020).
The survey was created using the Qualtrics online survey tool, a well-established platform renowned for its real-time interaction and user-friendly interface (Molnar, Citation2019). After obtaining research ethics approval (approval number H14793), the survey was primarily distributed through direct email outreach to individuals and construction companies. It was also shared across various professional and social networks, with a particular emphasis on the LinkedIn platform. LinkedIn, a leading online platform for professional networking and job searching, is widely recognised as one of the largest professional networks on the internet (Ponte, Méndez-Zorrilla, & Ruiz, Citation2022; Rapanta & Cantoni, Citation2017).
Response rate and respondents information
One week following the initial survey distribution, a reminder was sent to prompt respondents to complete the survey, followed by two additional reminders at two and three weeks post-initial distribution. A total of 112 responses were received. After screening, it was identified that 18 respondents had not completed the entire survey, and another 18 were not part of the intended population (i.e. not working in NSW nor in the construction industry). Consequently, 76 valid responses were eligible for analysis, resulting in a response rate of approximately 39%. This response rate is considered acceptable, especially in the construction field, which can attract 25-35% or lower (Fellows & Liu, Citation2021). The demographic information of the respondents is shown in .
Table 2. Background information of respondents.
Method of data analysis
Factor analysis and partial least squares-structural equation modelling (PLS-SEM) are used to analyse the collected data. Initially, factor analysis was performed to reduce the numerous items or variables into a smaller set of components (Hair, Black, Babin, & Anderson, Citation2018). Subsequently, PLS-SEM was employed to validate the outcomes of the factor analysis and to develop a DoW in construction model. According to Henseler et al. (Citation2014), PLS-SEM serves as a valuable tool for reducing the dimensionality of data and modelling latent variables as well as composites. It is particularly useful when research objectives involve balancing prediction and theory testing, or when the model is complex, involving constructs with only one measurement item, which is the case in this study.
Prior to the analysis, the analysis of variance (ANOVA) test was carried out to evaluate the data homogeneity and determine if there were any significant differences in opinions among the respondents from various occupational backgrounds. As shown in , the results indicate no significant differences in the opinions of respondents, confirming the homogeneity of the dataset. also shows the variables used in the survey, including their respective codes used in the model.
Table 3. Result of ANOVA of DoW factors.
Results
Factor analysis results
As presented in the literature review section, this study initially identified fifteen barriers, which can be reduced further into a smaller number of components using factor analysis. This test was not applied to the enablers as only eight enabling factors were identified from the literature. To confirm the data’s suitability for factor analysis, the Kaiser-Meyer-Olkin (KMO) measure of sampling adequacy (Wiesen, Citation2019) and Bartlett's test of sphericity (Denis, Citation2018) were conducted first. The result of KMO was 0.746 while Bartlett’s test of sphericity resulted in Chi-square value of 410.914 with degree of freedom equal 105 and a significance level of less than 0.001 indicating the suitability of the data for this test. Subsequently, Principal Component Analysis extraction method was used with Varimax rotation to enhance variable distribution within the components. As shown in , the analysis resulted in five components of barriers that collectively explained more than 69% of the total variance.
Table 4. Result of the rotated component matrix of DoW barriers.
As shown in the result, the items distribution within constructs is generally good. However, ‘Lack of knowledge about standardisation’ exhibits cross-loading with Component 1 and Component 2. This variable can be more appropriately assigned to Component 2, as it appears more relevant to the other items of this component compared to Component 1.
Based on the items representing each component, the extracted components can be named as follows:
Component 1: Lack of Experience and Skills
Component 2: Knowledge-related Barriers
Component 3: Design-related Barriers
Component 4: Project-related Barriers
Component 5: Client-related Barriers
Further analysis using PLS-SEM serves to validate the extracted components and explore the impact of the identified barriers and enablers on DoW practices, as elaborated in the subsequent section.
PLS-SEM results and full model configuration
The full model of the relationships between barriers, enablers, and DoW was created using SmartPLS version 4. Measurement items were reflectively assigned to their corresponding latent variables (i.e. constructs) to establish the model (Sarstedt & Cheah, Citation2019). Several algorithm iterations were carried out within SmartPLS to refine the model and ensure it met established quality criteria. During the model configuration, certain items were removed from latent variables to enhance construct validity and reliability (Hair, Risher, Sarstedt, & Ringle, Citation2019).
The construct ‘Client-related Barriers’ retained only one measurement item, as the second item, ‘lack of interest of the client,’ was excluded due to its limited indicator loading. Constructs with single item have no reliability and validity generated because reliability and validity are measured as the interaction among the items constituting the construct (Hair et al., Citation2019). Thus, reliability and validity result for ‘Client-related Barriers’ construct is not included here. presents the final model of DoW in construction.
Figure 1. Full model of DoW in construction (algorithm result).
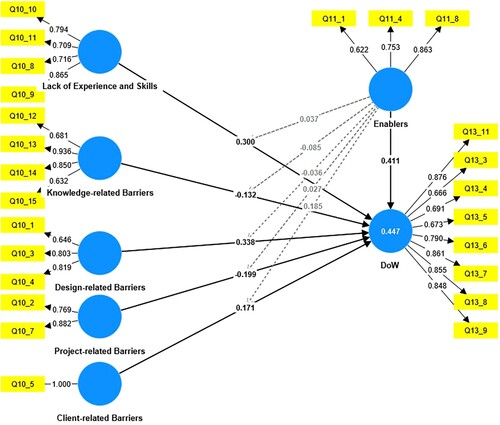
The PLS-SEM model is structured into two levels of linear equations: the measurement model (or outer model) and the structural model (or inner model). The measurement model defines the relationship between a construct and its measurement items, such as ‘Knowledge-based Barriers’ and its set of measurement items. In contrast, the structural model outlines the relationships among the constructs, like the connection between ‘Knowledge-based Barriers’ and ‘DoW.’ The enablers are configured to have a moderating effect on the relationship between the barriers and DoW. The evaluation of the model's quality involves assessing both the measurement and structural models.
The evaluation of the measurement models was carried out using various methods. First, construct reliability was assessed using both Cronbach's alpha and composite reliability. As displayed in , the constructs’ reliability ranged from acceptable to good, with values between 0.6 and 0.9, except for ‘Project-related Barriers,’ which scored slightly below the threshold (Hair et al., Citation2019). This is considered acceptable considering that this is a new construct (i.e. not being tested in previous research) and it has a few measurement items which can reduce the reliability score. Second, construct convergent validity was evaluated using the Average Variance Extracted (AVE), which should be 0.5 or above to explain at least 50% of the variance of its items (Hair et al., Citation2019). All constructs in this study exceeded this threshold. Last, discriminant validity was assessed using the heterotrait-monotrait (HTMT) ratio of correlations (Henseler, Ringle, & Sarstedt, Citation2015), and all constructs exceeded the threshold, as illustrated in .
Table 5. Construct reliability, convergent validity, and discriminant validity.
After establishing the quality of the measurement models, further analysis was conducted to assess the structural model’s quality and to test the significance of the relationships between the constructs. Various measures were employed for this assessment, including collinearity assessment, explanatory power via the coefficient of determination (R-square), predictive model power, and examination of the significance and relevance of the model using path coefficients (Hair et al., Citation2019). First, collinearity was assessed to examine the regression result of the relationships between the constructs using VIF, which should be close to 3 or lower (see Table 7). Second, R-square was used to determine the extent of change in the endogenous construct affected by the exogenous constructs in the model. The results indicate that the R-square is 0.447 (adjusted R-square is 0.351), indicating moderate explanatory power. In other words, approximately 45% of the variation in DoW practices is explained by the barriers and enablers, which is good, emphasising the importance of addressing these constructs when implementing DoW in practice. Third, the Q2 was calculated to assess the predictive accuracy of the model using PLSpredict with the default settings of the number of folds and repetitions set to 10 (Shmueli et al., Citation2019). The result of Q2 for the endogenous construct and its indicators is above zero, indicating the predictive accuracy of the structural model for DoW. As shown in , all indicators in the PLS-SEM analysis have lower RMSE (root mean squared error) values compared to the naïve LM (linear regression model) benchmark, indicating high predictive power of the model (Shmueli et al., Citation2019). RMSE was chosen for comparison instead of MAE (mean absolute error) as the prediction error of the indicators does not exhibit a highly non-symmetric distribution. Overall, the Q2 predict for the DoW construct is 0.149, indicating a small predictive relevance of the PLS-path model (Hair et al., Citation2019). Last, the significance and relevance of the path coefficients were evaluated using the bootstrapping procedure in SmartPLS, as elaborated in the following section.
Table 6. Predictive power result (PLSpredict).
Path coefficient procedure and results
The bootstrapping analysis was conducted in SmartPLS to determine the significance of the relationships between the constructs. As illustrated in and , ‘Lack of Experience and Skills’, ‘Design-related Barriers’, and ‘Enablers’ exhibit a significant relationship with ‘DoW’, with p-values equal to 0.043, 0.024, and 0.001, respectively. However, the other constructs within the model did not demonstrate strong or statistically significant relationship with ‘DoW’. The effect size (f-square), which measures the impact of removing an exogenous construct on the R-square value (Hair et al., Citation2019), is medium for both ‘Enablers’ and ‘Design-related Barriers’, and small for the remaining constructs (see ). Furthermore, it is worth noting that ‘Enablers’ did not show a moderating effect on the relationship between the barriers and DoW.
Figure 2. Path coefficients results (bootstrapping results).
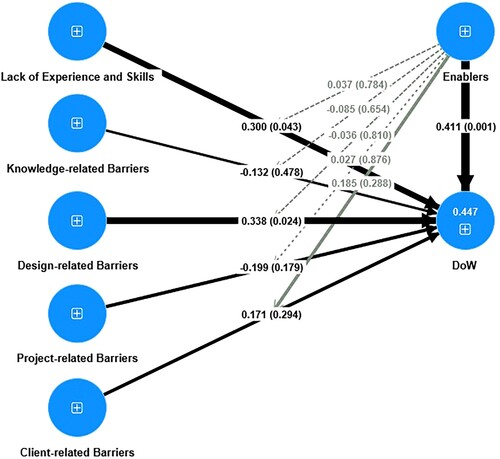
Table 7. Path coefficients, F-square, and collinearity (VIF) results.
Importance performance map results
The Importance Performance Map (IPMA) analysis (Hair et al., Citation2019; Ringle & Sarstedt, Citation2016) provided deeper insights into the findings. Unlike traditional ranking methods such as mean values, IPMA assesses the overall impact of the model on DoW and compares it to the average scores of the preceding constructs. shows the performance and importance matrix of the exogenous constructs on DoW. For example, ‘Enablers’ has an importance value of 0.411 (total effects) with approximately 67% performance on DoW. This implies that a one-unit increase in ‘Enablers’ performance can lead to a corresponding increase in DoW performance, independent of other constructs in the model. The performance of all items of the exogenous constructs on DoW is summarised in . Notably, Q11_4 exhibits the highest performance for DoW with about 78%, and a total effect of 0.179. This is followed by Q10_5, Q10_4, Q10_7, Q10_2, Q10_3, Q10_8, Q11_8, and Q10_9.
Figure 3. IPMA results of exogenous constructs.
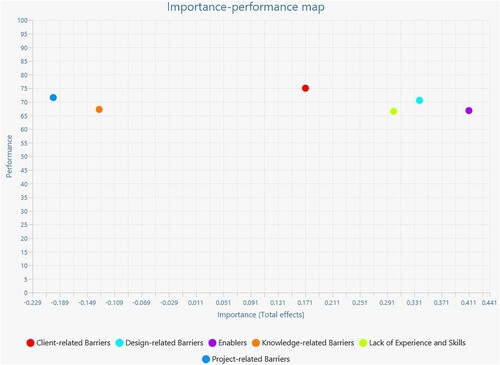
Table 8. IPMA results of indicators’ total effects and performance.
Discussion of results
Barriers of designing out waste in construction
The study confirmed the significant influence of Design-related Barriers and Lack of Experience and Skills on the practice of Designing out Waste (DoW) in construction. The Importance Performance Map Analysis (IPMA) highlighted specific barriers that have a significant impact on DoW. These include the following: contract does not specify reducing waste during the design phase, changes in processes and practices of design, project constraints, poor design, complex design, designers’ negative perceptions towards DoW, and a lack of information and communication technology (ICT) tools. These findings underline the complexity of barriers in the construction industry, emphasising the need for targeted interventions to effectively overcome them.
The first construct with a significant influence on DoW is Design-related Barriers, encompassing the following variables: complex design, changes in design processes, and design changes. This result aligns with previous research emphasising the importance of addressing design-related barriers for effective waste reduction (Ajayi et al., Citation2017; Ajayi & Oyedele, Citation2018).
Complex design can lead to errors, ambiguities, and re-work, requiring additional time, specialised skills, and resources. Thorough planning, design review, and effective communication among project teams are essential to address these barriers. Furthermore, ensuring adequate detailing of complex designs can enhance design quality and reduce waste, as mentioned by Ajayi and Oyedele (Citation2018). Besides, changes in design processes and practices can result in construction waste due to communication issues and material ordering errors. Furthermore, design changes may cause substantial waste during the construction stage. In the study of Olanrewaju and Ogunmakinde (Citation2020), ‘design changes’ was ranked second among other major variables contributing to construction material waste. It can increase material costs and re-work leading to more waste (Doust et al., Citation2021). In addition, design changes can lead to acquiring additional materials, duplicating previously purchased items, creating excess inventory. To minimise waste resulted from design changes, it is crucial to implement a well-structured change management process. This process should involve effective communication among main project stakeholders, clear documentation of changes, and a comprehensive evaluation of the impact of change on existing materials and work. Proactive planning and decision-making are essential for waste reduction and enhancing construction project efficiency.
The second construct, Lack of Experience and Skills, includes four barriers: lack of experience and skills in implementing DoW, designers’ negative perception towards DoW, lack of ICT tools, and lack of awareness of DoW. When designers lack experience in DoW principles, they may inadvertently create designs that are not optimised for waste reduction. Likewise, negative perceptions among designers may hinder the adoption of waste reduction strategies. Designers may resist incorporating DoW principles into their designs, resulting in missed opportunities to reduce waste. Li, Tam, Zuo, and Zhu (Citation2015) found that designers’ attitude and perceived behaviour control have a positive and significant effect on their behaviour on construction waste reduction. To address these challenges, comprehensive training for project stakeholders, especially designers and project managers, is essential. On the other hand, the absence of ICT tools can hinder efficient waste management as design becomes less optimised. The adoption of ICT tools can enhance waste reduction efficiency, and promoting a positive perception of DoW within the industry is crucial for sustainable construction practices.
Enablers of designing out waste in construction
This study identified three significant enablers for DoW practices: good communication and coordination, using Building Information Modelling (BIM), and the utilisation of prefabrication, precast, and 3D printing. Effective communication and coordination emerged as the most influential enabler, underscoring the significance of clear and collaborative communication channels among diverse designers from various disciplines. Effective communication bridges the gap between stakeholders, ensuring seamless integration of design adaptations and waste reduction strategies across different project phases. Furthermore, effective communication has the potential to mitigate the negative perceptions held by designers, fostering a more receptive attitude towards the adoption of DoW. Similarly, BIM provides a collaborative platform for project teams to share comprehensive design and construction data, streamlining design coordination and reducing errors. BIM enhances communication and collaboration among project team members, allowing real-time updates and design modifications. This streamlines the design change process and minimises errors or clashes that may arise from manual revisions. BIM also aids in managing complex designs by providing a virtual model for stakeholders to visualise and analyse the design more comprehensively. This result aligns with previous studies highlighting the effectiveness of BIM in overcoming design-related barriers and improving project outcomes, as indicated by Sacks et al. (Citation2018) and Succar (Citation2009). Lastly, the study emphasises the significant role of prefabrication, precast, and 3D printing techniques as enablers of DoW in construction. These construction methods optimise material utilisation and minimise on-site construction activities, aligning seamlessly with DoW principles.
Conclusion
This study identifies two key constructs influencing Designing out Waste (DoW) in construction, namely Design-related Barriers and Lack of Experience and Skills. Design-related Barriers encompasses complex design, change in processes and practices of design, and design changes. Complex designs may lead to errors, inefficiencies, and material wastage, necessitating better planning, design review, and communication. Changes in design processes can result in errors and excess packaging, while design changes may lead to re-work and excess inventory. To address this barrier, an effective change management process with clear communication and thorough design evaluation is essential. The second construct, Lack of Experience and Skills, includes the following barriers lack of experience, negative perceptions towards DoW, limited ICT tools, and a lack of awareness. Comprehensive training and the adoption of ICT tools are essential to mitigate these challenges.
This study also identifies three enablers for DoW practices: good communication and coordination, Building Information Modelling (BIM), and utilisation of prefabrication, precast and 3D printing. Effective communication bridges gaps between stakeholders and enhances designer perceptions. BIM streamlines design coordination and reduces errors. Innovative construction methods optimise material usage and reduce on-site activities, subsequently mitigating construction waste. However, this study did not observe a moderating influence of the enablers on the relationship between barriers and DoW practices. This suggests the importance of further research to explore specific enabling factors to overcome the identified barriers in subsequent studies. The limitation of this study is that it focused on construction professionals in NSW, making it challenging to generalise the results to the entire Australian construction industry. Therefore, future research should consider expanding the sample to include professionals from other states and territories.
In conclusion, this study underscores the importance of addressing barriers and leveraging enablers to enhance DoW practices in construction. The research contributes by highlighting the multifaceted nature of barriers and the potential for specific interventions to enhance DoW practices. Addressing barriers and leveraging enablers can lead to more efficient design and construction process, ultimately reducing waste and contributing to a greener future.
Disclosure statement
No potential conflict of interest was reported by the author(s).
References
- Ajayi, S., & Oyedele, L. (2018). Critical design factors for minimising waste in construction projects: A structural equation modelling approach. Resources, Conservation and Recycling, 137, 302–313. doi:10.1016/j.resconrec.2018.06.005
- Ajayi, S., Oyedele, L., Akinade, O., Bilal, M., Alaka, H., Owolabi, H., & Kadiri, K. (2017). Attributes of design for construction waste minimization: A case study of waste-to-energy project. Renewable and Sustainable Energy Reviews, 73, 1333–1341. doi:10.1016/j.rser.2017.01.084
- Ajayi, S. O., Oyedele, L. O., Kadiri, K. O., Akinade, O. O., Bilal, M., Owolabi, H. A., & Alaka, H. A. (2016). Competency-based measures for designing out construction waste: task and contextual attributes. Engineering, Construction, and Architectural Management, 23(4), 464–490. doi:10.1108/ECAM-06-2015-0095
- Akinade, O. O., Oyedele, L. O., Ajayi, S. O., Bilal, M., Alaka, H. A., Owolabi, H. A., & Arawomo, O. O. (2018). Designing out construction waste using BIM technology: Stakeholders’ expectations for industry deployment. Journal of Cleaner Production, 180, 375–385. doi:10.1016/j.jclepro.2018.01.022
- Alshboul, A. A., & Abu Ghazaleh, S. (2014). Consequences of design decisions on material waste during construction survey of architects': Point of view, the case of Jordan. Jordan Journal of Civil Engineering, 159(3269), 1–12.
- Australian Bureau of Statistics. (2020). Waste account, Australia, experimental estimates. https://www.abs.gov.au.
- Baldwin, A., Poon, C.-S., Shen, L.-Y., Austin, S., & Wong, I. (2009). Designing out waste in high-rise residential buildings: Analysis of precasting methods and traditional construction. Renewable Energy, 34(9), 2067–2073. doi:10.1016/j.renene.2009.02.008
- Banihashemi, S., Tabadkani, A., & Hosseini, M. R. (2018). Integration of parametric design into modular coordination: A construction waste reduction workflow. Automation in Construction, 88, 1–12. doi:10.1016/j.autcon.2017.12.026
- Batoul, Y. H., & Amna, I. S. (2019). Construction waste management in UAE: An exploratory study. WIT Transactions on Ecology and the Environment, 238, 679. doi:10.2495/SC190581
- Camilleri, M. A. (2022). The rationale for ISO 14001 certification: A systematic review and a cost–benefit analysis. Corporate Social Responsibility and Environmental Management, 29(4), 1067–1083.
- Davis, P., Sher, W., Tang, P., & Newaz, M. (2018). Factors affecting waste management on New South Wales construction sites. COBRA 2018.
- Denis, D. J. (2018). SPSS data analysis for univariate, bivariate, and multivariate statistics. Hoboken, NJ: John Wiley & Sons.
- Doust, K., Battista, G., & Rundle, P. (2021). Front-end construction waste minimization strategies. Australian Journal of Civil Engineering, 19(1), 1–11. doi:10.1080/14488353.2020.1786989
- Ekanayake, L. L., & Ofori, G. (2004). Building waste assessment score: design-based tool. Building and Environment, 39(7), 851–861. doi:10.1016/j.buildenv.2004.01.007
- Fellows, R. F., & Liu, A. M. (2021). Research methods for construction. Hoboken, NJ: John Wiley & Sons.
- Hair, J. F., Black, W. C., Babin, B. J., & Anderson, R. E. (2018). Multivariate data analysis (8th ed.). Mason: Cengage.
- Hair, J. F., Risher, J. J., Sarstedt, M., & Ringle, C. M. (2019). When to use and how to report the results of PLS-SEM. European Business Review, 31(1), 2–24. doi:10.1108/EBR-11-2018-0203
- Henseler, J., Dijkstra, T. K., Sarstedt, M., Ringle, C. M., Diamantopoulos, A., Straub, D. W., … Calantone, R. J. (2014). Common beliefs and reality about PLS: Comments on Rönkkö and Evermann (2013). Organizational Research Methods, 17(2), 182–209. doi:10.1177/1094428114526928
- Henseler, J., Ringle, C. M., & Sarstedt, M. (2015). A new criterion for assessing discriminant validity in variance-based structural equation modeling. Journal of the Academy of Marketing Science, 43, 115–135. doi:10.1007/s11747-014-0403-8
- Ipsen, K. L., Pizzol, M., Birkved, M., & Amor, B. (2021). How lack of knowledge and tools hinders the eco-design of buildings—A systematic review. Urban Science, 5(1), 20. doi:10.3390/urbansci5010020
- Jaques, R. (2000). Construction site waste generation-the influence of design and procurement. Architectural Science Review, 43(3), 141–145. doi:10.1080/00038628.2000.9696897
- Kabirifar, K., Mojtahedi, M., Wang, C., & Tam, V. W. Y. (2020). Construction and demolition waste management contributing factors coupled with reduce, reuse, and recycle strategies for effective waste management: A review. Journal of Cleaner Production, 263, 121265. doi:10.1016/j.jclepro.2020.121265
- Keys, A., Baldwin, A., & Austin, S. (2000). Designing to encourage waste minimisation in the construction industry. Republic of Ireland: CIBSE National Conference Dublin.
- Labour Market Information Portal LMIP. (2021, 18 June 2021). Regional industry data - construction. The National Skills Commision (NSC) - Australian Government. Retrieved on 27 November, 2021, from https://lmip.gov.au/.
- Langdon, D. (2009). Designing out waste: a design team guide for buildings. Banbury, OX: WRAP.
- Laovisutthichai, V., Lu, W., & Bao, Z. (2020). Design for construction waste minimization: guidelines and practice. Architectural Engineering and Design Management, 18(3), 279–298. doi:10.1080/17452007.2020.1862043.
- Li, J., Tam, V. W. Y., Zuo, J., & Zhu, J. (2015). Designers’ attitude and behaviour towards construction waste minimization by design: A study in Shenzhen, China. Resources, Conservation and Recycling, 105, 29–35. doi:10.1016/j.resconrec.2015.10.009
- Liu, Z., Osmani, M., Demian, P., & Baldwin, A. (2015). A BIM-aided construction waste minimisation framework. Automation in Construction, 59, 1–23. doi:10.1016/j.autcon.2015.07.020
- Llatas, C., & Osmani, M. (2016). Development and validation of a building design waste reduction model. Waste Management (Elmsford), 56, 318–336. doi:10.1016/j.wasman.2016.05.026
- Mohammed, M., Shafiq, N., Al-Mekhlafi, A.-B. A., Al-Fakih, A., Zawawi, N. A., Mohamed, A. M., … Al-Nini, A. (2022). Beneficial effects of 3D BIM for Pre-empting waste during the planning and design stage of building and waste reduction strategies. Sustainability, 14(6), 3410. doi:10.3390/su14063410
- Moinester, M., & Gottfried, R. (2014). Sample size estimation for correlations with pre-specified confidence interval. The Quantitative Methods for Psychology, 10(2), 124–130. doi:10.20982/tqmp.10.2.p0124
- Molnar, A. (2019). Smartriqs: A simple method allowing real-time respondent interaction in qualtrics surveys. Journal of Behavioral and Experimental Finance, 22, 161–169. doi:10.1016/j.jbef.2019.03.005
- Newaz, M. T., Davis, P., Sher, W., & Simon, L. (2020). Factors affecting construction waste management streams in Australia. International Journal of Construction Management, 22(13), 2625–2633. doi:10.1080/15623599.2020.1815122
- NSW EPA. (2012). Better practice guidelines for waste management and recycling in commercial and industrial facilities. The NSW Environment Protection Authority.
- NSW EPA. (2020). Construction and demolition waste. NSW Environment Protection Authority (EPA). www.epa.nsw.gov.au.
- NSW EPA. (2022). The waste hierarchy. NSW Environment Protection Authority. www.epa.nsw.gov.au/.
- Olanrewaju, S. D., & Ogunmakinde, O. E. (2020). Waste minimisation strategies at the design phase: Architects’ response. Waste Management, 118, 323–330. doi:10.1016/j.wasman.2020.08.045
- Osmani, M. (2013). Design waste mapping: a project life cycle approach. Proceedings of the Institution of Civil Engineers - Waste and Resource Management, 166(3), 114–127. doi:10.1680/warm.13.00013
- Osmani, M., Glass, J., & Price, A. D. (2008a). An investigation of design waste causes in construction. WIT Transactions on Ecology and the Environment, 109, 491–498. doi:10.2495/WM080501
- Osmani, M., Glass, J., & Price, A. D. F. (2008b). Architects’ perspectives on construction waste reduction by design. Waste Management (Elmsford), 28, 1147–1158. doi:10.1016/j.wasman.2007.05.011
- Osmani, M., Price, A. D. F., & Glass, J. (2005). Potential For construction waste minimisation through design. WIT Transactions on Ecology and the Environment, 84), doi:10.2495/SPD050561
- Othman, A. A. E., & Elsawaf, L. A. (2021). Design Out waste framework for achieving sustainability in public housing projects in Egypt. WSEAS Transactions on Environment and Development, 17, 222–231. doi:10.37394/232015.2021.17.22
- Pickin, J., Wardle, C., O’Farrell, K., Nyunt, P., & Donovan, S. (2020). National Waste Report 2020. (P1121). Docklands Vic: Blue Environment Pty Ltd.
- Ponte, M. C. U., Méndez-Zorrilla, A., & Ruiz, I. O. (2022). Use of LinkedIn Endoresments in Recommender Systems. Education and New Developments, 115–119. https://doi.org/10.36315/2022v1end025
- Rapanta, C., & Cantoni, L. (2017). The LinkedIn endorsement game: Why and how professionals attribute skills to others. Business and Professional Communication Quarterly, 80(4), 443–459. doi:10.1177/2329490616677044
- Riley, R. D., Ensor, J., Snell, K. I., Harrell, F. E., Martin, G. P., Reitsma, J. B., … Van Smeden, M. (2020). Calculating the sample size required for developing a clinical prediction model. BMJ, 368, 1–12. doi: 10.1136/bmj.m441
- Ringle, C. M., & Sarstedt, M. (2016). Gain more insight from your PLS-SEM results: The importance-performance map analysis. Industrial Management & Data Systems, 116(9), 1865–1886. doi: 10.1108/IMDS-10-2015-0449
- Sacks, R., Eastman, C., Lee, G., & Teicholz, P. (2018). BIM handbook: A guide to building information modeling for owners, designers, engineers, contractors, and facility managers. 3rd ed. Hoboken, NJ: John Wiley and Sons.
- Salgin, B., Cosgun, N., Ipekci, C. A., & Karadayi, T. T. (2020). Turkish Architects’ View on Construction and Demolition Waste Reduction in the Design Stage. Environmental Engineering and Management Journal, 19(3), 439–452. doi:10.30638/eemj.2020.042
- Sarstedt, M., & Cheah, J. H. (2019). Partial least squares structural equation modeling using SmartPLS: a software review. Journal of Marketing Analytics, 7, 196–202. doi:10.1057/s41270-019-00058-3
- Seneviratne, K., Rameezdeen, R., & Amaratunga, D. (2015). Contractor capacity and waste generation: An empirical investigation. Journal of Construction in Developing Countries, 20(2), 25–25.
- Shmueli, G., Sarstedt, M., Hair, J. F., Cheah, J. H., Ting, H., Vaithilingam, S., & Ringle, C. M. (2019). Predictive model assessment in PLS-SEM: guidelines for using PLSpredict. European Journal of Marketing, 53(11), 2322–2347. doi:10.1108/EJM-02-2019-0189
- Succar, B. (2009). Building information modelling framework: A research and delivery foundation for industry stakeholders. Automation in Construction, 18(3), 357–375. doi:10.1016/j.autcon.2008.10.003 .
- The Word Bank. (2018). What a waste: An updated look into the future of solid waste management. The Word Bank. Available online at: https://www.worldbank.org/en/news/immersive-story/2018/09/20/what-a-waste-an-updated-look-into-the-future-of-solid-waste-management
- Udawatta, N., Zuo, J., Chiveralls, K., Yuan, H., George, Z., & Elmualim, A. (2018). Major factors impeding the implementation of waste management in Australian construction projects. Journal of Green Building, 13(3), 101–121. doi:10.3992/1943-4618.13.3.101
- Udawatta, N., Zuo, J., Chiveralls, K., & Zillante, G. (2015). Improving waste management in construction projects: An Australian study. Resources, Conservation and Recycling, 101, 73–83. doi:10.1016/j.resconrec.2015.05.003
- Wang, J., Li, Z., & Tam, V. W. Y. (2014). Critical factors in effective construction waste minimization at the design stage: A Shenzhen case study, China. Resources, Conservation and Recycling, 82, 1–7. doi:10.1016/j.resconrec.2013.11.003
- Wang, J., Li, Z., & Tam, V. W. Y. (2015). Identifying best design strategies for construction waste minimization. Journal of Cleaner Production, 92, 237–247. doi:10.1016/j.jclepro.2014.12.076
- Wang, J., Yu, B., Tam, V. W. Y., Li, J., & Xu, X. (2019). Critical factors affecting willingness of design units towards construction waste minimization: An empirical study in Shenzhen, China. Journal of Cleaner Production, 221, 526–535. doi:10.1016/j.jclepro.2019.02.253
- Wiesen, C. (2019). Learn to use the Kaiser-Meyer-Olkin measure of sampling adequacy in SPSS with data from Lahman's baseball database (2017). SAGE Publications.
- Wong, I., Wu, Z., & Chi-Sun, P. (2021). Strategies for effective waste reduction and management of building construction projects in highly urbanized cities—A case study of Hong Kong. Buildings, 11(5), 214. doi:10.3390/buildings11050214
- Xu, J., & Lu, W. (2019). Design for construction waste management. In Konstantinos Papadikis, Chee S. Chin, Isaac Galobardes, Guobin Gong, & Fangyu Guo (Eds.), Sustainable buildings and structures: Building a sustainable tomorrow (pp. 271–276). Suzhou, China: CRC Press.
- Yang, H., Xia, J., Thompson, J. R., & Flower, R. J. (2017). Urban construction and demolition waste and landfill failure in Shenzhen, China. Waste Management, 63, 393–396. doi:10.1016/j.wasman.2017.01.026