
ABSTRACT
The current state of research and development into the additive manufacturing of concrete is poised to become a disruptive technology in the construction industry. Although many academic and industrial institutions have successfully realised full-scale structures, the limitations in the current codes of practice to evaluate their structural integrity have resulted in most of these structures still not being certified as safe for public utilisation and thus deemed as test prototypes for display purpose only. To realise a 3D concrete printed (3DCP) structure which could be certified safe for public use, a bridge was realised using the print facility of the Eindhoven University of Technology (TU/e) based on the concept of ‘Design by Testing’. This paper holistically discusses the complications encountered while realising a reinforced 3DCP bridge in a public traffic network and decisions taken to find solutions for overcoming them.
Introduction
The built environment worldwide is facing major challenges for the decades ahead. A global migration towards cities, energy transition, smart mobility, a growing lack of natural resources, climate change, an ageing population and rapidly changing urban economies from industry and services towards knowledge and creativity are just examples of issue matters that will have an impact on our buildings and infrastructure. This includes both new cities as well as urban transformations. The pace of the developments puts a pressure on the building industry to innovate and ensure that the construction productivity meets the new demand, costs are in control and all are in a sustainable manner.
The digital disruption that already has affected most industries could easily become a game changer to meet future demands in the building and civil industry as well. Design skills and workmanship become rapidly supported by data-driven algorithms, and the design information is getting stored systematically in Building Information Models. The digital storage obviously enhances the collaboration among the many design disciplines and reduces costs of failure. However, the use of the same design data for the actual construction, without human intervention, is of more recent date and is still in a process of becoming matured.
A promising development from this perspective is a global shift from in situ construction towards Design for Manufacturing and Assembling. The controlled environment of a precast factory simplifies automation such as the use of robots. A next step is not to pour concrete but instead apply additive manufacturing techniques and print concrete to be safe on natural resources and decrease weight. In addition, 3D Concrete Printing (3DCP) offers the benefit of mass customisation.
The technology of 3DCP was introduced about two decades ago (Khoshnevis and Dutton Citation1998, Khoshnevis, Citation2004, Khoshnevis et al. Citation2001, Citation2006). Ever since, groundbreaking projects and case studies are being presented on a regular basis to showcase the potential of digital fabrication with concrete. On a trial-and-error basis, the frontiers of the new technology are rapidly being explored, including buildings (3ders Citation2015, Citation2016, Citation2017a, Citation2017b, Citation2017c, Cnet Citation2016, Mediaoffice Citation2016, cementonline Citation2017, De Ingenieur Citation2017). This paper is an elaboration of Salet et al. (Citation2018) and extensively describes the design, manufacturing and assembling of a 3D Printed Concrete bridge.
Despite the capability to actually print concrete, the design and manufacturing of a bridge was a challenge on its own for more than one reason. In the first place, codes to test the structural properties of printed concrete are not available yet. The NEN-EN-206-1 tests vibrated concrete in cylinders and are not suitable for printed material that cannot be vibrated. This issue has been overcome by performing material tests on printed concrete. Structural calculations have been made of the bridge, based on these tested materials properties, using existing codes (NEN-EN-1992-1-1) on prestressing. However, the application of these codes on printed concrete structures has not been validated yet. To overcome this issue, a scale model of the bridge was tested structurally in the laboratory to prove on safety and compliance with the codes. Finally, the actual bridge was tested on-site again prior to opening for public usage last year on the load-bearing capacity. This final test was done to exclude any failure during the production since the print process is not certified yet. In addition to these structural tests, various other tests have been performed to find the best print strategy and the best possible way to assemble the printed elements. All of these tests meant that the design of this bridge can be best described as learning on the job and is referred to as design by testing.
Specifications and conceptual design
The bridge is part of the renewal of an existing bicycle track named Lieve Vrouwensteeg in the village Gemert in the Netherlands. It crosses a small local canal called the Peelse Loop. The span of the bridge is 6.5 m and the width 3.5 m. The uniformly distributed design load (qEd) is 5.0 kN/m2. The realisation of the printed bridge was treated as a living lab within the overall project, involving the triple helix of government, industry and a knowledge institute (Eindhoven University of Technology, TU/e) from the start.
The bridge has been designed, starting with the capabilities of the 3D concrete printer at TU/e in mind. The facility has been described by Bos et al. (Citation2016). Despite the fact that the full bridge coincidentally fits in the current print box, it was decided not to print it in one piece from the bottom to the top of the deck, but instead in multiple elements that need to be assembled. The reason is to benefit from the printer to optimise the cross-section of the bridge. The bridge consists of printed elements that are rotated 90° after printing, and then pressed together by post-tensioned prestressing tendons. This allows for an optimised section design composed out of splines. (a,b) illustrates the design concept.
Figure 1. (a, b) 3DCP bicycle bridge conceptual design (illustration by BAM).
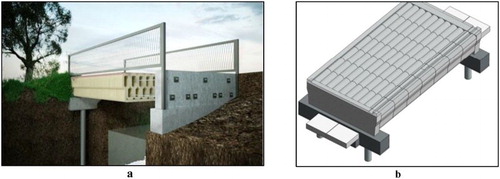
Once ready, an element is released from the print bed and flipped into its final orientation. This means that the height of the printed element is related to the span of the bridge and the printer. The printer is capable to print 2.8-m-high elements, meaning at least three elements need to be printed and assembled to achieve the 6.5 m span.
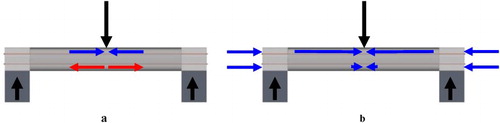
The need to print and stack several single elements with a hollow core by itself makes it self-evident to prestress the components to overcome the lack of bending moment resistant of unreinforced concrete, a technology commonly used in the construction industry. So, prestress tendons are placed in the openings of the printed elements, stressed, anchored at the beginning and the end, and finally released. The printed concrete elements are stressed to a level that only compression remains in the section, and no additional passive reinforcement in that direction is required. The main advantage of this approach is that the lack of tensile strength of concrete is overcome, without a need of reinforcement. Furthermore, the uncertainty with regard to the tensile capacity of the printed concrete with all its interfaces, which has been shown by several researchers to depend on the interface interval time and may be less than the bulk material tensile strength (Le et al., Citation2012, Zareiyan & Khoshnevis Citation2017, Panda et al. Citation2018), becomes irrelevant. The full cross-section is stressed in compression only at the design load. The principle is illustrated in .
Figure 2. Principle of prestress applied to a structure loaded in bending. (a): no prestress, only bending; (b): prestress and bending: the tensile stress in the bottom of the structure is eliminated.
It is noted that, even with concrete as a material, it is possible to print some cantilevering and realise a unique shape and some surface texture. However, the cantilevering is limited due to the nature of the material that will harden only after about 2 hours after deposition. The limits can be stretched by applying a fast hardening type of concrete. However, this has been disregarded in this project. The focus was to realise a structurally safe bridge. The architectural design can certainly be improved in the future. For the same reason, it was decided not to integrate a parapet in the printed bridge part yet.
The cross-section of the bridge elements consists of a series of connected bottle shapes, alternatively positioned upside down, in combination with a continuous connecting straight line at the bottom. This shape provides a sufficient amount of deposited material to resist both the bending moment and the shear force. At the front and at the end of the printed bridge deck elements, two solid concrete bulkheads are added to introduce the prestress forces. These have been traditionally cast and reinforced to overcome the spitting tensile forces that are typical for the local anchoring of the prestress tendons. The bridge rests, with the two bulkheads, on two traditional abutments with a pile foundation due to the soft soil conditions. The steel parapet spans the full length of the bridge and is supported, independently from the printed bridge, on the foundation.
Materials testing
To be able to develop the conceptual design into a final design, the (structural) material properties of the applied print mortar Weber 3D 115-1, globally described by Bos et al. (Citation2016) (and since been given its trade name), had to be established. Obviously, this custom designed material does not comply with standard concrete designations (C30/37, etc.). Extensive published and unpublished research were therefore carried out by the TU/e and the material supplier into compressive, flexural and uniaxial tensile strength, modulus of elasticity, density and directional dependency (Doomen, Citation2016, Slager, Citation2017).
In view of the prestress force, the compressive strength was particularly important for this project, since the bending moment resistance (MRd) is ruled by the prestress force. To resist the external shear force, the shear resistance of the concrete cross-section (VRd,c) needs to be known. The design features embedded reinforcement cables (see further discussion below) that might act as stirrups, but their presence is not considered in the shear resistance yet, as their performance in terms of shear resistance has not been established. The shear strength of the concrete is not determined in a direct shear test, but instead derived from the tensile and compression strength, based on a Mohr–Coulomb failure criterion.
It is noticed that the strength of printed concrete, different from poured concrete, might differ based on the test direction compared to the print direction. In view of this, tests have been performed in three independently perpendicular directions.
Apart from the strength, also the stiffness of the concrete must be known. The structure shortens under prestress, which results in prestress loss. The amount of shortening depends on the stiffness of the section, and thus on the section area and modulus of elasticity. The lower the stiffness, the more initial prestress is needed to actually achieve the required final prestress level in the concrete. However, the short-term stiffness is not enough. Concrete, like many other materials, creeps under a permanent load and also shrinks due to drying. This is expected to be more than normal concrete because of a lack of coarse aggregates due to limitations of the rotor stator pump that is used. Shrinkage and creep gradually reduce the prestress load over time and must therefore be known and compensated for. The material properties applied to the structural design of the bridge are summarised in .
Table 1. Structural properties of Weber 3D 115-1 print mortar, as used in the structural design of the bridge.
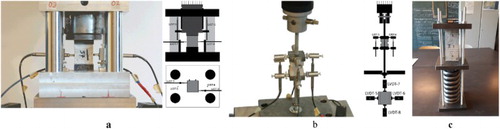
The compressive strength and modulus of elasticity have been determined by subjecting 40 × 40 × 40 mm printed cubes consisting of four layers of 40 × 10 mm to a displacement-controlled compression test based on the EN 196 series, in three different directions ((a)). The tensile strength was determined in a hinged set-up shown in (b). The test was performed on 40 × 40 × 40 mm printed cubes in three directions, similar to those used for the compression tests. However, a 6-mm radius notch was applied on two opposing sides to ensure failure in the middle of the specimen, which for the w-direction corresponds with the layer interface. Creep and shrinkage, finally, were determined by subjecting printed samples to a constant load of approximately 30–35% of the compressive strength for 90 days ((c)) and comparing them to the deformation in unloaded samples. The former records the deformation caused by creep and shrinkage combined, while the latter only records deformation from shrinkage. The creep factor can be determined from the difference between both. A spring was used to apply the load to the samples which were stored in a climate-controlled chamber. The load was applied at a concrete age of 14 days to correspond with the expected age of application of the prestress on the bridge elements. The deformation was regularly measured along four sides of the test samples and averaged to determine the creep and shrinkage deformation.
Figure 3. Test set-up of a compression test (a), a direct tensile test (b) and a creep/shrinkage test (c) used to determine structural properties of the print mortar.
Final design
The final cross-section of the bridge is 3440 × 920 mm. Structural calculations showed a need for sufficient shear capacity due to the relatively low (tensile) strength of the concrete that was used. This resulted in a typical design of the cross-section as shown in (a,b). The design in (a) was used for the 1:2 scale test on the bridge (discussed below). (b) shows the final design, which was an optimised version of the design used for the test as it (relatively) reduced the print path length (and thus the printing time and material use) by about 4%.
Figure 4. Print paths of the 1:2 scale model for testing (a) and the actual bridge section (b). The optimised pattern of the latter with regard to the former saves 4% of print path length.
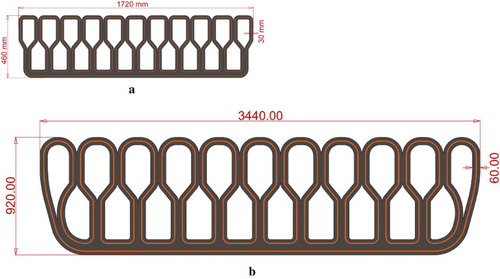
The cross-section exists of a (curved) top and (straight) bottom flange that combined with the prestress force provides the bending moment resistance. In between the flanges is a bottle-shaped type of pattern to take care of the shear force. The concrete filament width in this design is 60 mm. The standard TU/e 3DCP system operates with a downward printing 10 × 40 mm2 nozzle opening, but for this project, a specific nozzle was custom designed (see further discussion below). In the scaled element, yet another size was used, namely of 30 mm filament. These differences could be achieved by changing the nozzle, print speed and pump pressure in the print system. It requires some trial-and-error testing to obtain the correct settings for each case.
The height of each element is approximately 1.08 m, or 89–90 layers of 12 mm. This results in six elements to compose the bridge. The element height was limited due to handling and transportation requirements. The elements could not exceed the lifting capacity of the crane in the laboratory (5 tons) to remove the elements from the print bed. In total, the bridge features 535 printed layers, with a length of 25.1 m each, and a total print path length of 13.4 km.
The prestress is applied by post-tensioning 16 Dywidag-system tendons to an initial load P0 of 150 kN. The prestress load has been determined so that the entire section will always remain in compression under the design load, even in the ultimate limit state. The centre of gravity of the tendons is slightly below the centre of gravity of the concrete section to compensate for effects of the self-weight. The tendons can be tensioned again in the future, if creep and shrinkage exceed the considered values. Thus, the required level of prestress can always be maintained.
The final design was structurally calculated in more detail by means of finite element analysis ((a,b)). From the analysis, it was noticed that the bridge has a relatively large width to span ratio of about 1:2. This ratio makes the bridge sensitive for torsion that can occur if the two abutments are not fully aligned with the bridge itself, e.g. due to settlements. To avoid brittle failure in that case, an automatically entrained reinforcement cable was introduced in the filament. To limit the required cable length, only specific sections of the elements were reinforced (). This way, these sections act similar to shear reinforcement stirrups used in conventional structural concrete.
Figure 5. Finite element analysis of the 3DCP bicycle bridge: stress distribution under variable load (a) and under prestress load (b) (illustrations provided by Witteveen+Bos).
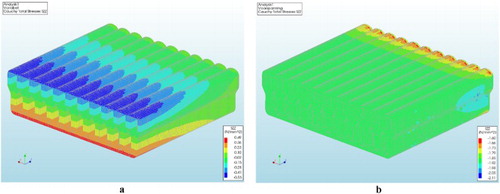
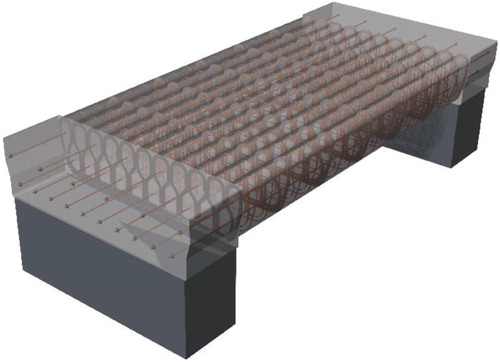
Figure 6. Positioning of prestress tendons and reinforcement cable in the bridge.
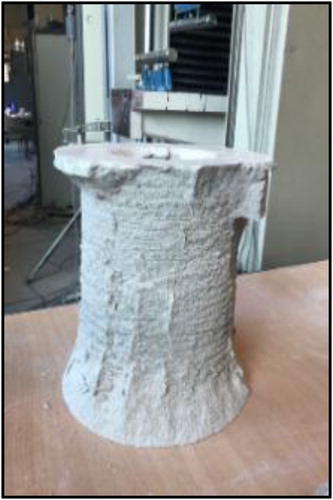
The reinforcement consists of a thin, high-strength steel cable that becomes embedded in the concrete filaments during printing with the Reinforcement Embedding Device ((a,b)) developed at TU/e. This concept has been described by Bos et al. (Citation2017a, Citation2017b). Apart from acting as a reinforcement, the wire also serves a confinement, as demonstrated in . The figure shows a small cylinder that is printed in concrete with the embedded wire. The cylinder has been stressed in compression in the (vertical) axis, perpendicular to the filaments, like the situation at the prestressed bridge. As shown, the concrete from the cover eventually spalls off, but the concrete at the inside the reinforcement still remains one solid piece due to the continuous wire. The wire prestresses the element in compression transverse to the load due to the restrained lateral deformation.
Figure 7. (a, b) Reinforcement Entraining Device, developed by the TU/e.
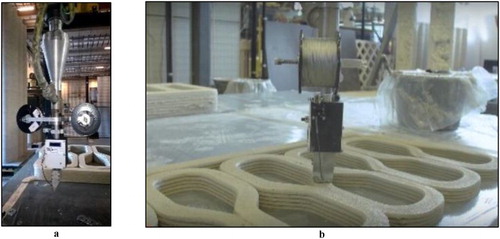
Figure 8. Confinement of failed printed concrete column with cable reinforcement.
Printing
Print path
In the original design, on which the 1:2 scale test was based, the overall length of the print path for each layer was 26.0 m. For the final production design, the path length was optimised to 25.1 m (). The advantage of the design is that the print path could be programmed in such a manner that the start and the end locations of each layer are at the same position. The printing of the bridge is shown in .
Figure 9. (a, b, c) Printing of an element for the actual bridge.
Nozzle shape and concrete flow direction
The type of nozzle for the project was not self-evident and studied upfront. A down-flow nozzle ((a,d)) is commonly used for printing concrete. But for this project, the nozzle had to be adjusted to embed the reinforcement cable. Initially, a cable was introduced in a down-flow printing nozzle. However, in this set-up, the cable cuts the concrete filament in two during printing, resulting in a poor bond between the concrete and cable.
Figure 10. Nozzle design and concrete flow. When a down-flow printing nozzle (a, d) is equipped with a reinforcement cable, the filament is cut and the cable–concrete bond is poor. This may be solved with a back-flow nozzle (b, e). However, an improper design of the geometry at the nozzle mouth can have a disastrous effect on the interface bond between concrete layers. An improved hybrid down/back-flow nozzle design (c, f) solves this issue
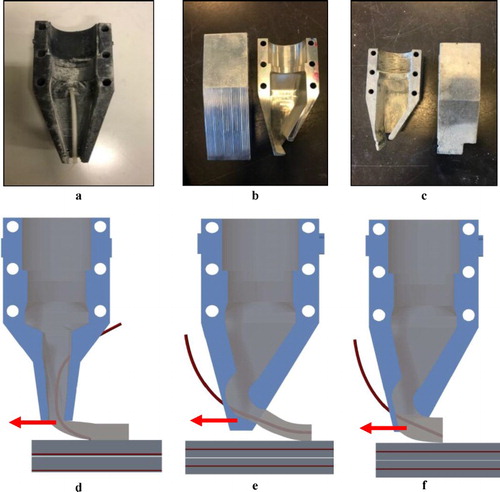
Therefore, a back-flow nozzle was developed ((b,e)). The cable wire is again from the front and joins the concrete that is coming from the top. The filament of concrete with the cable leaves the nozzle from the back. The back-flow nozzle allows for the entrainment of the cable into the printed layer and does not split the layer into two. The back-flow concrete deposition helps with the cable placement as the angle of concrete flow and the movement of the cable direction are the same.
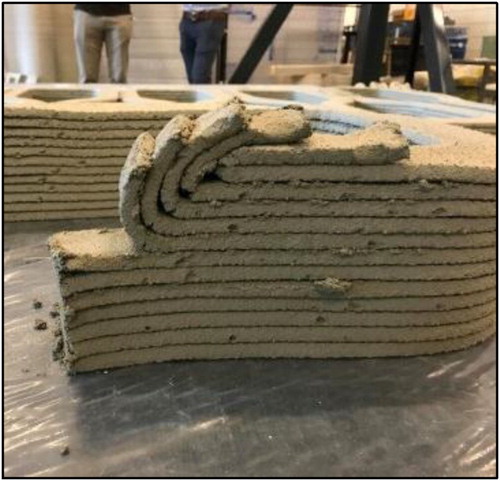
However, it was discovered that an improper design of a back-flow nozzle can have a disastrous effect on the interface bond between the filament layers, due to the concrete being placed without any fluidic pressure. illustrates that the bond between the layers placed by the back-flow nozzle is so poor that the layers can be lifted from each other effortlessly. In addition, the side walls of the back-flow nozzle take material away from the adjacent printed layer and hence the bond between the adjacent in the x–y plane is also poor.
Figure 11. Bad layer adhesion resulting from the use of the print head from Figure (b).
This anomaly was corrected by making a hybrid of the down-flow and back-flow nozzle, where the bottom surface of the back-flow nozzle was removed making it a down-flow nozzle, which improved the bond between two consecutively placed layers in the z-axis ((c,f)). However, the front wall surface of the back-flow nozzle was kept intact for placing the reinforcement tube through which the reinforcement cable was entrained into the printed layer. Also, to improve the bond between two layers in the x–y plane, the edge of the front surface of the nozzle was removed so that the material from the already printed layer is not removed while printing the adjacent layer.
Filament size, pump pressure and print speed
For this project, a print nozzle with a mouth opening larger than that of the standard TU/e set-up was used. To achieve a print filament of proper consistency, the filament section size, print speed, and pump pressure (and related material flow) need to be attuned carefully, as they are directly related. It was decided to maintain the pump pressure that is normally used as changing it would influence several parameters of which the influence is difficult to oversee, such as the material rheology and internal friction of the system. The pump pressure is controlled by the pump motor frequency, which was set at 150 rpm. The default print speed of the TU/e set-up is 100 mm/s. In order to obtain a comparable filament consistency, the speed was reduced by 20% in this project to 80 mm/s. Even though this meant a significant increase of printing time, this was preferred to altering the pump pressure.
Further consideration is needed to be given to the radii of the curves (Ahmed et al., Citation2016). Depending on the sharpness of the curve, the print speed decreases temporarily owing to the robot kinematics. But if the pump speed remains constant, the material gets unevenly distributed: more material is deposited at the angles, resulting in inconsistent layer dimensions. Furthermore, in any corner, more concrete is deposited in the inside of the corner than on the outside due to the difference in path length. This causes a difference in the vertical height (z-direction) of the filaments and eventually may cause a failure of the object during printing. This limitation has been investigated experimentally in the past and has been used as design rules for the bridge. Also, smoothing the curvature of the angles eradicated the issue of varying filament dimensions.
Finally, a single layer took around 5 minutes and 20 seconds to print; it took 48 hours to complete printing of all the bridge elements. Two full wet systems, including two mixing devices and pumps, were used in the project. Each system was used for about 2 hours before a switch was made to the other system to continue printing within minutes, so that dry joints could be avoided. The duration of 2 hours is based on the open time of about 3 hours of the concrete. After that time period, the materials inside the hose and parts of the pump start hardening. This results in increasing the temperature and print pressure which affect the quality of the printed filaments and in extreme cases can lead to pump failure. Changing and cleaning the wet system avoided pieces of hardening concrete damaging the system or decreasing the print material quality.
Destructive 1:2 scale test
One could argue if only the testing of the printed concrete material satisfies the needs to be in compliance with structural codes, since the prestress part is not different from the poured concrete. However, since this is the first time a concrete bridge was constructed this way, it was decided to realise a 1:2 scale model and test the overall structural performance to prove the structural integrity. The assembly of the scale model is shown in (a–c).
Figure 12. (a, b, c) Assembly of 1:2 scale model of the bridge for destructive 4-point bending.
The dimensions of the printed elements were scaled down to half the design size: i.e. 1720 mm in width, 500 mm in length and 460 mm in height. To achieve that the dimensions of the printed filaments were also scaled down in width, the nozzle dimension was scaled down to 30 mm wide. However, the height of the nozzle was kept the same, and the number of layers for each element was adjusted accordingly.
The scaled bridge was loaded with three tendons Dywidag tendons (Ø15.7 mm, Y1860 steel grade) top and six tendons of the same type at the bottom. The tendons were stressed to a load of an initial load P0 = 120 kN. One tendon at both the top and the bottom were attached to a load cell, to allow the monitoring of the prestress forces. After wedge setting and elastic deformation (immediate losses), they recorded a prestress load P = 99.9 kN at the top and P = 87.4 kN at the bottom (see ).
Table 2. Prestress loss due to creep and shrinkage, and axial deformation due to prestress load.
Besides, the elongation of the bridge was measured during and prestressing (). The expected instantaneous deformation expected due to the prestress force was 0.5 mm, while 0.9 mm was measured. The difference is attributed to setting in the joints between the bulkheads and the elements. The prestress force reduces over time, but the pace of the force reduction is slowing down rapidly due to the fast shrinkage that is explained by the nature of the printed concrete and the small dimensions of the filaments. The prestress force is reduced by 4% after 2 weeks of prestressing. Thereafter, the bridge was tested on the load-bearing capacity.
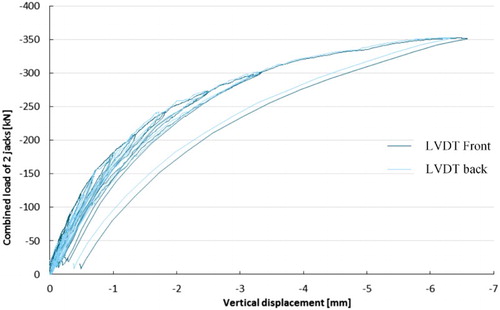
The bridge was tested in a load-controlled four-point bending test, as shown in . The load span was one-third of the support span. The load was applied by two hydraulic jacks (one for each load point), in steps of 30 kN/min (15 kN/min per jack). An alternating loading–unloading sequence was applied from 120 kN onwards, for each 30 kN of additional load, i.e. the load was released at 120 kN, then the scale model was reloaded to 150 kN, released, reloaded to 180 kN, and so forth, until 300 kN, after which the bridge was loaded a final time to 350 kN and the test was discontinued. The load-displacement curve is shown in .
Figure 13. Scale model in test 4-point bending test set-up.
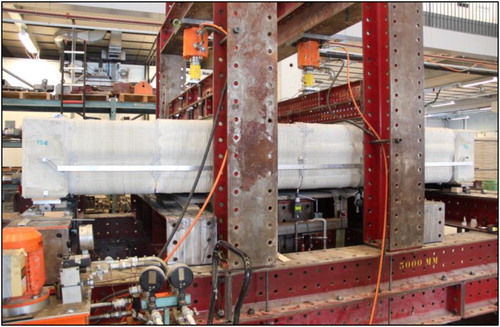
Figure 14. Load-displacement curve of the 4-point bending test on 1:2 scale model, measured through linear variable differential transformers (LVDTs).
Prior to the test, the pass/fail criteria were set. Considering design bending moments and shear loads, it was determined that the scale model should be able to carry at least 176 kN (88 kN per jack). The crack moment, flexural shear failure or diagonal tensional shear failure were expected not to occur before 213, 210 and 454 kN, respectively – although considerable statistical variations could lead to deviatory results in this specific model.
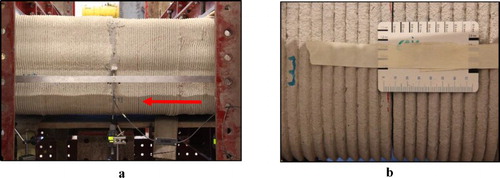
The loading–unloading sequence allows to evaluate whether damage has occurred in the model. In structural terms, damage, as caused by cracks, for instance, is shown by a reduced stiffness and a permanent deformation. In a loading–unloading sequence, this translates into an unloading curve that does not return to zero displacement and a reloading curve that is less steep than the previous load curve. The test showed no damage occurred until 240 kN load. A permanent deformation and loss of stiffness were only found at the unloading and reloading at 270 and 300 kN, respectively. The first visually noticeable crack appeared between the load points, at approximately 300 kN loading (). Initially, it runs vertically along one of the interfaces between the filaments. Later, it diverges horizontally through the printed mass. The location of the crack indicates that it is induced by bending. This is a desired failure mechanism, as it is more ductile than shear failure.
Figure 15. (a, b) Bending crack, becoming visible at 300 kN total load.
When comparing the results to the set requirements, it should be noted that the first signs of damage occur well above the minimum required capacity (>240 kN versus 170 kN), and between 10% and 20% above the calculated crack or failure loads. Visible cracking occurred at a significantly higher load, and final failure was not observed. As the scale model carried the required load with a large margin and the failure behaviour was shown to be bending-induced, the test was stopped.
Assembly and in situ test
Assembly
The assembly process of the printed elements was studied simultaneously along with the printing research and structural research. This was done in two phases. The initial phase involved the research on the interface material, defining tolerance between interface material and printed elements, and studying the concept of prestressing for printed elements. The second phase involved working on a mock-up drill for the assembly process on the 1:2 scale bridge, which involved defining protocols for logistics of lifting of printed elements, checking alignment tolerances while assembling all the six elements and defining requirements for the bulkhead for the prestressing cables.
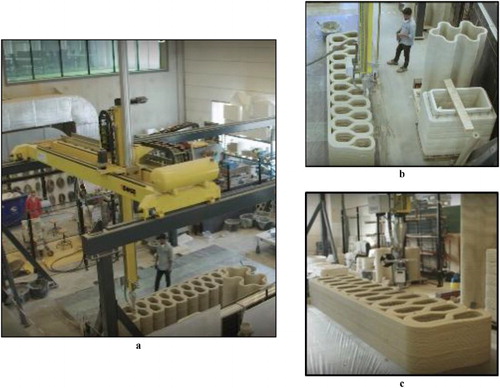
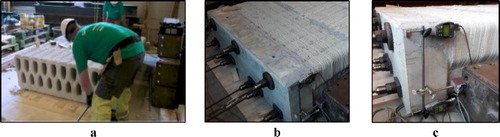
For the initial assembly phase, a conceptual cross-sectional geometry of the bridge was printed in a 1:1 scale, with the 60 mm filament geometry. A sequential mock-up of the entire process from lifting the elements from print bed to assembly was done, as shown in (a–f).
Figure 16. (a–f) Assembly study, showing the sequential process from lifting of an element to final prestressing.
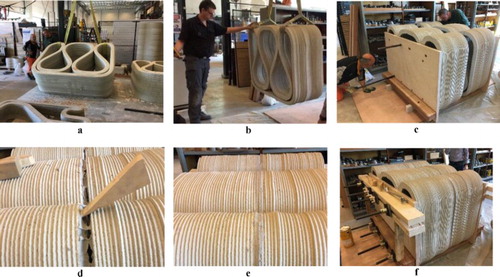
(a) shows the lifting of the printed element from the print bed using a gantry crane in the structural laboratory at TU/e and flipping the element 90° and placing it in a temporary wooden scaffold and aligning the two elements with minimum deviation, as shown in (b,c). Before completely merging the elements, a synthetic epoxy-based interface material was applied on the cross-section as a binding material ((d)). The reason for applying the interface material is to smoothen the surface of the cross-section. Otherwise when prestressed, the printed surface of the cross-section being not completely smooth may have local peek stresses ((e)). Finally, (c,f) shows the makeshift bulkhead for applying prestressing with steel cables. The study concluded with recommendations on improving the process for lifting elements from the print bed, proving the strategy of placing of elements in a secondary wooden scaffold, understanding the thickness of the interface material after prestressing, which should be taken into account for fixing the length of each element and finally of the design requirements.
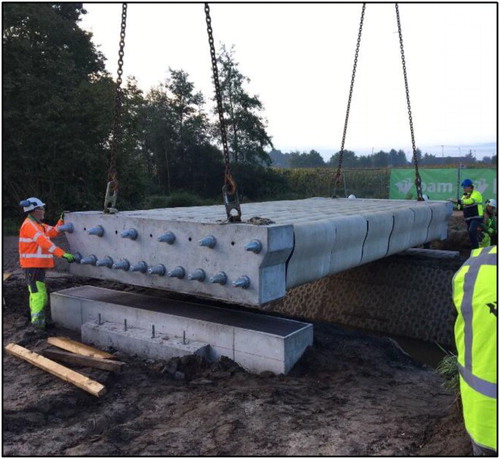
The final assembly of the printed elements was based on the research conclusions of the first two phases and is shown in (a,b); in , the bridge is hoisted into place.
Figure 17. (a, b) On-site assembly and prestressing.
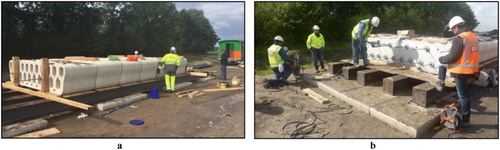
Figure 18. Hoisting the bridge into position.
In situ test
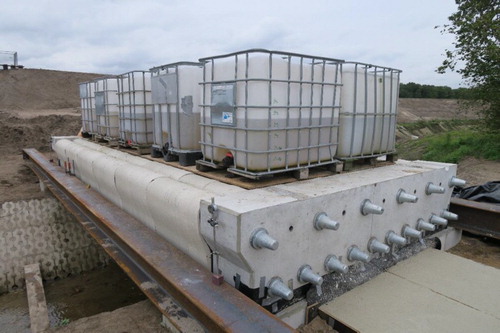
A final full-scale test was performed in situ to guarantee the bridge to behave as expected and be structurally safe. Tests like this are obviously non-destructive and are used on a regular basis to verify the load-bearing capacity of older and existing infrastructure.
As shown in , the bridge was loaded with 10 containers filled with 500 litres of water. Including their self-weight, this resulted in a total load of 57 kN on the bridge. The containers were positioned in a pattern such that 100% of serviceability limit state bending moment was reached. The resulting deflections were too small to measure. As also no other response was observed, and in consideration of the previous material and scale testing, the bridge was considered to comply with the Dutch building regulations.
Figure 19. In situ testing of the bridge with water-filled containers.
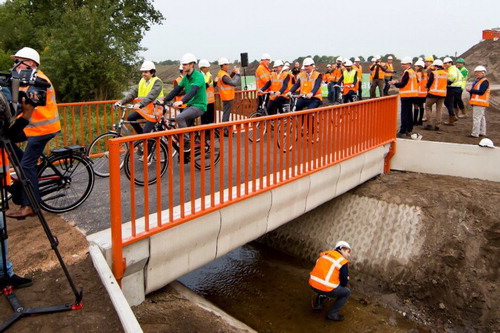
A concrete surface finishing was applied at the top of the bridge, and the parapet was mounted at the abutments to finish the bridge. On 17 October 2017, it was opened to the public ().
Figure 20. Completed bridge at the opening (photo: Kuppens fotografie).
Conclusion
A 3DCP bicycle bridge was presented. It was printed at the TU/e 3DCP facility and was the first of its kind (prestressed, fused depositioning modelling printed) worldwide to be put into service. It also includes the innovative use of cable reinforcement in the print filament.
The process of design, printing and assembly and their interaction was discussed. A thorough testing procedure was followed both for the structural and the construction aspects. Assembly trials were performed to identify potential problems and hazards. Material testing, destructive scale model testing and in situ testing was performed to show that the bridge complies with Dutch building regulations. The bridge was opened in October 2017 and now forms part of the cycling infrastructure around Gemert, Netherlands.
Acknowledgements
The following partners were involved in the 3DCP bicycle bridge in Gemert:
- Client: Province Noord-Brabant, Netherlands;
- General contractor, initiator: BAM Infra, Netherlands;
- Structural design and engineering: Witteveen+Bos consulting engineers, Netherlands;
- Research, print design and manufacturing of printed elements: Eindhoven University of Technology, Netherlands;
- Material supplier print mortar: Saint-Gobain Weber Beamix, Netherlands;
- Prestress system and application: Dywidag, Netherlands;
- Reinforcement cable supplier: Bekaert N, Belgium.
Disclosure statement
No potential conflict of interest was reported by the authors.
ORCID
Freek P. Bos http://orcid.org/0000-0002-6666-2395
Additional information
Notes on contributors
Theo A. M. Salet
Theo is full professor of Concrete Structures at the Eindhoven University of Technology. Furthermore, he is senior partner with Witteveen+Bos consulting engineers. The main focus of his research is 3D printing of sustainable concrete structures. Among others, he develops new types of printable concretes, from structural point of view, by using advanced finite element tools at a heterogeneous level (Numerical Concrete).
Zeeshan Y. Ahmed
Zeeshan obtained his MSc degree from UCL The Bartlett. He is a PhD candidate in the chair of Concrete Structures at the Eindhoven University of Technology. His project evolves around the development of a generic approach to 3D Concrete Printing.
Freek P. Bos
Freek P. Bos as assistant professor of Concrete Structures at the Eindhoven University of Technology, Freek focuses his research on the development of reinforcement methods for 3D printed concrete. He obtained his PhD from the Delft University of Technology.
Hans L. M. Laagland
Hans is a senior structural engineer at Witteveen+Bos consulting engineers, where he heads the Structural Engineering group in the Buildings department. He has over 25 years of experience on a wide variety of projects.
Notes
* Chua, C.K., Yeong, W.Y., Tan, M.J., Liu, E.J., and Tor, S.B., eds. 3rd International Conference on Progress in Additive Manufacturing (Pro-AM 2018), 14–17 May 2018, Singapore.
References
- 3ders, 2015. Available from: http://www.3ders.org/articles/20150909-lewis-grand-hotel-andrey-rudenko-todevelop-worlds-first-3d-printed-hotel.html [Accessed 26 September 2017].
- 3ders, 2016. Available from: http://www.3ders.org/articles/20161214-spain-unveils-worlds-first-3d-printedpedestrian-bridge-made-of-concrete.html [Accessed 26 September 2017].
- 3ders, 2017a. Available from: http://www.3ders.org/articles/20170602-cybe-construction-completes-3dprinting-of-168-sq-m-rdrone-laboratory-in-dubai.htm [Accessed 26 September 2017].
- 3ders, 2017b. Available from: http://www.3ders.org/articles/20170213-3d-printing-construction-company-apiscor-prints-37-m2-house-near-moscow-plans-global-expansion.html [Accessed 26 September 2017].
- 3ders, 2017c. Available from: http://www.3ders.org/articles/20170907-3d-printed-concrete-office-hotel-comingto-copenhagen.html [Accessed 24 September 2017].
- Ahmed, Z.Y., et al., 2016. Design considerations due to scale effects in 3D concrete printing. Proceedings of 8th International Conference of the Arab Society for Computer Aided Architectural Design ASCAAD 2016. London, United Kingdom.
- Bos, F., et al., 2016. Additive manufacturing of concrete in construction: potentials and challenges of 3D concrete printing. Virtual and Physical Prototyping, 11, 209–225. doi:10.1080/17452759.2016.1209867.
- Bos, F.P., et al., 2017a. 3D printing concrete with reinforcement. In: M. Luković and D.A. Hordijk, eds. High tech concrete: where technology and engineering meet. Cham: Springer International Publishing, 2484–2493. doi:10.1007/978-3-319-59471-2_283.
- Bos, F.P., et al., 2017b. Experimental exploration of metal cable as reinforcement in 3D printed concrete. Materials, 10, 1314. doi:10.3390/ma10111314.
- Cementonline, 2017. Available from: https://www.cementonline.nl/proefstuk-eerste-3d-geprinte-autobrugsterker-dan-verwacht [Accessed 24 September 2017].
- Cnet, 2016. Available from: http://www.cnet.com/news/dubai-unveils-worlds-first-3d-printed-office-building [Accessed January 2016].
- De Ingenieur, 2017. Available from: https://www.deingenieur.nl/artikel/betonnen-fietsbrug-uit-de-printer [Accessed 26 September 2017].
- Doomen, C.C.M., 2016. The effect of layered manufacturing on the strength properties of printable concrete. Graduation Thesis. Eindhoven: TU/e.
- Khoshnevis, B. and Dutton R., 1998. Innovative rapid prototyping process makes large sized, smooth surfaced complex shapes in a wide variety of materials. Materials Technology, 13, 53–56. doi: 10.1080/10667857.1998.11752766
- Khoshnevis, B., 2004. Automated construction by contour crafting-related robotics and information technologies. Automation in Construction, 13, 5–19. doi: 10.1016/j.autcon.2003.08.012
- Khoshnevis, B., et al., 2001. Crafting large prototypes. IEEE Robotics & Automation Magazine, 8 (3), 33–42. doi: 10.1109/100.956812
- Khoshnevis, B., et al., 2006. Mega-scale fabrication by contour crafting. International Journal of Industrial and Systems Engineering, 1 (3), 301–320. doi: 10.1504/IJISE.2006.009791
- Le, T., et al., 2012. Hardened properties of high-performance printing concrete. Cement and Concrete Research, 42, 558–566. doi: 10.1016/j.cemconres.2011.12.003
- Mediaoffice, 2016. Available from: http://mediaoffice.ae/en/media-center/news/23/5/2016/3d-printed-officebuilding.aspx [Accessed January 2016].
- Panda, B., et al., 2018. Measurement of tensile bond strength of 3D printed geopolymer mortar. Measurement, 113, 108–116. doi: 10.1016/j.measurement.2017.08.051
- Salet, T.A.M., et al., 2018. 3D printed concrete bridge. 3rd International Conference on Progress in Additive Manufacturing Pro-AM 2018, 14–17 May 2018. Singapore.
- Slager, G.J., 2017. Influence of the Interface between Layers on the Tensile Properties of 3D-Printed Concrete. Graduation Thesis A-2017.194. Eindhoven: TU/e.
- Zareiyan, B., and Khoshnevis, B., 2017. Interlayer adhesion and strength of structures in contour crafting – effects of aggregate size, extrusion rate, and layer thickness. Automation in Construction, 81, 112–121. doi: 10.1016/j.autcon.2017.06.013