
 ?Mathematical formulae have been encoded as MathML and are displayed in this HTML version using MathJax in order to improve their display. Uncheck the box to turn MathJax off. This feature requires Javascript. Click on a formula to zoom.
ABSTRACT
Selective laser Melting (SLM), a powder bed-based additive manufacturing technology, has been developed and applied in multiple industrial fields in the last decade. However, the distortion and swelling in the SLM process resulting from thermal stress cannot be predicted subject to measurement. In this work, an in situ distortion measurement system applied to the SLM process is presented. The distortion behaviour of component under laser scanning can be precisely recorded in real-time by this system. The detailed evolution and driving force of specimen distortion in the SLM process are discussed based on the experimental results. The distortion in single laser scanning presents a strong instantaneous upward motion of the central section during laser heating and a relatively slow downward recovery motion of the central section during cooling. The distortion behaviour of the sample with and without a layer of metal powder are compared, and laser scanning on the bare sample surface leads to a significantly higher residual distortion. The influence of SLM parameter variables (such as scanning speed, laser power, scanning width, layer thickness and scanning times) on SLM distortion is also analysed. At last, the stress distribution of laser melting is verified by the high-resolution EBSD analysis.
1. Introduction
Selective laser melting (SLM), as the most widely used metal additive manufacturing (AM) technology, is a powder-bed laser fusion process to build complex, customised three-dimensional parts (Gao et al. Citation2020; Martin, Yahata, and Hundley Citation2017; Hai et al. Citation2018). Nowadays, the AM system supplier and AM industry practitioners are committed to developing new apparatus for large-scale production parts to satisfy the evolving demand in the aerospace and automotive industries. The latest commercial SLM system is equipped with multi-laser scanning unit and high-power laser in order to enlarge the building area and produce high quality components (Wen et al. Citation2014; Wei et al. Citation2019; Spears and Gold Citation2016).
During the SLM process, the powder can be melted by a high energy laser beam, and the molten pool undergoes extremely large cooling rate above 107 K/s when laser moves (Gu et al. Citation2012). Consequently, the SLM building process is accompanied with high thermal and residual stresses, which introduces swelling, cracks, performance degradation and even building process failure. Compare with directed energy deposition (DED) process, the stress distribution is so far unpredictable, especially for complex components built by the SLM process (Han et al. Citation2020). The powder bed-based AM processes are more sensitive to the component distortion because that a slight part bending can obstruct the powder recoater and results the building process failure. In order to decrease deformation and prevent failure in the building process, the detection and measurement method of component distortion is crucial for SLM technology (Schmeiser et al. Citation2020; Paul, Anand, and Gerner Citation2014). At present, it is still difficult to apply real-time distortion measurement techniques to commercial SLM systems due to sealing of the printing chamber and covering of the parts by powder. Although the stress distribution and distortion of SLM build component can be modelled by the finite element method (FEM) (Gouge et al. Citation2015; Song et al. Citation2020), the simulation data of the computational model have to be benchmarked and verified by measurement results of experiments. Therefore, in order to better understand the residual stress generation mechanisms and distortion evolution, a highly reliable contact measurement technique is urgently needed for SLM building process.
Many researchers have carried out various studies on residual stresses and distortion measurement. Rangaswamy et al. studied residual stresses distribution in laser cladding process by neutron diffraction techniques (Rangaswamy et al. Citation2005; Rangaswamy et al. Citation2003). It was found that the residual stresses were related to the building direction during laser process but the residual stresses distribution could only be qualitatively discussed in terms of the thermal histories of laser process samples. Kempen et al. studied the influence of preheating temperature on residual stresses of M2 high speed steel (Kempen et al. Citation2014). Their findings revealed that crack-free SLM M2 HSS were produced under high preheating temperature. Vrancken et al. demonstrated the stress maps of SLM bridge-shaped specimens with different orientations (Vrancken et al. Citation2014). Their results showed that the thermal history in SLM process caused a complex residual stress state. The quantitative characterisation of SLM process residual stress and distortion were also reported. Kruth et al. presented the theory of temperature gradient mechanism (TGM) and described the elastic-plastic distortion evolution during SLM heating-cooling process (Kruth et al. Citation2004). They performed a series of experiments with various scanning strategies and geometrical feature (Mercelis and Kruth Citation2006). Moreover, the residual stress distribution of SLM samples was also measured by destructive methods such as crack compliance method and hole drilling test (Kruth et al. Citation2012). The research for non-destructive stress measurement of laser processing made progress in recent years. The research group in Pennsylvania State University developed a real-time detecting method for additive manufacturing. Heigel et al. presented the research of distortion detection from substrate during laser deposition process captured by laser displacement sensor (Denlinger et al. Citation2015; Heigel, Michaleris, and Palmer Citation2015). Their findings revealed that the long dwell time between individual layers led to a significant decrease of distortion accumulation and reduction of build heights.
Dunbar et al. made a major advance in SLM component distortion measurement: the distortion and temperature measurement was realised through differential voltage reluctance transducer (DVRT) and K-type thermocouples, which was capable of capturing real-time stress evolution of components during SLM process (Poprawe Citation2005). Their research results showed that the rotated scanning pattern decreased the distortion of SLM Inconel 718 samples by 37.5%, and the distortion accumulation was influenced by thermal cycles during the layer deposition. There is still room for improvement in the real-time contact SLM distortion measurement technique. On the one hand, the measurement based on transducer has been restricted to the substrate deformation in the perpendicular direction (i.e. out-of-plane displacement). However, the distortion of SLM samples is mainly in the form of bending and thus the deformation process in the in-plane direction of SLM sample cannot be detected precisely by differential variable reluctance transducer (DVRT). On the other hand, the responding time of DVRT system is relative long, a more sensitive measurement system is urgent needed for distortion monitoring in SLM process. In this work, a novel experimental method for component distortion measurement during SLM process based on strain gauges is proposed. The strain gauges circuit with temperature compensation function is designed. The experimental system is directly placed in a commercial SLM machine without structure modification. The strain gauges are attached on the bottom of test specimens, and the new method is able to realise real-time distortion measurement of building component during SLM with high-resolution output and short response time. By using this self-developed experimental system, the distortion behaviour of specimens under laser scanning on powder layer and bare specimen surface are captured respectively. The curves of specimen deformation as a function of time obtained from this study provide a better understanding of component distortion in SLM process with various laser parameters. A high resolution EBSD is applied to determine the stress distribution in the cross-section of melting track.
2. Experimental details
2.1. SLM system and processing parameters
All experiments are carried out on the SLM 125HL machine (SLM Solutions GmbH, Lübeck, Germany). The machine is equipped with a 400 W fibre laser with a minimum spot size of 50 μm. The SLM building model is designed by Magics software and sliced into layers according to the SLM system. The test specimens are machined from a SS304 plate with the dimension of 25 mm × 8 mm × 5 mm (L×W×H). Spherical SS316L powder from 325 mesh sieving is used as the starting powder. The chemical compositions of SS304 and SS316L used in substrate and powder are shown in . The main reason for chosen materials is that the volume change before and after laser melting is consistent, the effect of phase transformation on materials strain is small. Moreover, the unique Mo element in SS316L, as target element can be used to observe the powder layer diffusion area. The laser parameter details for distortion analysis during SLM process are shown in . The distortion measurement is carried out on both specimens with powder layer and bare specimen surface. In the former case, the powder is spread on specimen surface through a plug gauge to ensure the layer thickness of 50 μm. In the latter case, the purpose is to simulate the conditions of multi-scanning mode of the SLM process and overlapping during multi-laser source scanning. The waiting interval between laser scanning on successive layers is constant of 3 min for on powder layer, and 40 s for on bare surface due to powder spreading and laser process reset duration.
Table 1. Chemical composition of substrate (SS304) and powder (SS316L).
Table 2. Parameter of laser scanning experiments.
2.2. Measurement instrument setup
The schematics of in-situ distortion measurement setup used in experiment is shown in (a.b). BX120-10AA type strain gauges are attached to the bottom and side of the test specimen in the form of a half-bridge temperature compensating connection, as shown in (c). The deformation and compression of test specimen during the SLM process is captured by the strain gauge and converted into electrical signal. The strain gauge is connected to a XL2101DS dynamic/static resistance strain indicator which measures and records the electrical signal. The combined linear accuracy of the integrated system is ±5μϵ. (a) shows the test specimen attached with strain gauge in the working chamber of the SLM system. The specimen is covered by powder during the SLM process, the cable of strain gauge is though powder layer and connects with indicator out of the working chamber, as shown in (b). The specimen dimension is designed in a way that the centre points of the side and bottom surfaces have the same distance from the centre point of the top surface, in order to minimise the temperature difference between the side and bottom of specimen. This limits the temperature-induced errors from the strain measurements to within 5% (relative error).
Figure 1. Schematics of in-situ SLM distortion measurement system by 3D view (a), top view (b) and assembled testing specimen (c).
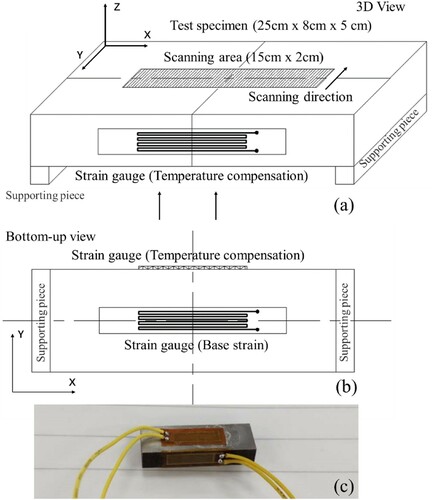
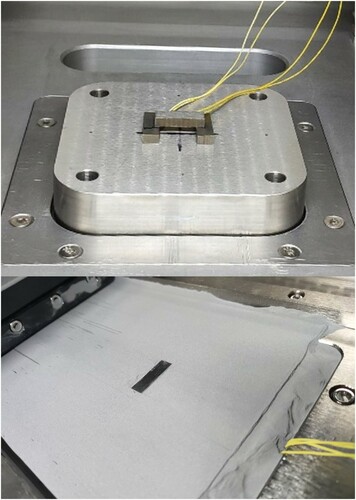
Figure 2. Specimen attached with strain gauge placed in SLM working chamber (a), submerged specimen under powder and reserved cable through powder layer (b).
2.3. Laser absorptivity test
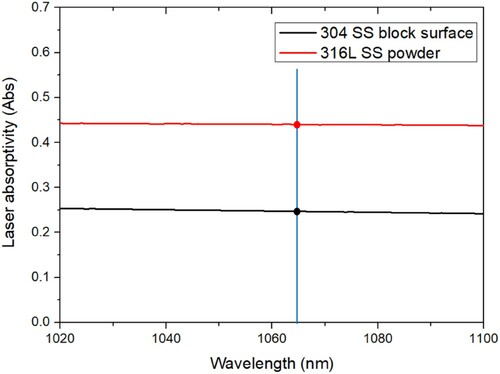
In order to compare the laser absorptivity on different material surfaces, the laser absorption test is carried out on a UV-Vis-NIR spectrophotometer (AGILENT CARY 5000, Agilent Technologies, Inc, USA). The test is conducted on both the original test specimen surface (no powder) and a 316L powder layer. The laser wavelength test range is between 1020 and 1100 nm.
2.4. Metallographic characterisation of laser track cross-section
After laser scanning, all specimens are cut perpendicularly to laser scanning direction. The cross-sections of specimens are grinded and polished following classical procedures. The specimens are etched in 9% Nital reagent for metallographic examination. The microstructure analysis was performed by optical microscopy (Olympus, Inverted Metallurgical Microscope GX53). Electron backscattered diffraction (EBSD) measurement was performed using JEOL IT500HR field emission scanning electron microscope (FESEM) with an Oxford Instruments Symmetry EBSD detector.
3. Results
3.1. Laser energy absorptivity study
Laser energy absorptivity test is carried out on both the SS316L powder layer and the SS304 block surface in order to compare the laser energy absorptivity on different media. shows relationship between absorptivity and laser wavelength. It is obvious that the slope of laser energy absorptivity of SS304 block surface is below that of SS316L powder layer. As the wavelength increases from 1000 nm to 1100 nm, the absorption coefficient for SS316L powder decreases by about 0.005, while that for SS304 block decreases by about 0.014. It shows that the energy absorptivity of SS316L powder layer is about double that of SS304 block surface. For the laser beam type used in the SLM system, the laser energy absorptivity of the SS316L powder layer and the SS304 block surface under the fibre laser wavelength of 1064 nm is 0.44 and 0.25, respectively.
Figure 3. Laser energy absorption rate evolution of laser process on 304 block surface and 316L powder layer
3.2. Distortion behaviour analysis in single scanning
The distortion of specimen under laser scanning on powder layer and bare specimen surface are obtained by the in situ measurement system, under laser power of 300 W, scanning velocity of 300 m/s and hatch distance of 120 μm. The corresponding strain curves obtained are shown in (a,b), respectively. The study of specimen without powder serves as a benchmark against that of one with powder, as well as to analyse sample distortion behaviours in re-melting and overlapping areas during the SLM process. The figure illustrates that the distortion curve of laser scanning on powder layer and on bare specimen surface shows similar trends but of different scale. In the first scenario, when the laser scanning starts on the powder surface, the central section of test specimen bends upward strongly and instantaneously. At the same time, the strain gauge attached on specimen bottom is compressed, and the strain becomes negative (shown as ‘−’) reaching the value of −550 μϵ. After the laser scanning stops, the specimen gradually recovers to its origin shape while the compressive strain at the bottom surface reduces rapidly. Thereafter, the test specimen continuously deforms after recovery and eventually shows a downward bent shape in the central section while the strain gauge attached to the bottom is stretched, and the strain became positive (shown as ‘+’) reaching the value of +50 μϵ which is considered as residual strain. In the second scenario, when the laser scanning starts on the specimen surface without powder, the initial compressive strain at the bottom is −690 μϵ, which is more significant than that of specimen with powder on top. After the laser scanning stops, a much higher tensile residual strain is developed, at +460 μϵ, followed by a relatively slow recovery during cooling, where the tensile strain in the bottom is slightly reduced.
Figure 4 . Distortion curve in single scanning with powder layer (a), distortion curve in single scanning without powder layer (b).
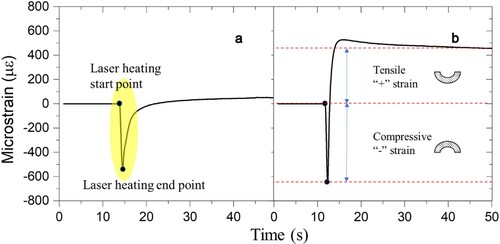
(a,b) are the zoomed-in plots of the strain as a function of time during the laser heating and the initial period of cooling. It reveals that the compressive strain at the bottom surface begins to recover immediately when laser scanning stops in both cases. Moreover, the magnitudes of both decreasing and increasing slopes of the strain curves for the specimen with bare surface are higher than that for the specimen with the powder layer. According to this result, although more laser energy is absorbed by powder layer than bare surface as shown in , the specimen with bare surface undergoes more significant distortion at both laser heating and cooling stages.
Figure 5. Enlarged distortion behaviour curves of single scanning process: on sample with a powder layer on top (a), on sample surface without powder (b), distortion behaviour in different phases (c).
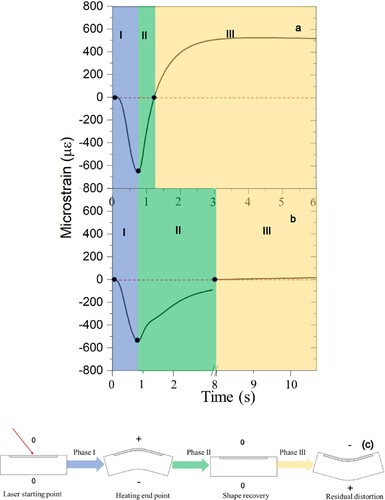
According to the specimen distortion behaviour, the distortion process of specimen during laser scanning can be divided into three phases under different driving forces, as different colour marked shown in (a,b): (I) laser heating phase under thermal expansion, (II) recovery phase under elastic recovery, (III) residual deformation under tensile of yielded area. The distortion evolution of specimen in laser scanning process in different phases is shown in (c). The composition of strain in the specimen distortion can be presented by Equation (1) in , where is total strain of specimen,
is thermal expansion strain,
is elastic strain,
is plastic strain. shows the strain conditions of top and bottom surfaces of the specimen in different phases. In phase I, top surface of specimen undergoes rapid heating during laser irradiation, the thermal expansion on top surface causes the distortion of whole specimen. The extensional area is restricted by surrounding materials, meaning that a negative (compressive) elastic strain
is induced on the top surface, so that the total strain
is smaller than the thermal strain
. When the thermal strain
reaches a critical value, yielding occurs on the top surface, so that a negative (compressive) plastic strain
is generated (Kruth et al. Citation2004). The yielding condition is reached rather quickly because the yield limit is lower at higher temperature. Thus, the continuous laser heating on the top surface leads to a gradually accumulation of (compressive) plastic strain.
Table 3. Strain condition of specimen during laser scanning in different phases.
Since the total strain on the top surface is still positive (expansive), the sample bends in such a way that the bottom surface is subjected to a negative (compressive) total strain . For simplicity, let us ignore the temperature change near the bottom surface, so that the thermal strain
is nearly zero. We shall also assume that the bending is mild enough that the material on the bottom surface has not reached the yield point yet, i.e.
is zero. Therefore, the total strain
equals the elastic strain
(both negative) on the bottom surface. This is indeed what the strain gauge measures (negative strain) during Phase I of the SLM process. In this phase, the material near the bottom surface is subjected to a compressive stress due to the bending produced by the expansion of the top surface.
In Phase II, the thermal expansion strain of the top surface begins to be reduced once the laser has been turned off. This causes the total strain
of the top surface to decrease, and the bending of the specimen to decrease. For simplicity, we shall assume that no further plastic deformation occurs during Phase II, so that
on the top surface stays at the constant (negative) value, which was attained at the end of Phase I. The end of Phase II is defined by the condition in which the bending of the specimen is exactly zero. At this moment,
= 0 and
< 0 on the top surface. For self-consistency, we expect that
> 0 on the top surface, i.e. there are still some residual heat and thermal expansion strain on the top surface.
During Phase III, the thermal strain on the top surface continues to decrease and eventually goes to zero. Given the negative plastic strain
on the top surface inherited from Phase I, the total strain
turns negative on the top surface. This results in the bending of the specimen in the opposite direction as that of Phase I. The resistance of the specimen to bending causes the elastic strain
to be positive (tensile) on the top surface, i.e. in the opposite direction as
. Due to the bending, the total strain
and the elastic strain
are both positive on the bottom surface, as measured by our strain gauge. The use of thicker specimen or harder specimen material will lead to less bending and smaller strain on the bottom surface during Phase III.
3.3. Distortion behaviour analysis in multi-layer scanning
A further experiment is conducted to monitor the distortion behaviour of the specimen during the SLM building process of five powder layers deposition. (a) shows the curve of strain development reflecting the distortion of the specimen for the first five powder layers deposition under laser parameters of power 300 W, scanning velocity 300 m/s and hatch distance 120 μm. For the first layer scanning, the compressive strain reaches a maximum value of −590 μϵ after laser heating, and residual tensile strains climbs to 64 μϵ after 3 min of cooling. It is also observed that the distortion curve of the specimen shifts upward (i.e. more tensile) with each successive scan on a new powder layer. As shown in (b), the incremental tensile strain relative to the previous layer scanning is decreasing. The compressive strain immediately after heating becomes −518 μϵ after five layers of deposition. Furthermore, the residual tensile strain rises gradually to 153 μϵ. The residual distortion of the specimen measured here corresponds to the effect of residual stress accumulation during the SLM layer addition process. It can be deduced that the internal stress in the component builds up gradually with each added layer. Moreover, the distortion of the sample does not stop when the laser is turned off but continues to evolve over a period of time that can be hundreds of seconds long.
Figure 6. Distortion behaviour curve of laser-powder layer process in first 5 powder layers (a); histogram of the residual strain value and heating strain value from distortion curve (b).
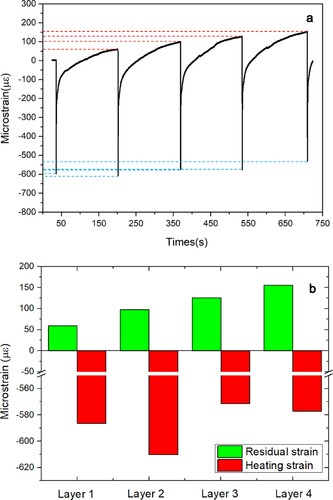
Compared with the curves obtained by DVRT method (Figure 12 in [Dunbar et al. Citation2016]), a steeper curve raise in cooling phase and stabilises near the original position rather than gradually increases and stops at a half of position. It is because that the thin substrate used in DVRT system is more affected by laser heating, the melted and yield part is in majority among the substrate thickness which plays a key role of interruption during the recovery process. Based on the comparison between two curves, the measurement method in this study is sensitive to the component distortion in SLM process.
3.4. Distortion behaviour of specimen under laser scanning on bare specimen with different laser parameters
This section aims to analyse the distortion behaviour of specimen affected by laser irradiating on bare surface under different laser parameters. showed the distortion curves of specimens under laser scanning on bare surface captured by the self-developed measurement system with laser parameters from . The distortion behaviours under different laser parameter are compared by varying the scanning width, scanning speed, laser power and hatch distance.
Figure 7. Distortion behaviours of multiple-laser scanning on bare SS 304 specimen surface with different laser parameters in Table 1.
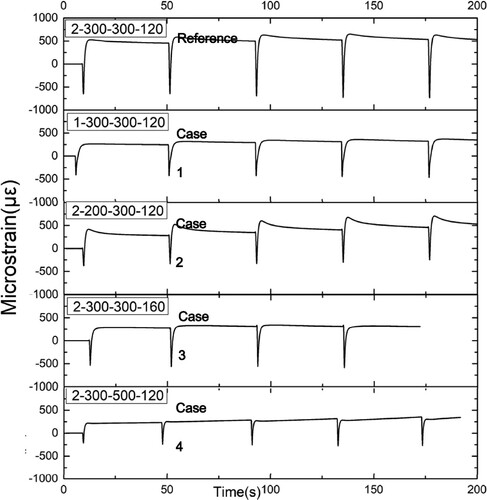
As per comparison between the reference case and case 1, the narrower scanning area (1 mm) leads to both lower heating strain magnitude (−405 μϵ compared to the reference value of −648 μϵ) and lower residual strain (260 μϵ compared to to 520 μϵ). In case 2, the lower laser power (200 W) also causes lower heating strain magnitude (−378 μϵ compared to −648 μϵ) and lower residual strain (418 μϵ compared to 520 μϵ). In case 3, the heating strain of distortion curve with large hatch distance is close to that with reference (−541 μϵ to −648 μϵ), but the residual strain is lower (286 μϵ to 520 μϵ). According to the scanning setting, the number of hatch tracks in a given scanning area with hatch distance of 160 μm is 93, with hatch distance of 120 μm is 123, respectively. The above result indicates that a smaller number of scanning tracks can lead to a lower distortion. However, the relationship between the number of scanning tracks and residual distortion does not follow a linear relationship. In cross-sectional area of 3D model, higher hatch distance results in longer waiting time between each scanning track while more thermal energy is released during the waiting time. In case 4, the heating strain and residual strain from distortion curve with rapid scanning speed of 500 mm/s is −218 μϵ and 220 μϵ, respectively.
In summary, the heating/recovery distortion v.s. the energy density input relationship is shown in in order to simplify the dependence on the numerous control parameters in the SLM process. The laser energy density E is the amount of laser beam energy input on certain area as shown in Equation (2).
(2)
(2) where P is the power of the laser, V is the laser scanning velocity, H is the distances between laser hatch lines.
Figure 8. Heating/recovery distortion distribution versus energy density input.
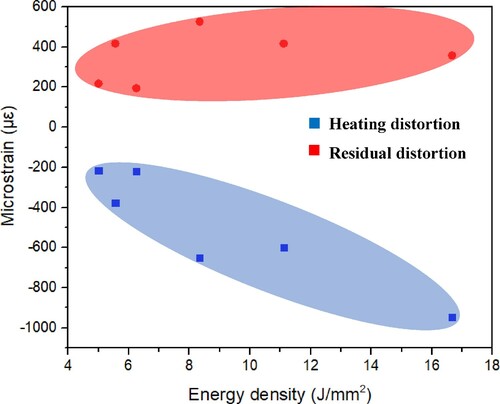
As shown in , the heating distortion decreases from −200 μϵ to −900 μϵ with laser energy density increasing from 5 J/mm2 to 16.3 J/mm2. The residual distortion correspondingly increases from 200 μϵ to 300 μϵ with laser energy density increasing from 5 J/mm2 to 16.3 J/mm2. Thus, a strong negative correlation can be deduced between heating distortion with laser energy input. However, the effect of laser energy input on residual distortion is less pronounced.
4. Discussion
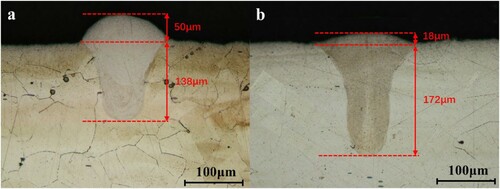
The experiments reveal that the distortion behaviours of specimens under laser scanning on powder layer and bare surface are different. shows the cross-section SEM images of laser melting track with and without powder layer. In case of laser effects on powder layer, the laser beam acts on the powder layer causing molten pool formation. The heat transmission from laser beam to substrate is through the molten pool. Thus, most of the heat is present in the molten pool above the substrate, and only a fraction of the heat transfers to substrate causing top surface expansion and causes a narrow diffusion area, as shown in (a). Although laser absorptivity of powder surface is higher than that of bare specimen surface, the laser absorptivity of both cases is the same after surface melted (Poprawe Citation2005). Thus, the amount of heat absorbed is nearly equal for both cases after molten pool is formed. However, the heat can reach deeper substrate area when laser irradiates on the bare surface. Therefore, compared with the specimen with powder surface, the heat-affect-area of specimen with bare surface during laser scanning is larger and deeper, as shown in (b). Meanwhile, one part of heat-affected-area under compressive stress from surrounding materials is yielded and convert to the yield layer. Accordingly, larger heat-affected-area in specimen with bare surface leads to deeper yielded layer.
Figure 9. SEM images of laser scanning track cross-section on powder layer (a), on bare specimen surface (b) under same laser parameters (Reference).
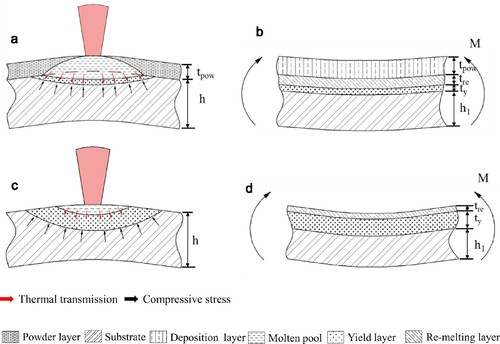
In the following, we develop a relationship between strain and yield layer thickness, the schema of each cases is . Thus, only the yield area on top surface plays the role in residual strain phase. After laser scanning, the deformation of specimen is driven by a bending moment M. Assume the top surface of the specimen is subjected to an internal tensile stress σint.
Figure 10. Stress and deformation of specimen with powder layer during laser scanning (a), stress and deformation of specimen after cooling (b), stress and deformation of specimen during laser scanning on bare surface (c), stress and deformation of specimen after cooling (d).
The bending moment can be presented as
(3)
(3) where b is width of sample,
is the thickness of yield layer on top surface and h is the specimen thickness. The relationship of specimen thickness under different heating affect can be drawn as:
(4)
(4) where
is the thickness of the specimen,
is the thickness of re-melting area,
is the thickness of specimen not subjected to thermal expansion.
At the bottom of the specimen, the stress produced can be presented as
(5)
(5) Where
presents the moment of inertia
(6)
(6)
Thus, the strain measured by strain gauge can be presented as
(7)
(7) E represents material elasticity modulus. Plug bending moment M and moment of inertia I substituted into
formula,
can be presented as:
(8)
(8)
When the specimen is heated, the elongation under thermal expansion can be expressed as:
(9)
(9) Where a is expansion coefficient, l is length of specimen,
is temperature different before and after laser heating. At the atomic scale, the distance between atoms increases during thermal expansion, but the heated area is restricted by the surrounding materials. The compressive stress is formed and reaches yield point. Assume suffer compressive force F effects on two sides of yield area, the shorten length of beam
can be expressed as:
(10)
(10) Where A is cross sectional area. Assume the length of specimen is constant under compressive force F effect, then
is equal to
. F can be presented as:
(11)
(11) The specimen is under force and momentum equilibriums state, then
(12)
(12) Bringing Equation (12) into Equation (8), then deformation on specimen bottom can be worked out as:
(13)
(13) The above formula shows the strain on specimen bottom is proportional to thickness of yield material layer and temperature different before and after laser heating, is inversely proportional to specimen thickness. Based on the results, it is possible to reduce the residual stress of printed component by decrease the temperature different (raise preheating temperature) or yield layer thickness (use thick powder layer). It is also an effective way for residual stress reduction by increase substrate thickness in the SLM process.
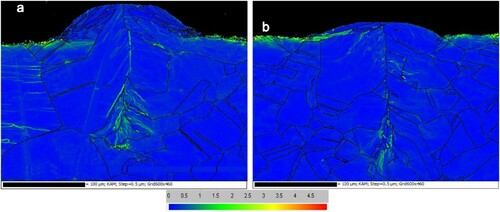
A KAM mapping analysis is carried out to evaluate the residual stress distribution of melting area, as shown in . The yellow area in images represents high stress concentration. It can be observed that the stress concentration area in case of laser directly effect on bare surface is also larger and deeper than that on powder layer. In case of laser scans on powder layer, the thickness of yield material and temperature different are lower than that in case of laser scans on bare surface. Moreover, new solid layer after laser scanning also increase the specimen thickness and takes part in the residual strain decrease. Based on the findings in this study, the overlapping area of large-scale component built by multi-laser source system, or rejointing area of island scanning strategy can cause much higher residual strain than other regions of the 3D printed part. Especially, the double scanning strategy in SLM process can increase the residual deformation by one to two orders of magnitude.
Figure 11. KAM mapping of cross-section laser scanning track on powder layer (a) and on bare specimen surface (b) under same laser parameters (Reference).
5. Conclusion
In this study, an in situ distortion measurement based on strain gauge is developed and applied to study distortion behaviours of specimens during laser scanning. The measurement technique is applicable to layer additive manufacturing processes without substantial modification of equipment structure. Based on the measurement several conclusions can be drawn:
Instead of indirect SLM distortion measurement, as past studies have done, this technique accomplish the acquisition of real-time distortion data with high accuracy.
Three phases with different deformation mechanism can be found in laser scanning process: the bottom of specimen is compressed under top surface expansion in laser heating phase, the compressive strain immediately decreases under elastic recovery when laser stopped, the specimen eventually shows a bottom downward bending shape.
The powder layer absorbs more laser energy but transfers less heat to top surface which lead to a weaker thermal expansion and smaller yielded layer, the heating distortion can reach at −550 μϵ, and the final distortion stabilises at +50 μϵ. The specimen with bare surface shows obvious distortion during laser heating and cooling process, the heating distortion can reach at −690 μϵ, and the final distortion stabilises at +460 μϵ.
Although the shrinkage of new deposition layer and re-melting layer can increase deformation during the cooling stage, the area of yielded layer is the most key factor of residual strain.
The experiment results shown a linearly positive correlation between the residual strain of specimen with laser scanning on bare surface and the laser energy input.
Acknowledgements
The authors gratefully acknowledge the financial support of the National Natural Science Foundation of China (No.: 51901020), Aeronautical Science Foundation (No.:201942074001), Shandong Key Research and Development Plan project (No.: 2019JZZY010327). the Fundamental Research Funds for the Central Universities, USTB (No.: 06500092 and No.: FRF-IP-19-002). Authors would like to thank Professor Yandong Wang from University of Science and Technology Beijing for valuable suggestions.
Disclosure statement
No potential conflict of interest was reported by the authors.
Additional information
Funding
Notes on contributors
Yaojie Wen
Yaojie Wen is studying for materials science and engineering Master's degree at University of Science and Technology Beijing. His research interests include selective laser melting and Material genetic engineering.
Baicheng Zhang
Baicheng Zhang is Associate Professor in Institute for Advanced Materials and Technology, University of Science and Technology Beijing. Prof. Zhang mainly worked in additive manufacturing area, particularly in metal-base AM, such as selective laser melting (SLM) and laser cladding technology.
Shuying Liu
Shuying Liu, is pursuing her master degree in the school of Advanced Material & Technology Institute at University of Science and Technology Beijing. Her research area is 4D printing of Bio-metal.
Wei Cai
Wei Cai, is currently an Associate Professor in the Department of Mechanical Engineering at Stanford University. He received the Presidential Early Career Award for Scientists and Engineers in 2004, and the American Society of Mechanical Engineers Hughes Young Investigator Award in 2013. His research interests include dislocation dynamics and metal plasticity, atomistic simulations of deformation, synthesis and transport mechanisms at the nanoscale. He is co-author of 95 journal publications in these and related fields, a book “Computer Simulations of Dislocations” (2006) and a undergraduate/graduate textbook, “Imperfections in Crystalline Solids” (2016).
Pei Wang
Pei Wang is a research scientist at Institute of Materials Research and Engineering under the Agency for Science, Technology and Research in Singapore. He is currently the co-lead of Advanced Alloy Group in Department of Structural Materials. His research interests include metal additive manufacturing, microstructural characterization, and mechanical performance evaluation of additive manufactured structures.
Coryl Jing Jun Lee
Coryl Jing Jun LEE is currently a research specialist at Institute of Materials Research and Engineering under the Agency for Science, Technology and Research in Singapore. Her research interest includes microstructural and crystallographic information studies of metallic alloys and steels.
Junda Ma
Junda Ma is a former undergraduate student in University of Science and Technology Beijing. His graduation project is involved stress analysis of SLM process.
Xuanhui Qu
Xuanhui Qu is a full Professor in Institute for Advanced Materials and Technology, University of Science and Technology Beijing. His main research direction is Advanced powder metallurgy forming technology such as powder injection molding, high-speed press forming, 3d printing, and special powder preparation and synthesis technology etc.
References
- Denlinger, E. R., J. C. Heigel, P. Michaleris, and T. A. Palmer. 2015. “Effect of Inter-Layer Dwell Time on Distortion and Residual Stress in Additive Manufacturing of Titanium and Nickel Alloys.” Journal of Materials Processing Technology 215: 123–131. doi:https://doi.org/10.1016/j.jmatprotec.2014.07.030.
- Dunbar, A. J., E. R. Denlinger, J. Heigel, P. Michaleris, P. Guerrier, R. Martukanitz, and T. W. Simpson. 2016. “Development of Experimental Method for In Situ Distortion and Temperature Measurements During the Laser Powder Bed Fusion Additive Manufacturing Process.” Additive Manufacturing 12: 25–30. doi:https://doi.org/10.1016/j.addma.2016.04.007.
- Gao, Shubo, Zhiheng Hu, Martial Duchamp, P. S. Sankara Rama Krishnan, Sravya Tekumalla, Xu Song, and Matteo Seita. 2020. “Recrystallization-Based Grain Boundary Engineering of 316L Stainless Steel Produced via Selective Laser Melting.” Acta Materialia 200: 366–377.
- Gouge, M., J. Heigel, P. Michaleris, and T. Palmer. 2015. “Modeling Forced Convection in the Thermal Simulation of Laser Cladding Processes.” The International Journal of Advanced Manufacturing Technology 79 (1-4): 307–320.
- Gu, D. D., W. Meiners, K. Wissenbach, and R. Poprawe. 2012. “Laser Additive Manufacturing of Metallic Components: Materials, Processes and Mechanisms.” International Materials Reviews 57 (3): 133–164.
- Hai, Sun Shi, Koizumi Yuichiro, Saito Tsuyoshi, Yamanaka Kenta, Li Yun Ping, Cui Yujie, and Chiba Akihiko. 2018. “Electron Beam Additive Manufacturing of Inconel 718 Alloy Rods: Impact of Build Direction on Microstructure and High-Temperature Tensile Properties.” Additive Manufacturing 23: 248–254.
- Han, C., Q. Fang, Y. Shi, S. B. Tor, C. K. Chua, and K. Zhou. 2020. “Recent Advances on High-Entropy Alloys for 3D Printing.” Advanced Materials 32 (26): 1903855.
- Heigel, J. C., P. Michaleris, and T. A. Palmer. 2015. “In Situ Monitoring and Characterization of Distortion During Laser Cladding of Inconel® 625.” Journal of Materials Processing Technology 220: 135–145. doi:https://doi.org/10.1016/j.jmatprotec.2014.12.029.
- Kempen, K., B. Vrancken, S. Buls, L. Thijs, J. Van Humbeeck, and J. P. Kruth. 2014. “Selective Laser Melting of Crack-Free High Density M2 High Speed Steel Parts by Baseplate Preheating.” Journal of Manufacturing Science and Engineering 136: 1–6. doi:https://doi.org/10.1115/1.4028513.
- Kruth, J. P., J. Deckers, E. Yasa, and R. Wauthlé. 2012. “Assessing and Comparing Influencing Factors of Residual Stresses in Selective Laser Melting Using a Novel Analysis Method.” Proceedings of the Institution of Mechanical Engineers, Part B: Journal of Engineering Manufacture 226: 980–991. doi:https://doi.org/10.1177/0954405412437085.
- Kruth, J. P., L. Froyen, J. Van Vaerenbergh, P. Mercelis, M. Rombouts, and B. Lauwers. 2004. “Selective Laser Melting of Iron-Based Powder.” Journal of Materials Processing Technology 149: 616–622. doi:https://doi.org/10.1016/j.jmatprotec.2003.11.051.
- Martin, J. H., B. D. Yahata, and J. M. Hundley. 2017. “3D Printing of High-Strength Aluminium Alloys.” Nature 549 (7672): 365–369.
- Mercelis, P., and J. P. Kruth. 2006. “Residual Stresses in Selective Laser Sintering and Selective Laser Melting.” Rapid Prototyping Journal 12: 254–265. doi:https://doi.org/10.1108/13552540610707013.
- Paul, R., S. Anand, and F. Gerner. 2014. “Effect of Thermal Deformation on Part Errors in Metal Powder Based Additive Manufacturing Processes.” Journal of Manufacturing Science and Engineering 136 (3): 031009.
- Poprawe, R. 2005. Lasertechnik für die Fertigung: Grundlagen, Perspektiven und Beispiele für den innovativen Ingenieur. New York: Springer.
- Rangaswamy, P., M. L. Griffith, M. B. Prime, T. M. Holden, R. B. Rogge, J. M. Edwards, and R. J. Sebring. 2005. “Residual Stresses in LENS® Components Using Neutron Diffraction and Contour Method.” Materials Science and Engineering: A 399: 72–83. doi:https://doi.org/10.1016/j.msea.2005.02.019.
- Rangaswamy, P., T. M. Holden, R. B. Rogge, and M. L. Griffith. 2003. “Residual Stresses in Components Formed by the Laser-Engineered Net Shaping (LENS®) Process.” The Journal of Strain Analysis for Engineering Design 38: 519–527. doi:https://doi.org/10.1243/030932403770735881.
- Schmeiser, Felix, Erwin Krohmer, Norbert Schell, Eckart Uhlmann, and Walter Reimers. 2020. “Experimental Observation of Stress Formation During Selective Laser Melting Using in Situ X-ray Diffraction.” Addit. Manuf 32: 101028. doi:https://doi.org/10.1016/j.addma.2019.101028.
- Song, Xu, Stefanie Feih, Wei Zhai, Chen-Nan Sun, Feng Li, Raj Maiti, Jun Wei, et al. 2020. “Advances in Additive Manufacturing Process Simulation: Residual Stresses and Distortion Predictions in Complex Metallic Components.” Materials & Design 193: 108779. doi:https://doi.org/10.1016/j.matdes.2020.108779.
- Spears, Thomas G., and Scott A. Gold. 2016. “In-process Sensing in Selective Laser Melting (SLM) Additive Manufacturing.” Integrating Materials and Manufacturing Innovation 5 (1): 16–40.
- Vrancken, B., V. Cain, R. Knutsen, and J. Van Humbeeck. 2014. “Residual Stress via the Contour Method in Compact Tension Specimens Produced via Selective Laser Melting.” Scripta Materialia 87: 29–32. doi:https://doi.org/10.1016/j.scriptamat.2014.05.016.
- Wei, Daixiu, Ainiwaer Anniyaer, Yuichiro Koizumi, Kenta Aoyagi, and Akihiko Chiba. 2019. “On Microstructural Homogenization and Mechanical Properties Optimization of Biomedical Co-Cr-Mo Alloy Additively Manufactured by Using Electron Beam Melting.” Additive Manufacturing 28: 215–227.
- Wen, S. F., C. Z. Yan, Q. S. Wei, L. C. Zhang, X. Zhao, W. Zhu, and Y. S. Shi. 2014. “Investigation and Development of Large-Scale Equipment and High Performance Materials for Powder bed Laser Fusion Additive Manufacturing.” Virtual and Physical Prototyping 9 (4): 213–223.