?Mathematical formulae have been encoded as MathML and are displayed in this HTML version using MathJax in order to improve their display. Uncheck the box to turn MathJax off. This feature requires Javascript. Click on a formula to zoom.
ABSTRACT
Multi Jet Fusion (MJF) has gradually been utilised for the commercial fabrication of final products. In particular, the mechanical properties of MJF-printed polyamide 12 (MJF PA12) parts have been widely investigated by manipulating the process parameters such as the printing orientation and the cooling rate. In this work, the effects of build positions on the thermal history, crystallization, and mechanical properties of MJF PA12 parts were investigated. The thermal history of printed parts was obtained using the MJF Thermal Prediction Engine software developed by Hewlett-Packard HP Labs (HP Inc.). As compared to the parts printed at the boundaries, those in the centre region experienced a slower cooling rate, which was favourable for crystal growth. Both the crystallite size and crystallinity of the parts in the centre region were larger than those of the parts at the boundaries. The parts printed in the centre region had slightly higher tensile modulus and significantly smaller elongation at break and strain energy density than those printed at the boundaries. The tensile strength of the parts at different locations was comparable. This work serves as a guide to selecting the build position of MJF-printed parts to achieve desirable mechanical properties.
1. Introduction
Multi Jet Fusion (MJF) is a powder-based additive manufacturing (AM) technique launched by HP Inc. in 2016. The principle of MJF is based on selectively depositing agents (i.e. fusing agent, detailing agent, and property-changing agent) at a pixel level to enable control over voxel-level energy deposition, which eventually triggers the selective melting of the powder material. Polyamide 12 (PA12) is a dominant semi-crystalline polymer utilised in MJF because of its large processing window. MJF-printed PA12 (MJF PA12) parts have comparable tensile moduli and strength to those of injection-molded ones, and have been successfully adopted in parts for high pressure applications (Morales-Planas et al. Citation2018), high energy-absorbing polymeric lattice structures (Habib et al. Citation2018) patient-specific ankle-foot orthoses (Liu et al. Citation2019), and also for fabricating respirators (Tan and Choong Citation2021).
MJF is a relatively new technique under the AM family of powder bed fusion (PBF). The most notable printing technique under this family is selective laser sintering (SLS) (Tamburrino et al. Citation2021; Tan et al. Citation2021). Extensive research on SLS-printed PA12 have revealed that the properties of the printed parts are dependent on the sintering parameters. For example, several studies (Sutton et al. Citation2017; Czelusniak and Amorim Citation2021; Jain, Pandey, and Rao Citation2008) investigated the influence of energy density on various properties of the parts printed by SLS and found that the mechanical properties were improved by using higher energy density. However, with excessively high energy density, mechanical properties of the SLS-printed parts deteriorated because of polymer degradation through chain scission. The study by Kiani et al. (Citation2020) found that the tensile strength exhibited higher dependence on the build orientation than on the cooling rate. In another work, Hou, Zhu, and Xie (Citation2020) determined an optimal combination of the laser power, scanning pitch, and scanning speed to achieve the most favourable tensile strength, cost, and processing cycle. Recently, Balemans et al. (Citation2020) and Zhao, Wudy, and Drummer (Citation2018) studied the crystallization kinetics of PA12 powder in the SLS sintering process and found that a lower cooling rate led to smaller number of nucleus and larger crystals.
Comparisons of the properties of the parts printed by SLS and MJF have been conducted in recent years. Cai et al. (Citation2021) studied PA12 parts produced by SLS and MJF, and found the presence of a single -crystal form diffraction peak in both SLS- and MJF-printed specimens. It was also observed that, except for the top surface, the MJF-printed parts had better surface finish than SLS-printed parts. By investigating parts that were printed in Z-build orientation by SLS and MJF, Rosso et al. (Citation2020) found that although the tensile modulus and strength of the parts printed by the two techniques were comparable, the elongation at break of parts printed by MJF was much larger. In addition, from the studies on the mechanical properties of PA12 parts printed in different orientations by SLS and MJF, it was observed that SLS parts printed in the Z-build orientation had the weakest tensile strength (Cai et al. Citation2021; O’Connor, Dickson, and Dowling Citation2018) and modulus (Sillani et al. Citation2019), while the converse was found for MJF-printed parts. This could be due to the addition of a fusing agent that improved the interlayer melting and the adoption of the face-sintering technique in MJF.
Prior to the development of MJF, an initial study on a face-sintering printing technique, named High Speed Sintering (HSS), was introduced by Hopkinson and Erasenthiran (Citation2004). Instead of using laser for sintering like SLS, this technique involves deposition of an agent onto the powder bed at regions to be printed and utilises a heat lamp that scans linearly over the print bed. A distinct difference between MJF and HSS is the introduction of a detailing agent in MJF to improve part resolution. Recently, Large Area Projection Sintering (LAPS) was introduced by Nussbaum and Crane (Citation2018), which projects a thermal pattern on the surface to heat and fuse the entire cross-section simultaneously. An advantage of these face-sintering techniques (i.e. HSS, MJF and LAPS) over SLS is that they are faster and thus more suitable for high-volume manufacture. It was also reported that parts printed by HSS had higher tensile modulus and elongation at break than parts printed by SLS (Thomas, Hopkinson, and Erasenthiran Citation2006). Craft et al. (Citation2018) found that while SLS-, MJF-/HSS-, and LAPS-printed parts had similar crystallinity, LAPS-printed parts showed the largest elongation at break followed by MJF-/HSS- and SLS-printed parts.
The mechanical properties of MJF PA12 parts have been extensively evaluated since its commercialisation. Galati et al. (Citation2020) performed tensile tests on the parts printed in the X- and Z-build orientations and found that the tensile strength of the parts printed in the two directions was similar while elongation at break was notably higher in the X-build orientation. While this was consistent with the observation made by Palma et al. (Citation2019) and Chen et al. (Citation2021), it contradicted with the findings from the work of O’Connor, Dickson, and Dowling (Citation2018) and Sillani et al. (Citation2019). In addition, variations in the uniaxial tension mechanical parameters of MJF PA12 specimens have been reported across different published literature as shown in . This might be attributed to the different cooling processes of the tested specimens as Mele et al. (Citation2020) found that the cooling rate had a greater effect on the mechanical properties of the printed parts as compared to the printing orientation.
Table 1. Uniaxial tensile mechanical properties of MJF PA12 specimens in the X-build orientation.
While substantial research has been conducted to study the mechanical properties of MJF PA12 parts, none of which focused on the mechanical properties of the parts at different locations in the printing chamber. Specimens located in different positions of the chamber experience different cooling rates (Nelson et al. Citation2015). For instance, parts located at the boundaries of the chamber could be cooled much faster than those at the centre of the chamber. The difference in the thermal history can affect the crystallization of the printed PA12 parts, which further affects their mechanical properties. Hence, it is necessary to investigate the effect of part locations in the chamber on the thermal history, crystallization, and mechanical properties to better understand the repeatability of MJF printed parts.
Recently, Bourell and Leigh (Citation2020) conducted extensive tension tests to investigate the effects of the build location on the mechanical properties of the SLS-printed PA11 parts. The results observed that the ductility of the parts printed in the centre region was greater than that of parts at the boundaries. It is worthwhile to note that the investigation was based on parts printed in the Z-build orientation where the loading direction in uniaxial tension test was perpendicular to the sintering interfaces. Thus, both the sintering interfaces and the cooling process could significantly influence the mechanical properties of the printed parts. It is difficult to distinguish the contribution from these two factors. In this work, the investigation is on MJF PA12 parts printed in the X-build orientation such that the potential impact of the sintering interfaces on the mechanical properties is minimised (Chen et al. Citation2021). Hence, we can focus on the influence of the cooling process on the mechanical properties of MJF PA12 parts.
This work aims to study the effect of part locations on the thermal history, crystallization, and mechanical properties of MJF PA12 parts printed in the X-build orientation. First, the thermal history of the printed parts at different locations of the chamber was obtained from HP’s MJF Thermal Prediction Engine, a proprietary research software created by HP Labs. Then, X-ray powder diffraction (XRD) tests were conducted to study the crystal phases and crystallite sizes in the printed parts. Differential scanning calorimetry (DSC) tests were performed on the parts to evaluate the crystallinity and melting temperature. Afterwards, the uniaxial tensile tests were performed on the parts to investigate their respective uniaxial tensile mechanical properties. The features of the failure surface were observed through scanning electron microscopy (SEM). Finally, the relations between the thermal history, crystallinity, and mechanical properties of MJF PA12 parts were discussed. This work serves as optimisation of MJF-printed parts distribution in the printing chamber as well as reproducibility of parts for practical applications.
2. Methodology
2.1. Specimen preparation
The specimens in this work were fabricated from HP Jet Fusion 3D 5200 (HP Inc.) using the balance printing and normal cooling mode. The printing process consists of powder recoating, preheating, deposition of fusing and detailing agents, and applying fusion energy (Guo et al. Citation2021). Note that while the centre position of the specimens was specified by coordinates [x, y, z] in the build chamber, all dog-bone specimens are represented by labelling number in this work for clearer discussion. demonstrates the positions of the specimens in the chamber. (a) shows the 3D perspective view of specimens in the chamber. (b) presents the X- and Y-position marks of the specimens from the top view. In (c), the blue specimen represents the specimen in the centre location (i.e. 2-4-7), the red specimens are those along the central column in the middle position (i.e. 2-4-Z, Z is the coordinate position in the z-axis direction) and the green specimens are those in the middle row at the middle layer (i.e. 2-Y-7, Y is the coordinate position in the y-axis direction).
Figure 1. Positions of specimens in the MJF build chamber: (a) the 3D perspective view of all the specimens,: (b) the X- and Y-positions of the specimens from the top view and (c) the specimens at locations 2-4-Z and 2-Y-7 from the 3D view.
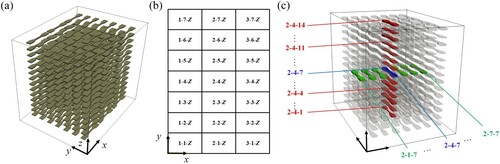
There were 3, 7 and 14 dog-bone specimens along the x-, y-, and z-axis, respectively. The specimens were placed 1.0 cm apart along the x-axis, and 2.5 cm apart along y- and z-axis. Hence, a total of 294 dog-bone specimens were printed in one print job (i.e. ). All specimens were printed in the XY-plane and the X-build orientation was adopted according to the ISO/ASTM 52921 (A. International Citation2013). The dimension of the dog-bone specimens followed the standard of ASTM D638 Type IV (A. International Citation2014) and the thickness was 4 mm. Three batches for the print job with the same the powders and machine were produced. The specimens from each batch were successively used to perform the density measurement, XRD, DSC, and tension tests. To clearly show the relationships between the thermal history, crystallization, and mechanical properties, the results of parts printed in the middle column and layer of the chamber (i.e. 2-4-Z and 2-Y-7) are presented.
2.2. MJF thermal prediction engine
The MJF Thermal Prediction Engine software (HP Labs) was employed to obtain the thermal history of the specimens. This software is developed by HP Labs (HP Inc.) to simulate the thermal history at any point inside the MJF chamber. This software is a deep neural network–based voxel-level thermal behaviour prediction of the powder bed fusion. The thermal behaviour at the voxel-level is affected by voxel energy absorption/loss, in-plane and out-of-plane thermal diffusion. In the deep learning model, a variational autoencoder (VAEs) technique is used to detect certain variables in the geometry of the build which could influence the distribution of agents on the print bed. The distribution is then used to infer the temperature on the print layer. The deep learning model is trained by utilising agents and thermal data from the printer. In the implemented model, the build geometry is the input, and the output is the thermal signature of the print layer. Subsequently, this output will be applied as the fusing thermal conditions in the simulation of HP Thermal Engine Prediction software. In this simulation, the material properties (the conductivity, heat capacity, and density of the powder and part), the fusing conditions (the fusion heat loss coefficient and fusion temperature scale factor), the initial powder temperature, and the boundary thermal conditions during the printing, and cooling processes were provided by HP Labs. The detail simulation parameters used in HP Thermal Engine Prediction software were given in , Appendix A. Besides, the three-dimensional manufacturing format (3mf) file was loaded into the software, which divided the print job into many slices according to the voxel size and mapped the area where the fusing and detailing agents would be applied. The voxel size was set as 1.336 mm, which is selected for the optimal computational cost and accuracy.
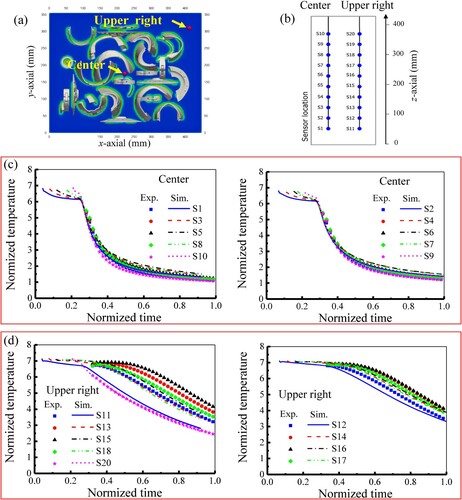
The cooling history obtained by the MJF Thermal Prediction Engine has been validated through experiments by HP Labs. The experimental validation for the cooling process was done by recording the temperature at several specific positions where the thermal couples were inserted. The results of validation were given in Figure A1, Appendix A. The maximum relative deviation of the experimentally measured temperature from that of the Thermal Prediction Engine (, where
and
are the experimental and predicted temperature, respectively in degree Celsius) is 12.5% (the maximum deviation is 17.4 °C). The mean relative error is 7.7% (the average error is 7.7 °C). The maximum temperature deviation occurs at the 22.51 h at a specific location (S11). Although the maximum deviation reaches 17.4 °C, the evolution trend of temperature at different positions can be captured well, as shown in Figure A1, Appendix A. Hence, the quality of the simulation results can be used to discuss the effect of cooling rate on the crystallization at different positions in this work. Note that the variation of temperature across each gauge section of the dog-bone specimen was small in the cooling process (the maximum difference was around 2 °C) due to the low thermal conductivity of porous powders and the small volume of gauge section of the specimen. The thermal history of each specimen at its centre point was extracted as the representative for the specimen.
2.3. Printed materials characterisations
DSC (DSC-Q200, TA Instruments) tests were performed to determine the crystallinity and melting temperature of printed parts. The DSC samples with a mass of approximately 7 mg were tested under an increasing temperature ramp from 40 to 200 °C at a rate of 10 °C/min. The DSC measurements were carried out at a nitrogen flow rate of 40 mL/min. The crystallinity was calculated using the heating endotherms
as
(1)
(1) where
is the enthalpy of fusion and
is the heat of fusion of 100% crystalline PA12, which is taken as
J/g (Zarringhalam, Majewski, and Hopkinson Citation2009). To compare the crystallinity of specimens at different locations of the printing chamber, DSC tests were conducted on the same position of every printed part to obtain their respective crystallinity. The top left corner of the dog-bone specimens with labels was selected to measure the crystallinity so that these specimens can be used for subsequent mechanical tests.
XRD (NanoinXider, Xenocs) was conducted to identify the phase constituent and crystallite size in MJF PA12 specimens. The X-ray source is a 40 micro-focus sealed tube with a copper anode. The beam collimation configuration of a medium resolution was used in this work. In this configuration, the beam size on the sample is 800
and it has a typical flux of 60
on the sample. Nano-InXider, a command-and-control software, was used to drive the machine as well as to conduct data acquisition and visualisation. The crystallinity of the specimens can be determined from XRD results, for which the deconvolution method (Rao et al. Citation2013) with a Gaussian function as the fitting method for the resolved peaks was used. The equation used for the calculation of the crystallinity is computed as
(2)
(2) where
is the area under crystalline peaks and
is the area under the graph representing the amorphous region.
The average crystallite size perpendicular to the crystal surface, L, can be calculated by using the Scherrer equation:
(3)
(3) where K is the shape factor that is taken to be 0.89 (Li et al. Citation2020),
is the wavelength of the incident X-ray that is 0.1514 nm in this work, B is the width of the diffraction peak at half height, and
is the Bragg’s diffraction angle. Note that the XRD and DSC tests were conducted on the same region of the specimens without deformation.
The tensile machine tester (Shimadzu AGX) with a 10 kN load cell and video extensometer was used for the uniaxial tensile test. A pre-load of 5 N was applied to all MJF PA12 dog-bone specimens. The crosshead displacement speed was 10 mm/min. The density of specimens was measured using the Archimedes method with ethanol as the suspension medium at room temperature. The fracture surface of the dog-bone specimens was observed using SEM (JSM-5600 LV, JEOL) at an acceleration voltage of 15 kV.
3. Results and discussion
3.1. Thermal history
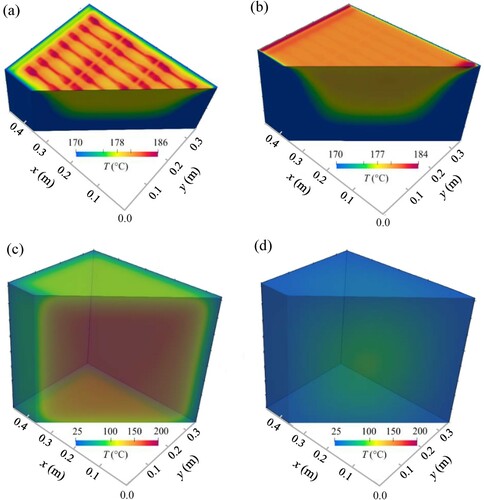
shows the temperature distribution predicted by the Thermal Prediction Engine at different stages of the printing process. (a) exhibits the temperature distribution during the printing process of layer 7. As the fusing agent was deposited on the powder that would be printed, these regions had a higher heat absorption rate when the light source was scanned across the layer, hence exhibited the highest temperature. In preparation for the print in the next layer, powder particles were spread above the current layer and pre-heating was applied. At the stage in (b), the heat was distributed uniformly across the layer. Meanwhile, for the layer’s underneath, the temperature was the highest in the middle region and gradually decreased towards the boundaries. This layer-by-layer process continued until the print job was completed. (c) and (d) present the predicted the temperature distribution right after the ending of the print job and after cooling for 30 h, respectively.
Figure 2. The temperature distribution predicted by Thermal Prediction Engine at different time: (a) t = 5.21 h when printing parts in layer 7, (b) t = 6.69 h after powder recoating in layer 8, (c) t = 10.87 h when the printing process is completed, and (d) t = 40.92 h when the printing chamber has undergone the cooling process for 30 h.
The thermal history at the central point of dog-bone specimens is extracted by python code and the results are shown in . (a) shows the comparison of the thermal history at same X- and Z-positions but different Y-positions of the chamber (i.e. X = 2, Y = 1–7, and Z = 7). (b) compares the thermal history of parts at the same X- and Y-positions (i.e. X = 2 and Y = 4) on equally spaced layers (i.e. layers 1, 4, 7, 10, and 14) to observe the trend across the 14 layers in the chamber. The thermal history consists of the preheating stage, printing stage, and cooling stage. The initial flat portion of the temperature-time graph represents the preheating stage, and the following peak depicts the printing stage. The rest of the curve demonstrates the cooling profile of the specimen at the specified location. Due to the layer-by-layer approach in MJF, the cooling profile can be further classified into two stages. The first stage is the cooling process during the printing of new layers above, and the second stage is the cooling process after the printing has been completed.
Figure 3. Thermal history at the central point of the dog-bone specimens at different positions: (a) different Y-positions (X = 2, Y = 1–7, and Z = 7) and (b) different Z-positions (X = 2, Y = 4, and Z = 1, 4, 7, 10, and 14).
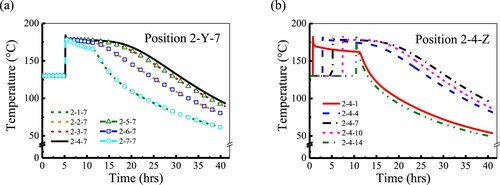
The first stage of cooling occurred due to the accumulation of the layers during the printing process that trapped heat. The heat from the layers being printed on top could warm up the printed layers below, thus affecting their heat diffusion. Hence, the cooling rate for this stage was slower than that for the second stage. For specimens located at the boundary (i.e. positions 2-1-7, 2-7-7, and 2-4-1), the temperature decreased significantly faster during the second stage than that during the first stage. On the contrary, the other specimens exhibited a smooth transition between the first stage and the second stage of cooling. This is because after the printing process was completed, those specimens at the boundaries of the printing chamber were cooled directly by the surroundings. However, the other specimens that were enclosed within the chamber by the unfused powder and neighbouring printed specimens experienced slower heat transfer, resulting in a less abrupt change in the cooling rate between the two stages.
The specimens at the top and bottom-most layers (i.e. locations 2-4-1 and 2-4-14) had a faster cooling rate than the rest of the specimens across the layers, as shown in (b). The cooling rate of the specimen on the topmost layer (i.e. layer 14) was the fastest, while the slowest cooling rate was found on the middle layer (i.e. layer 7) since the specimens on the middle layer were surrounded by the other specimens and unfused powder. Specimens on layer 1 exhibited a similar trend as those on layer 14 in the second stage of cooling. However, the duration of the first stage of cooling for layer 14 was shorter than that for layer 1.
3.2. Crystallization
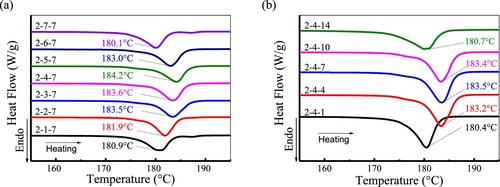
shows the DSC results of the MJF PA12 specimens at different positions. Parts located at the boundaries (i.e. locations 2-1-7 and 2-7-7) had a lower melting point. The specimens with higher melting points were generally located at the centre region of the chamber (i.e. locations 2-3-7, 2-4-7, and 2-5-7). The melting points of the specimens along the 2-Y-7 positions showed a similar trend as those along 2-4-Z. For the specimens located at 2-4-1, 2-4-4, 2-4-7, 2-4-10, and 2-4-14, the melting temperatures of specimens in the middle region of the chamber (i.e. layers 4, 7 and, 10) were similar and at approximately 183 °C. Those samples at the boundaries of the chamber (i.e. layers 1 and 14) had a lower melting temperature of approximately 180 °C.
Figure 4. DSC results of MJF PA12 specimens printed at different positions: (a) different Y-positions (X = 2, Y = 1–7, and Z = 7) and (b) different Z-positions (X = 2, Y = 4, and Z = 1, 4, 7, 10, and 14).
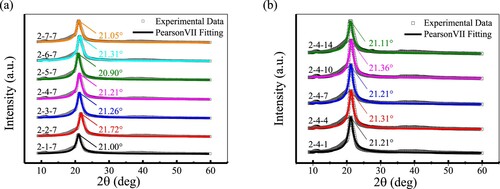
shows the XRD results of the MJF PA12 specimens at different positions. A distinct peak at approximately 21° appeared for all the specimens investigated in this work. It is reported that the -form of PA12 is monoclinic and gives two reflections (Dencheva et al. Citation2005; Van Hooreweder et al. Citation2013), which correspond to the 2
value of 24° and 20°, respectively. The
-form is reported to exhibit one reflection, which corresponds to the 2
value of 21° (Dencheva et al. Citation2005; Van Hooreweder et al. Citation2013). Hence, it can be verified that there was only
-phase existing in the printed specimens, which is similar to the work by Cai et al. (Citation2021).
Figure 5. XRD results of MJF PA12 specimens printed at different positions: (a) different Y-positions (X = 2, Y = 1–7, and Z = 7) and (b) different Z-positions (X = 2, Y = 4, Z = 1, 4, 7, 10, and 14).
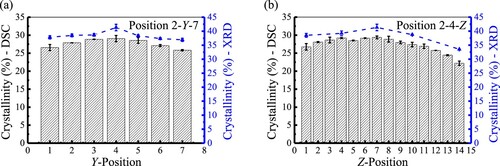
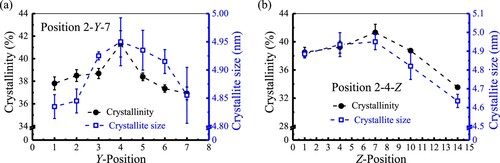
The value of crystallinity in the specimens was obtained by both DSC and XRD analyses. The crystallinity distributions along the Y and Z-positions are shown in . The crystallinity of the specimens across positions 2-Y-7 and 2-4-Z exhibited similar trends with higher crystallinity in the middle regions and lower at the boundaries. However, the crystallinity obtained from XRD and DSC tests was different. The deviation could be due to the different working principles of the two techniques, which in turn result in different approaches in the calculation of the crystallinity in the specimens. A similar observation was found in the work by Nogueira et al. (Citation2011) and Udayakumar et al. (Citation2020).
Figure 6. Crystallinity obtained from DSC and XRD data for the specimens printed at positions: (a) 2-Y-7 and (b) 2-4-Z.
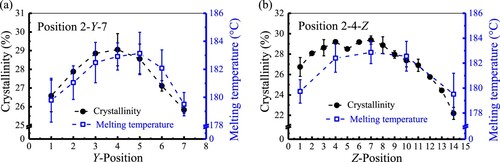
shows that the highest crystallinity of printed parts was at location 2-4-7 and the lowest at location 2-4-14. The crystallinity of the specimen at position 2-4-1 (26.7%) was 4.5% higher than that of the specimen at position 2-4-14 (22.2%). This could be because the specimen on layer 1 experienced the first stage of cooling before the second stage while the specimen on layer 14 entered the second stage of cooling almost immediately after printing. Although both specimens at positions 2-4-1 and 2-4-14 had a similar cooling rate in the second stage, the overall cooling history of the former was longer and thus it had more time to promote crystal growth.
The crystallinity and melting temperature of MJF PA12 specimens printed at locations 2-Y-7 and 2-4-Z are shown in . The melting temperature of specimens printed in the centre region was higher than those at the boundaries. This trend found in the melting temperature of the specimens across the build locations was similar to that observed for their crystallinity.
Figure 7. Crystallinity and melting temperature of MJF PA12 specimens printed at positions: (a) 2-Y-7 and (b) 2-4-Z obtained from the DSC tests.
The crystallinity and crystallite size of MJF PA12 specimens printed at locations 2-Y-7 and 2-4-Z are shown in . The specimens printed in the centre region of the chamber exhibited larger crystallites while those at the boundaries contained smaller crystallites. The specimens with higher crystallinity tended to have slightly larger crystallites, indicating that the higher crystallinity might be caused by the larger crystallite size. Note that the investigation on the effect of the cooling process on the molecular weight and hence the melting temperature needs to be further explored.
Figure 8. Crystallinity and crystallite size of MJF PA12 specimens printed at positions: (a) 2-Y-7 and (b) 2-4-Z obtained from the XRD tests.
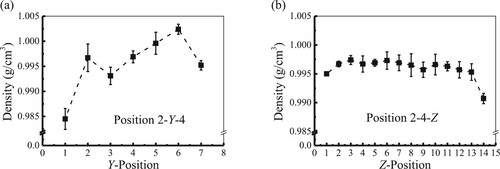
The density of specimens (i.e. locations 2-4-Z and 2-Y-7) was measured and the results are shown in . The density of parts at different locations had slight variations and ranged from 0.985 g/cm3 to 1.002 g/cm3. The density of parts in the centre region (i.e. location 2-4-7) was slightly higher than that of parts at the boundaries (i.e. locations 2-4-1 and 2-4-14). According to the work by Zhu and Majewski (Citation2020), the porosity of parts is mainly dependent on the sintering conditions. Since the sintering conditions were identical in this work, it can be assumed that the porosity of parts printed at different locations was the same. Thus, parts with higher crystallinity have higher density, since the density of the amorphous phase (0.99 g/cm3) is lower than that of the crystalline phase (i.e. α-phase crystal polymorph 1.034 g/cm3 and γ-phase crystal polymorph 1.085 g/cm3) (Li, Koch, and De Jeu Citation2003). To further verify the validity of the hypothesis, the quantitative calculation was given in Appendix B.
Figure 9. Density of MJF PA12 parts printed at different positions: (a) 2-Y-7 and (b) 2-4-Z.
3.3. Mechanical properties
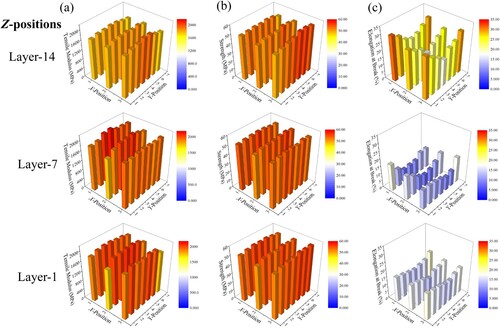
To investigate the effect of Y-positions and different layers on the mechanical properties of MJF PA12 specimens, uniaxial tensile tests were conducted on the specimens printed at locations 2-Y-7 and 2-4-Z, and the results are shown in and , respectively.
Figure 10. Tensile mechanical properties of the MJF PA12 specimens at the locations 2-Y-7: (a) tensile modulus, (b) strength, (c) elongation at break, and (d) strain energy density.
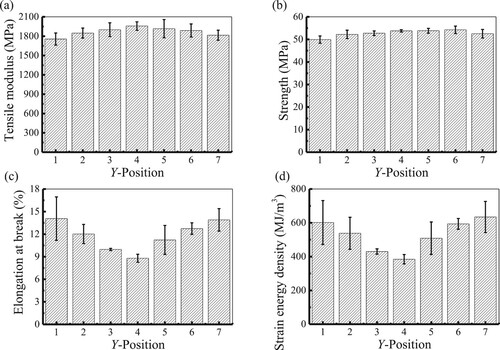
Figure 11. Tensile mechanical properties of the MJF PA12 specimens at locations 2-4-Z: (a) tensile modulus, (b) strength, (c) elongation at break, and (d) strain energy density.
illustrates that the tensile moduli were slightly higher at locations 2-3-7, 2-4-7, and 2-5-7, which corresponded to the middle region of that build layer. The specimens with the highest and lowest tensile moduli were printed at locations 2-5-7 and 2-1-7, respectively. As opposed to the trend found in the tensile modulus, the elongation at break was significantly lower at locations 2-3-7, 2-4-7, and 2-5-7. The specimens at locations 2-1-7 and 2-4-7 had the largest and smallest elongation at break, respectively. The largest elongation value was about 1.6 times the smallest one. A similar observation is obtained for the strain energy density. The specimen with the highest strain energy density was printed at location 2-1-7 and the lowest one was at location 2-4-7. The strain energy density was similar for specimens printed at locations 2-1-7 and 2-7-7. Note that although the thermal history for the specimens at locations (i.e. locations 2-1-7 and 2-7-7) was identical, a slight difference in the modulus and strength of these specimens was observed, which could be due to the random distribution of voids inside the specimens (Chen et al. Citation2021).
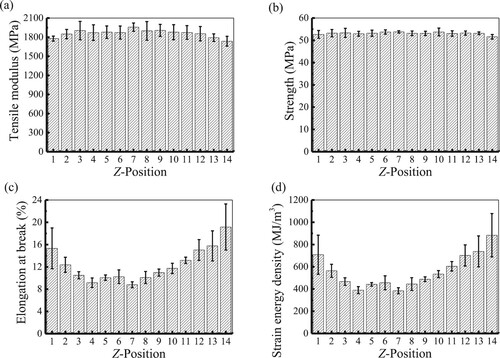
The mechanical properties of the specimens printed at the different layers (i.e. 2-4-Z) of the chamber are shown in . Specimens printed on the middle layers had a greater tensile modulus than those at the boundaries. The tensile modulus of the specimen printed at location 2-4-7 was about 12% higher than that of the specimen printed at location 2-4-14. The value of elongation at break achieved for the specimen printed at location 2-4-14 was approximately 2.2 times the lowest value for the specimen at location 2-4-7. The strain energy density was also lower in the centre region and higher at the boundaries. The lowest and highest values of strain energy density occurred at locations 2-4-7 and 2-4-14, respectively. Note that the general trend observed from all specimens printed in layers 1, 7, and 14 respectively, as shown in Figure C1, Appendix C, agrees with the result of the specimens printed at locations across 2-4-Z. It was seen that the specimens in the middle layer (i.e. layer 7) has greater tensile modulus than those located in the top-most layer (i.e. layer 14). The elongation at break value of the specimens in the top-most layer was also shown to be greatest, followed by those in the bottom-most layer (i.e. layer 1), and those in the middle layer has the smallest value.
The mechanical properties of the two groups of specimens printed at different Y- and Z- positions (i.e. locations 2-Y-7 and 2-4-Z) showed similar trends, respectively. Both groups of specimens showed higher tensile moduli towards the centre region. For the elongation at break and strain energy density, the trend showed a higher value at the bottom and top regions and a much lower value in the centre region. Despite the locations of the printing, the strength of the two groups of specimens was still comparable. To have a better understanding on the effect of build positions on the mechanical behaviour of the MJF printed specimens, a direct comparison of their strength, tensile modulus, and elongation at break was performed, and the results are shown in .
Figure 12. Comparison of the strength, tensile modulus, and elongation at break of specimens printed at locations: (a) 2-Y-7 and (b) 2-4-Z.
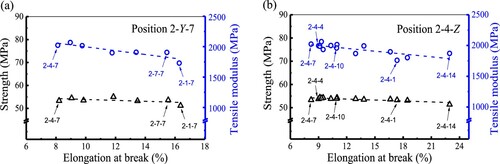
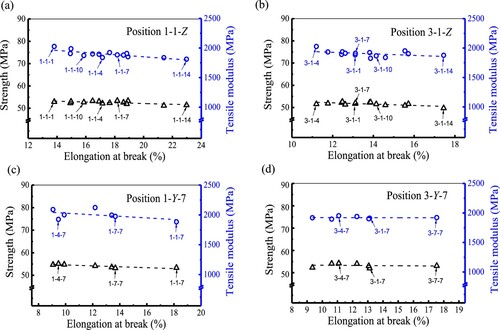
Based on the observation in both scenarios, a slight decrease in the strength and tensile modulus leads to a large improvement in the elongation at break. The specimens printed at the boundaries generally have a larger elongation at break than those in the centre. only considers the results of the specimens printed at different Y-positions in the centre column of layer 7 and the centre position of different layers in the chamber. To verify that this trend is consistent throughout the chamber, uniaxial tests have been conducted on specimens printed at other positions, and the results are shown in . The locations of specimens chosen for further investigation were the edge of different layers (i.e. locations 1-1-Z and 3-1-Z) and different Y-positions in the middle layer (i.e. locations 1-Y-7 and 3-Y-7). The observed trend in was similar to that in , where higher values of elongation at break of the printed part can be achieved at the slight expense of the tensile modulus and strength.
Figure 13. Comparison of the strength, tensile modulus, and elongation at break of specimens printed at locations: (a) 1-1-Z, (b) 3-1-Z, (c) 1-Y-7, and (d) 3-Y-7.
The strength data (49.7 MPa to 53.8 MPa) reported here is higher than that reported by Cai et al. (48.7 MPa) (Cai et al. Citation2021). Note that the parts were printed by HP Jet Fusion 3D 4200 in the work by Cai et al. (Citation2021), while HP Jet Fusion 3D 5200 (the newest commercial printer by HP Inc.) was employed in this work. The variation in the strength data might be due to the different printing parameter in HP Jet Fusion 3D 5200. It is noted that the strength data reported by Cai et al. (Citation2021) is also higher than those reported by Sillani et al. (Citation2019), O’Connor, Dickson, and Dowling (Citation2018), and Xu et al. (Citation2019). The reason could be the higher crosshead displacement speed used in the work of Cai et al. (Citation2021) than that used in others’ work. Normally, a higher loading speed results in the higher strength of printed polymer materials. Thus, both the high loading speed and the different optical printing parameter in HP Jet Fusion 3D 5200 could be the cause of the higher strength obtained in this work.
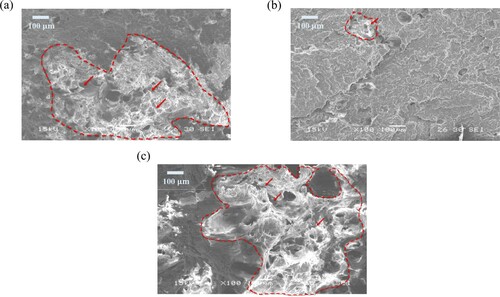
The fracture surfaces of the MJF PA12 specimens printed at locations 2-4-1, 2-4-7, and 2-4-14 were obtained using SEM, as shown in . The SEM image ((b)) shows that the specimen at location 2-4-7 exhibited a relatively flat fracture surface with only a small region of filaments, which indicates a semi-brittle-like behaviour. On the other hand, both (a) and (c) show a much larger filament region than (b), which indicates a ductile-like fracture surface. The specimen at location 2-4-14 exhibited an even larger region of filaments than that at location 2-4-1. The results reveal that the specimens printed at the topmost layer (i.e. layer 14) exhibited the most ductile properties, followed by the bottommost layer (i.e. layer 1), while the middle layer (i.e. layer 7) showed brittle-like properties.
Figure 14. SEM images of the fractured parts printed at locations (a) 2-4-1, (b) 2-4-7, and (c) 2-4-14. The region of filaments is indicated by the red dash curve.
3.4. Relations between cooling history, crystallinity, and tensile mechanical properties
Specimens printed in the centre region (i.e. location 2-4-7) had higher tensile moduli than those at the boundaries (i.e. locations 2-4-1, 2-4-14, 2-1-1, and 2-1-7) as shown in and . Moreover, the crystallinity of the specimens in the centre region was significantly higher than that of the specimens at the boundaries as shown in . The results reveal that a higher crystallinity induces a higher tensile modulus, and hence an increased rigidity of polymers. The increased rigidity further reduces the mobility of molecular chains, thus leading to low fracture strain (Zhang et al. Citation2017). It is supported by the uniaxial tensile test results in and , where the elongation at break of the specimens in the centre region was significantly lower than that of the specimens at the boundaries. The strength of parts in the centre region was slightly higher than those at the boundaries. However, the maximum deviation of strength at different locations (, where
and
are the maximum and minimum values of strength) was less than 7%. It indicates that the effect of the position on the strength of parts is sufficiently small to be neglected.
As shown in , the specimens with higher crystallinity tended to have a larger crystallite size, indicating that the higher crystallinity might be initiated from the larger crystallite size. The relatively large crystallite size mainly occurred in the specimens printed in the centre region where the cooling rate was lower. The low cooling rate is favourable for crystal growth (Carmeli, Cavallo, and Tranchida Citation2021; Cao et al. Citation2017).
Although the specimens in layers 1 and 14, as shown in (b), were both located at the boundary, the specimen at the top boundary (layer 14) had a lower crystallinity than that at the bottom boundary (layer 1). This could be because the crystallization of the specimens on the bottom layer has begun while the printing process is still ongoing for the remaining layers. On the other hand, the crystallization of the specimens on the top layer starts right after the printing job is completed. This is supported by the observations from the cooling history as shown in (b) whereby the specimens on layer 1 experienced the first stage of cooling while those on layer 14 hardly experienced this stage.
This work focuses on the parts printed in the X-build orientation such that the loading direction is parallel to the sintering interfaces. Hence, the potential impact of the sintering interfaces on the results of the mechanical properties is minimised. The main factor that influences the mechanical properties of printed parts would be the cooling processes. As the cooling rate in the centre region of the build chamber is lower than that at the boundaries, the crystallinity of specimens printed at those locations will be higher, resulting in the smaller elongation at break than those located at the boundaries. In the work of Bourell and Leigh (Citation2020), they investigated the SLS-printed parts in the Z-build orientation where the loading direction was perpendicular to the sintering interfaces. Thus, the main factor affecting the mechanical properties could be the sintering interfaces (Kiani et al. Citation2020). Similar to our work, the parts at the boundaries had a relatively higher cooling rate than those in the centre region. Although the parts at the boundaries had lower crystallinity than those in the centre region, the sintering interfaces could be weaker, which finally resulted in the smaller elongation at break of the parts located at the boundaries. One important point to note is that the material used in the work done by Bourell and Leigh (Citation2020) is PA11 while that in our work is PA12. The effect of sintering interfaces and crystallinity of the parts might be different for PA11 and PA12.
4. Conclusions
The effects of build positions on the thermal history, crystallization, and mechanical properties of MJF PA12 parts were investigated. The entire thermal history of the parts printed at different locations can be obtained by the Thermal Prediction Engine, which enables us to investigate the influence of thermal history on the crystallization of the printed parts. The parts printed at the centre region have relatively high crystallinity/density as the cooling process involves the low cooling rate and the long duration at elevated temperature which promotes crystal growth.
Specimens printed in the middle region generally has a lower value in tensile modulus and strength as compared to those at the edges. The maximum percentage differences in the tensile modulus and strength of specimens along the y-axis (i.e. Y-positions: 2-Y-7) were 11.5% and 8.7% respectively. For those along the z-axis (i.e. Z-positions: 2-4-Z), differences of 12.7% and 4.3% respectively, were observed. The effect of the build position on the elongation at break was larger than that on the tensile modulus and strength. It was found that the elongation at break and strain energy density of specimens located along the y-axis showed maximum percentage differences of 59.8% and 65.0%, respectively. For those located along the z-axis, differences of 117.7% and 129.8% for the elongation at break and strain energy density were observed, respectively.
The parts printed in the centre region of the chamber demonstrated smaller elongation at break and strain energy density than those printed at the boundaries. Such different mechanical properties are mainly due to the shortened strain hardening stage for the parts with high crystallinity. This study serves as guidance for optimisation of parts distribution in the printing chamber and demonstrates the reproducibility of MJF-printed parts for industrial applications.
Acknowledgments
The authors would like to acknowledge Facility for Analysis Characterization Testing and Simulation (FACTS), Nanyang Technological University, for the use of their X-ray facilities. The Thermal Prediction Engine is a research software created by HP Labs’ 3D Digital Twin research group. The authors would like to acknowledge the key contributors including Rachel Chen, Sunil Kothari, Maria Fabiola Leyva, Carlos A. Lopez, and Jake Wright.
Disclosure statement
No potential conflict of interest was reported by the author(s).
Additional information
Funding
Notes on contributors
Kaijuan Chen
Kaijuan Chen is a Research Fellow in HP-NTU Digital Manufacturing Corporate Lab, Nanyang Technological University, Singapore.
Zhi Hui Koh
Zhi Hui Koh is a PhD Candidate in Singapore Centre for 3D Printing, School of Mechanical and Aerospace Engineering, Nanyang Technological University, Singapore.
Kim Quy Le
Kim Quy Le is a Research Fellow in HP-NTU Digital Manufacturing Corporate Lab, Nanyang Technological University, Singapore.
How Wei Benjamin Teo
How Wei Benjamin Teo is a Research Fellow in HP-NTU Digital Manufacturing Corporate Lab, Nanyang Technological University, Singapore.
Han Zheng
Han Zheng is a PhD Candidate in Environmental Process Modeling Centre, Nanyang Environment and Water Research Institute, Singapore.
Jun Zeng
Jun Zeng is a principal investigator in HP-NTU Digital Manufacturing Corporate Lab. Nanyang Technology University, Singapore and a HP's Distinguished Technologist and manager for software research at 3D Lab. HP Labs, HP Inc., Palo Alto, California, USA.
Kun Zhou
Kun Zhou is an Associate Professor in HP-NTU Digital Manufacturing Corporate Lab, School of Mechanical and Aerospace Engineering, Nanyang Technological University, Singapore.
Hejun Du
Hejun Du is an Associate Professor in the School of Mechanical and Aerospace Engineering, Nanyang Technological University, Singapore. He is also a principal investigator in HP-NTU Digital Manufacturing Corporate Lab, and Singapore Centre for 3D Printing at NTU.
References
- A. International. 2013. Standard terminology for additive manufacturing — Coordinate systems and test methodologies, 2013.
- A. International. 2014. ASTM Designation: D638—14 Standard Test Method for Tensile Properties of Plastics.
- Balemans, C., S. F. S. P. Looijmans, G. Grosso, M. A. Hulsen, and P. D. Anderson. 2020. “Numerical Analysis of the Crystallization Kinetics in SLS.” Additive Manufacturing 33: 101126.
- Bourell, D. L., and D. K. Leigh. 2020. “Improvements in Ductility and Reliability of Mechanical Properties of Polyamide 11 Produced Using Laser-Based Powder Bed Fusion.” JOM Journal of the Minerals Metals and Materials Society 72: 1009–1015.
- Cai, C., W. S. Tey, J. Chen, W. Zhu, X. Liu, T. Liu, L. Zhao, and K. Zhou. 2021. “Comparative Study on 3D Printing of Polyamide 12 by Selective Laser Sintering and Multi jet Fusion.” Journal of Materials Processing Technology 288: 116882.
- Cao, L., A. Zheng, X. Cao, D. Yuan, C. Xu, and Y. Chen. 2017. “Morphology and non-Isothermal Crystallization of Dynamically Vulcanized PP/EPDM Blends in Situ Compatibilized via Magnesium Dimethacrylate.” Polymer Testing 62: 68–78.
- Carmeli, E., D. Cavallo, and D. Tranchida. 2021. “Instrument for Mimicking Fast Cooling Conditions of Polymers: Design and Case Studies on Polypropylene.” Polymer Testing 97: 107164.
- Chen, K., H. W. Benjamin Teo, W. Rao, G. Kang, K. Zhou, J. Zeng, and H. Du. 2021. “Experimental and Modeling Investigation on the Viscoelastic-Viscoplastic Deformation of Polyamide 12 Printed by Multi Jet Fusion.” International Journal of Plasticity 143: 103029.
- Craft, G., J. Nussbaum, N. Crane, and J. P. Harmon. 2018. “Impact of Extended Sintering Times on Mechanical Properties in PA-12 Parts Produced by Powderbed Fusion Processes.” Additive Manufacturing 22: 800–806.
- Czelusniak, T., and F. L. Amorim. 2021. “Influence of Energy Density on Polyamide 12 Processed by SLS: From Physical and Mechanical Properties to Microstructural and Crystallization Evolution.” Rapid Prototyping Journal 6: 1189–1205.
- Dencheva, N., T. G. Nunes, M. J. Oliveira, and Z. Denchev. 2005. “Crystalline Structure of Polyamide 12 as Revealed by Solid-State 13 C NMR and Synchrotron WAXS and SAXS.” Journal of Polymer Science Part B: Polymer Physics 43: 3720–3733.
- Galati, M., F. Calignano, S. Defanti, and L. Denti. 2020. “Disclosing the Build-up Mechanisms of Multi jet Fusion: Experimental Insight Into the Characteristics of Starting Materials and Finished Parts.” Journal of Manufacturing Processes 57: 244–253.
- Guo, B., Z. Xu, X. Luo, and J. Bai. 2021. “A Detailed Evaluation of Surface,: Thermal, and Flammable Properties of Polyamide 12/Glass Beads Composites Fabricated by Multi jet Fusion.” Virtual and Physical Prototyping 16: S39–S52.
- Habib, F. N., P. Iovenitti, S. H. Masood, and M. Nikzad. 2018. “Fabrication of Polymeric Lattice Structures for Optimum Energy Absorption Using Multi Jet Fusion Technology.” Materials & Design 155: 86–98.
- Hopkinson, N., and P. Erasenthiran. 2004. “High Speed Sintering - Early Research Into a new Rapid Manufacturing Process." Proceeding of 15th Solid Freeform Frabrication Symposium, Austin, Texas, 312–320.
- Hou, G., H. Zhu, and D. Xie. 2020. “The Influence of SLS Process Parameters on the Tensile Strength of PA2200 Powder.” IOP Conference Series: Earth and Environmental Science 571: 012111.
- Jain, P. K., P. M. Pandey, and P. V. M. Rao. 2008. “Experimental Investigations for Improving Part Strength in Selective Laser Sintering.” Virtual and Physical Prototyping 3: 177–188.
- Kiani, A., S. Khazaee, M. Badrossamay, E. Foroozmehr, and M. Karevan. 2020. “An Investigation Into Thermal History and Its Correlation with Mechanical Properties of PA12 Parts Produced by Selective Laser Sintering Process.” Journal of Materials Engineering and Performance 29: 832–840.
- Li, L., M. H. J. Koch, and W. H. De Jeu. 2003. “Crystalline Structure and Morphology in Nylon-12: A Small- and Wide-Angle X-ray Scattering Study.” Macromolecules 36: 1626–1632.
- Li, J., S. Yuan, J. Zhu, S. Li, and W. Zhang. 2020. “Numerical Model and Experimental Validation for Laser Sinterable Semi-Crystalline Polymer: Shrinkage and Warping.” Polymers 12 (6): 1373.
- Liu, Z., P. Zhang, M. Yan, Y. Xie, and G. Huang. 2019. “Additive Manufacturing of Specific Ankle-Foot Orthoses for Persons After Stroke: A Preliminary Study Based on Gait Analysis Data.” Mathematical Biosciences and Engineering 16: 8134–8143.
- Mele, M., G. Campana, G. Pisaneschi, and G. L. Monti. 2020. “Investigation Into Effects of Cooling Rate on Properties of Polyamide 12 Parts in the Multi jet Fusion Process.” Rapid Prototyping Journal 26: 1789–1795.
- Morales-Planas, S., J. Minguella-Canela, J. Lluma-Fuentes, J. A. Travieso-Rodriguez, and A. A. García-Granada. 2018. “Multi Jet Fusion PA12 Manufacturing Parameters for Watertightness, Strength and Tolerances.” Materials (Basel) 11: 1–11.
- Nelson, J. A., A. E. W. Rennie, T. N. Abram, G. R. Bennett, A. C. Adiele, M. Tripp, M. Wood, and G. Galloway. 2015. “Effect of Process Conditions on Temperature Distribution in the Powder bed During Laser Sintering of Polyamide-12, J.” Journal of Thermal Engineering 1: 159–165.
- Nogueira, B. R., J. F. T. Martins, R. R. Oliveira, and E. A. B. Moura. 2011. Crystallinity Changes of Electron-Beam Irradiated Ethylene-Vinyl Alcohol Copolymer (Evoh) As a Function of Radiation Dose, Int. Nucl. Atl. Conf. - Ina. 2011.
- Nussbaum, J., and N. B. Crane. 2018. “Evaluation of Processing Variables in Polymer Projection Sintering.” Rapid Prototyping Journal 24: 880–885.
- O’Connor, H. J., A. N. Dickson, and D. P. Dowling. 2018. “Evaluation of the Mechanical Performance of Polymer Parts Fabricated Using a Production Scale Multi jet Fusion Printing Process.” Additive Manufacturing 22: 381–387.
- Palma, T., M. Munther, P. Damasus, S. Salari, A. Beheshti, and K. Davami. 2019. “Multiscale Mechanical and Tribological Characterizations of Additively Manufactured Polyamide 12 Parts with Different Print Orientations.” Journal of Manufacturing Processes 40: 76–83.
- Rao, B. S., N. Maramu, E. V. Rao, N. S. Rao, and K. Rajendra Prasad. 2013. Deconvolution of X-ray Diffraction Spectrum of Polypropylene, 1–4. www.stmjournals.com.
- Rosso, S., R. Meneghello, L. Biasetto, L. Grigolato, G. Concheri, and G. Savio. 2020. “In-depth Comparison of Polyamide 12 Parts Manufactured by Multi Jet Fusion and Selective Laser Sintering.” Additive Manufacturing 36: 101713.
- Sillani, F., R. G. Kleijnen, M. Vetterli, M. Schmid, and K. Wegener. 2019. “Selective Laser Sintering and Multi jet Fusion: Process-Induced Modification of the raw Materials and Analyses of Parts Performance.” Additive Manufacturing 27: 32–41.
- Sutton, A. T., C. S. Kriewall, M. C. Leu, and J. W. Newkirk. 2017. “Powder Characterisation Techniques and Effects of Powder Characteristics on Part Properties in Powder-bed Fusion Processes.” Virtual and Physical Prototyping 12: 3–29.
- Tamburrino, F., S. Barone, A. Paoli, and A. V. Razionale. 2021. “Post-processing Treatments to Enhance Additively Manufactured Polymeric Parts: A Review.” Virtual and Physical Prototyping 16: 218–251.
- Tan, H. W., and Y. Y. C. Choong. 2021. “Additive Manufacturing in COVID-19: Recognising the Challenges and Driving for Assurance.” Virtual and Physical Prototyping 16: 498–503.
- Tan, P., F. Shen, W. S. Tey, and K. Zhou. 2021. “A Numerical Study on the Packing Quality of Fibre/Polymer Composite Powder for Powder bed Fusion Additive Manufacturing.” Virtual and Physical Prototyping 16: S1–S18.
- Thomas, H. R., N. Hopkinson, and P. Erasenthiran. 2006. High speed sintering - Continuing research into a new rapid manufacturing process, 17th Solid Free. Fabr. Symp. SFF 2006. 682–691.
- Udayakumar, M., M. Kollár, F. Kristály, M. Leskó, T. Szabó, K. Marossy, I. Tasnádi, and Z. Németh. 2020. “Temperature and Time Dependence of the Solvent-Induced Crystallization of Poly(L-Lactide).” Polymers (Basel) 12: 1–16.
- Van Hooreweder, B., D. Moens, R. Boonen, J. P. Kruth, and P. Sas. 2013. “On the Difference in Material Structure and Fatigue Properties of Nylon Specimens Produced by Injection Molding and Selective Laser Sintering.” Polymer Testing 32: 972–981.
- Xu, Z., Y. Wang, D. Wu, K. P. Ananth, and J. Bai. 2019. “The Process and Performance Comparison of Polyamide 12 Manufactured by Multi jet Fusion and Selective Laser Sintering.” Journal of Manufacturing Processes 47: 419–426.
- Zarringhalam, H., C. Majewski, and N. Hopkinson. 2009. “Degree of Particle Melt in Nylon-12 Selective Laser-Sintered Parts.” Rapid Prototyping Journal 15: 126–132.
- Zhang, W., J. Li, Y. Shang, H. Li, S. Jiang, and L. An. 2017. “Temperature Dependence of Tensile Behavior in Poly(Butylene Terephthalate) with Different Crystallinity.” Materials & Design 129: 143–150.
- Zhao, M., K. Wudy, and D. Drummer. 2018. “Crystallization Kinetics of Polyamide 12 During Selective Laser Sintering.” Polymers 10 (2): 168.
- Zhu, Z., and C. Majewski. 2020. “Understanding Pore Formation and the Effect on Mechanical Properties of High Speed Sintered Polyamide-12 Parts: A Focus on Energy Input.” Materials & Design 194: 108937.
Appendices
Appendix A: Simulation parameters and validation result of MJF Thermal Prediction Engine
Table A1. Simulation parameters used in HP Thermal Engine Prediction software.
Figure A1. (a) The top view of the printed job, (b) the positions of the thermal couples for temperature recording along the z-axis, (c) the predicted and experimental results of the temperature history at the centre region, and (d) the predicted and experimental results of the temperature history at the upper right region. Note that the time (x-axis) is normalised by the ‘production time’ and the temperature (y-axis) is normalised by the ‘ambient temperature’.
Appendix B: relation between the density and crystallinity
The relationship between the mass and the density of printed part is written as
(B1)
(B1) where
is the average density of the printed part and
is the total volume of the part. Since the printed part is comprised of pores, the amorphous phase, and the crystalline phase (α-phase crystal polymorph and γ-phase crystal polymorph), the total volume can be decomposed into three parts as
(B2)
(B2) where
is the volume of pores,
is the volume of the amorphous phase, and
is the volume of the crystalline phase.
Therefore, the mass of the printed part in Equation (A1) can be written as
(B3)
(B3) where
and
are the densities of air, the amorphous phase, and the crystalline phase, respectively. As the γ-phase crystal polymorph is the main crystalline phase in MJF PA12, the density and volume of crystalline phase can be presented by those of γ-phase crystal polymorph for simplicity. At room environment, the densities of air, the amorphous phase, and the crystalline phase of PA12 are
and
, respectively (Li et al. Citation2020).
The combination of Eqs. (B1) and (B3) yields
(B4)
(B4)
,
and
can be defined as
(B5)
(B5) where
is the volume fraction of pores, which equals to the porosity of printed part;
is the volume fraction of the crystalline phase, which can be considered as the crystallinity of the printed part.
The substitution of Equation (B5) into Equation (B4) yields
(B6)
(B6) Based on the work by Chen et al. (Citation2021), the porosity of MJF PA12 is approximately 4.0% (
). Thus, the relation between the crystallinity and density can be given as follows.
For the printed part with the highest density (), the crystallinity can be calculated by Equation (B6), which equals to 54.3%. Similarly, for the printed part with the lowest density (
), the crystallinity equals to 36.4%. It is clearly seen that higher density corresponds to higher crystallinity. Besides, the crystallinity of the printed material with the highest density is only 17.9% higher than that of the printed material with the lowest one. Note that the variation of 17.9% is from the crystallinity of 36.4% to 54.3%. It indicates that the change of 17.9% in crystallinity has correlation with the different density of printed parts in this work.
Appendix C: mechanical properties of specimens located in layers 1, 7, and 14
Figure C1. (a) Tensile modulus, (b) strength, and (c) elongation at break of all specimens printed in layer 1 (i.e. the bottom-most layer), layer 7 (i.e. the middle layer) and layer 14 (i.e. the top-most layer).