
 ?Mathematical formulae have been encoded as MathML and are displayed in this HTML version using MathJax in order to improve their display. Uncheck the box to turn MathJax off. This feature requires Javascript. Click on a formula to zoom.
ABSTRACT
The fabrication of polymer–metal hybrids in an additive process makes it possible to further improve the geometrical and material adaption in a multi-material design. In this work, PLA is fabricated through a fused filament fabrication process on AlSi10Mg structures manufactured by laser powder bed fusion. The mechanical connection is realised by form fit, for which different geometries are examined through tensile tests. Deep penetration of the PLA into the metallic structures is achieved by optimisation of the process parameters. The penetration depth is assessed through the use of micro-computed tomography. Finally, the interplay of mechanisms leading to a firm connection is discussed.
1. Introduction
The available choice of materials in additive manufacturing is constantly growing, offering both new fields of application and increased lightweight construction potential. For example, many alloys such as AlSi10Mg, 316L or CuCrZr alloys can now be processed in laser powder bed fusion (LPBF) manufacturing. The availability of materials in the fused filament fabrication (FFF) process is also increasing steadily. A wide variety of polymers, such as PLA, PC or ASA as well as fibre-reinforced polymers are available. The combination of different filament stocks through multiple extruders enables the combination of different polymers. In LPBF, multi-material fabrication is still somewhat experimental. Different research groups have shown multi-material LPBF to be possible using different strategies of powder distribution (Chen et al. Citation2019; Demir and Previtali Citation2017; Liu et al. Citation2014). For example, Liu et al. (Citation2014) have fabricated 316L/C18400 copper material through the use of a separator in the recoater and achieved metallurgical bonding. However, the assembly of components from polymer and metal fabricating processes still mostly takes place by joining processes such as gluing, screwing or welding. For instance, Tang et al. (Citation2018) joined LPBF-fabricated stainless steel cellular structures with FFF-fabricated ABS by ultrasonic welding. The joint reached 55% of the ABS material strength. Intrinsic hybridisation through simultaneous execution of the manufacturing processes would allow an increase in design freedom by eliminating assembly. Therefore, a combination of these processes is desired to produce hybrid components with high geometric complexity. A potential application of such a combined process would be the production of customised grippers that combine the properties of polymer and metal without an assembly step.
In principle, the micron-size roughness of the metal part can be used to establish a bonding between polymer and metal. Lucchetta, Marinello, and Bariani (Citation2011) used the injection moulding process to produce polymer metal hybrids and examined the influence of the micron-size roughness of an aluminium substrate on the shear strength of the polymer metal interface. They found that a higher temperature of the metal part improved the infiltration of the thermoplastic melt into the micrometre-sized roughness of the metal part. Differences in the micron-size roughness only played a minor role if the preheating temperature of the metal part was in the range of the processing temperature of the polymer. Also investigations on the tensile strength of bonded polymer metal parts have been conducted. Kleffel and Drummer (Citation2017) electrochemically treated the surface of an aluminium sheet and produced polymer metal hybrids in the injection moulding process. They measured the tensile strength of the interface and found that the tensile strength does not correlate with roughness parameters but with the presence of undercuts. In these two studies, there is an injection pressure above 300 bar and the surface was shot peened or electrochemically treated. This pressure and the surface treatment methods aren't feasible in a combined LPBF and FFF process. In comparison, Bechtel et al. (Citation2020) used the FFF process to create a bond between polymer and a metal sheet. They investigated the influence of the preheating temperature of the sheet on the shear strength of the joint and found that the preheating temperature for PLA must be above 180C to achieve significant shear strength. Furthermore, as the preheating temperature increases, the shear strength increases. They justified this with the decreasing viscosity, so that the wetting angle becomes smaller. In addition to microscopic roughness, macroscopic undercuts can also be used to achieve a bond between metal and polymer. Weflen and Frank (Citation2021) fabricated polymer metal hybrids by extruding carbon fibre-reinforced ABS into a machined interlocking root structure in aluminium. Macroscopic undercuts can also be created with the LPBF process. Such undercuts have already been used to join LPBF and FFF components. Leuteritz et al. (Citation2020) fabricated a single conical cavity with undercuts in the size range of several millimetres in LPBF AlSi10Mg geometries and filled these cavities in an FFF machine. To fill the cavities, the nozzle was placed centrally above the cavity and the amount of material equivalent to the volume of the cavity was extruded. It was found that a high extrusion rate of the polymer eased filling of the cavity. Slower filling resulted in too early solidification of the polymer. Afterwards a section above this layer was fabricated in an FFF process. The tensile strength of these joints was in the range of the PLA tensile strength. Most of the specimens encountered failure through a fracture of the polymer in the interface region, although some specimens failed through a pull out of the polymer structure. Chueh et al. (Citation2020) used a combined LPBF FFF process with an additional consolidation step to manufacture hybrid 316L/PET specimens. Therefore an array of 2 mm wide and high structures was manufactured on top of the LPBF part of a specimen. Then polymer was deployed on these structures. Afterwards the polymer was heated by a defocused laser and pressed into the interlocking structures by a punch. The consolidation step led to a good impregnation of the interlocking structures. The polymer also infiltrated microscopic pores and surface roughness of the structures. Tensile tests of the hybrid specimens showed fracture in the FFF manufactured part and not in the interface region. This was attributed to the densified structure of the polymer in the interface region which reduced the weak points caused by the interfaces between the FFF layers. Shear strength of the hybrid parts was slightly lower and fracture occurred at the top of the interlocking structures. This was explained by the reduced load bearing area at this location.
So far the group of Leuteritz et al. (Citation2020) fabricated only larger interlocking geometries and did not investigate how the structures actually interlocked. The group of Chueh et al. (Citation2020) achieved good mechanical interlocking joints through consolidating the connection with external force and heat input. Furthermore, the structures in these works were larger than the structures that will be examined in the present work. In this work, we will for the first time investigate joints in the sub-millimetre scale (150–750 μm) that are fabricated without external consolidation and onto which polymer can be applied in a standard FFF process. This size range is especially challenging as it corresponds to only a few multiples of an LPBF bead width. A focus is therefore on micro-computed tomography (μCT) investigation of the kind of structures that can actually be manufactured and how the polymer is filling the structures in comparison to the nominal geometry. Moreover, there is a lack of research on which process parameters are important to obtain good mechanical properties, so experiments with different printing parameters are conducted. The optimised parameters are used to fabricate specimens with different interlock geometries. Mechanical interlock quality is evaluated through tensile tests. The anisotropy of failure strength of the structure which shows the most promising results is then tested through edge shear tests. A simple simulation of the contact stresses induced by the thermal expansion of the polymer and the resulting warpage is carried out to investigate the contribution of the frictional forces to the joint strength.
2. Materials and methods
2.1. Materials
The chemical composition of the AlSi10Mg powder supplied from m4p GmbH with a D10 of 21.0 μm, a D50 of 35.3 μm and a D90 of 57.5 μm is shown in . The powder bulk density is specified as 1.50 g cm. For the FFF process, polylactide (PLA) from BASF was used. PLA was chosen for its excellent processability. The filament BASF Ultrafuse PLA has a recommended printing temperature range of 210–230
C and a glass transition temperature of 61
C (BASF 3D Printing Solutions BV Citation2020). The decomposition of the material starts at 250
C which indicates an upper limit for the nozzle temperature. A recommended printing speed range of 40–80 mm s
is given by the manufacturer. A tensile strength of 34 MPa in the XY-plane and 21 MPa between the layers is given in the data sheet.
Table 1. Chemical composition of m4p AlSi10Mg powder.
2.2. Hybrid additive manufacturing procedure
The specimens were manufactured in a multi-stage process consisting of the fabrication of a base structure in the LPBF process and the fabrication of a PLA section on top in the FFF process. For the production of the LPBF part of the specimens an ORLAS Creator machine was used. The machine is equipped with a 250 W Yb fibre laser and a cylindrical build platform with a diameter of 110 mm. The build jobs were created using the software Cura version 4.7.1. The generated FFF G-code was subsequently converted to ORLAS compatible G-code using the in-house developed software GCode2GCode which is available at sourceforge (https://sourceforge.net/projects/ctfam/). GCode2GCode works by reinterpreting the FFF parameters as LPBF parameters (e.g. the nozzle temperature parameter as laser power parameter) and adjusting the G-code commands to fit to the LPBF machine. The specimens were fabricated with a laser power of 245 W, a scan speed of 1000 mm s, 30 μm layer height and 140 μm line spacing using Argon as shielding gas. Residual powder on the LPBF structures was only removed by a vacuum cleaner, especially the samples were not rinsed with fluids and were left on the metallic build plate. This was done to gain insights that can later be transferred to an in-situ FFF printing process inside the LPBF chamber. For the production of the PLA section of the specimens, a custom made FFF printer was used. This printer was developed and configured in-house and the material flow is not actively controlled. The printer has a direct drive extruder with an E3D-v6 hotend and a nozzle diameter of 0.4 mm. The electronic circuit board of the printer is an Duet 2 Ethernet with the firmware RepRap 2.05. The printer supports bed temperatures up to 119
C. Build jobs were also prepared with Cura version 4.7.1. A layer height of 0.2 mm, an extrusion width of 0.5 mm, a line distance of 0.47 mm, a print speed of 50 mm s
, two perimeters, an infill of 100% and an orientation of
were used for the generation of the G-code. Unless otherwise noted for specific experiments, for the first layer the infill was oriented with 0
while the nozzle temperature was set to 250
C, the bed temperature to 80
C and the cooling fan was turned off. The extrusion rate was set to fill the first layer and the empty space of the structure (see for the value of the extrusion multiplier used for each structure). A standard toolpath was used without alignment of the path to the geometric structures. This means that the nozzle was not placed precisely between the structures for extrusion, but rastered the surface with the standard FFF line distance. Parameters deviating from the values stated here are indicated in the corresponding results section and a list of the FFF parameters investigated for their influence on the mechanical properties is provided in the appendix in Table A1.
Table 2. Nominal dimensions of the examined interlocking structures.
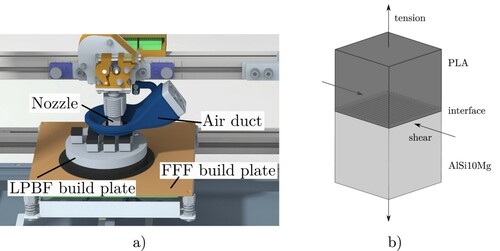
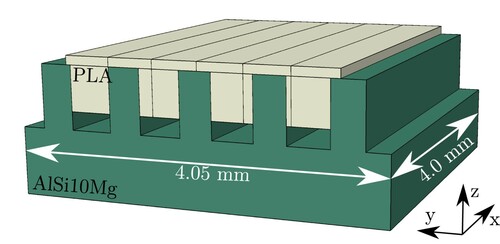
A ring with an inner diameter corresponding to the diameter of the LPBF build plate was fabricated on the build plate of the FFF machine to act as a mounting aid. The LPBF build plate was placed into the ring, which defined the translational position of the specimens on the build plate. Rotational alignment was performed by driving the nozzle at a defined position and rotating the build plate until alignment of the defined point was achieved. This position was then fixed with adhesive tape. (a) shows the manufacturing setup. The LPBF structures were preheated by heating the build platform of the FFF machine to 80C. The start of the FFF process was deferred for 20 min to ensure that the structures had a constant temperature. The distance of the nozzle to the metallic structures was calibrated by connecting the extruder and the build plate to a continuity tester. To this end, the nozzle was lowered in 50 μm steps until the continuity tester indicated contact. To ensure the nozzle always remained above the highest point of the structure at a layer height of 200 μm, a level 150 μm below the highest point was defined as the zero height for the FFF process. The FFF process starts with the nozzle one layer height above the zero height to extrude material. After the FFF process finished, the specimens were removed from the LPBF build plate by breaking off the support structures from the build plate.
Figure 1. Setup for manufacturing hybrid LPBF-FFF specimens. (a) The LPBF build plate was centred by a ring of PLA, the same material that composes the sample FFF layers. (b) CAD of manufactured specimen. PLA (dark) on AlSi10Mg with structured interface (light).
2.3. Specimen geometries
The specimens had a base area of mm and a height of 24 mm. The part of the specimen that was manufactured in the LPBF process had a height of 11 mm plus the height of the structures on it for the form fit. This part was also manufactured with a M8 internal thread to mount the specimen for the mechanical test. A schematic CAD rendering of the specimen geometry is visible in (b).
Different interlocking geometries were investigated. As a starting point, ridges with varying spacing were manufactured on top of the LPBF part generating a slot geometry. Two specimens of this geometry were fabricated to test which distances could be manufactured without getting unintentional connections between the ridges and to evaluate how the penetration depth of the PLA into the structures depends on the size of the cavities. To this end, the nominal spacing was varied from 150 to 600 μm in 150 μm steps. The ridges were designed to have 150 μm width, as this was the assumed width of a single weld bead. This caused the slicer to traverse each ridge with one scan vector. Based on the results of this investigation, different structures were designed for mechanical tests.
For mechanical testing of a structure without a nominal geometrical interlocking capability (in the direction normal to the surface), specimens of a slot geometry (cf. a) with a constant slot width of 515 μm, a height of 750 μm and 300 μm ridge width were manufactured. The nominal dimensions of all structures are given in . The T-slot geometry visible in (b) was also ground and polished to investigate how the PLA flows into cavities below the undercut. This geometry was also tested for strength.
Figure 2. Structured interface geometries, with PLA contents ranging from 50% to 80%. The dimensions are given in .
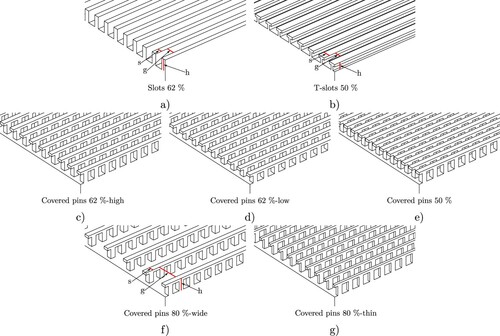
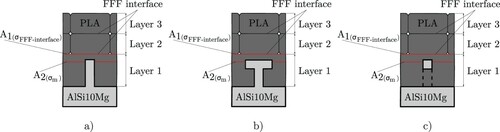
Lastly, different types of a ‘covered pins’ geometry were manufactured. This geometry had the purpose of providing undercuts with short flow distances for the PLA. The geometry was varied with respect to PLA ratio in the interface by varying the width of the structures and their spacing. The rationale behind these ratios is explained in , which shows an idealised unit cell of an interlocking structure. A denotes the area of the PLA at the top face of the structure, while A
denotes the interface between the first and second fabricated FFF layers. The tensile strength of additively manufactured PLA in z-direction corresponds to the FFF interface strength (
) and is given by the manufacturer as 21 MPa, while the tensile strength in a layer is 34 MPa which is assumed to be the material strength
. If the load in A
and A
is to be maximal relative to the local strength, the equation
(1)
(1) must apply, when a pure form fit is assumed. The area ratio in this case, therefore, results in
(2)
(2) Area proportions lower than this value should result in fracture of the PLA in the interlocks, due to exceeding the material strength, while higher proportions should lead to fracture between the PLA layers and not in the PLA/AlSi10Mg interface. The possibility of shear failure of the undercut parts in structures (b) and (c) is neglected in this model. In this model, complete filling of the interlocking structures with PLA is assumed, although undercut regions cannot be filled directly by the nozzle. These regions must be filled by forcing molten PLA through subsequently extruded PLA into the structures.
Figure 3. Sketch of unit cells of interlocking structures (not to scale). The area of the interface between the first and second FFF layers is labelled A, while the area filled by the PLA in the PLA/AlSi10Mg interface is denoted by A
. The PLA base material has a tensile strength of
, while the interfaces of the FFF layers have a tensile strength of
. (a) Model for slots geometry (a); (b) model for T-slots geometry (b); (c) model for covered pins geometry (c–g).
shows the investigated geometrical parameters. For comparison, 50% were chosen as low ratio (see e) and 80% as high ratio (see f). The 300 µm wide structures result in a high gap width for the 80% structure, so a 150 µm wide structure was manufactured for comparison (cf. g). For the 62% PLA structures additionally the height of the structures was varied to 600 μm to evaluate a possible influence of the height (cf. d).
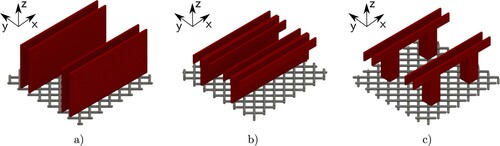
shows the paths that were generated by the slicer for the fabrication of the interlocking structures. The 300 μm wide slot geometry is fabricated by two parallel laser beam paths. The T-slot geometry consists of a single trajectory for the base and four trajectories on top. The pin structures of the covered pins geometry are scanned with a single rectangular path, while the cover on top is built equal to the paths for the slot geometry.
Figure 4. Laser trajectory used for the fabrication of interlocking structures rendered in Paraview (Ahrens, Geveci, and Law Citation2005). The paths used for the fabrication of the base specimen are shown in grey, while the paths for the interlocking structure are shown in red. The depicted area is mm in size. (a) Slot geometry; (b) T-slot geometry; (c) covered pins 62%-low geometry.
2.4. Material characterisation
2.4.1. μCT image acquisition and analysis
μCT images were recorded using a YXLON Precision μCT. An acceleration voltage of 165 kV and a target current of 0.09 mA were used to measure a total of 1860 projections on a Perkin Elmer XRD1620 AN flat panel detector with with a pixel pitch of 200 μm. For each projection, three measurements were recorded with an exposure time of 750 ms and averaged to reduce noise in the projection images. Reconstruction was carried out in VGStudio MAX 3.4 using the FDK algorithm. Segmentation of the different phases in the image was carried out using a region growing segmentation algorithm in VGStudio MAX. Actual nozzle distance was measured by finding the average height of the process induced voids located between first and second layers, which corresponds to the height of the upper side of the first FFF layer. The distance from this plane to the interlocking structures is equal to the actual average nozzle distance to a structure. It was measured at 100 points distributed across the specimens.
2.4.2. Mechanical testing
Tensile tests. The LPBF part of the specimens was fabricated with an M8 internal thread, which served as clamping for the tensile test, whereas the FFF part was gripped with wedge clamps. A pretension of 15 N was applied. The test parameters were chosen based on DIN EN ISO 527-1. The cross head speed was set to mm min–1. For each geometry or process setting, 10 specimens were tested. All following analyses are done on nominal stresses referring to the nominal cross section of the specimens of 225 mm.
Edge shear tests. The structure that showed the highest tensile strengths was also tested in an edge shear test. The experiment was conducted according to Weidenmann, Baumgärtner, and Haspel (Citation2015). The shear gap was set to 1 mm. This value was chosen to prevent the failure surface from being predetermined by the positioning of the shear surfaces. Ten specimens were tested with load applied perpendicular to the structures and 10 specimens were tested with the load applied parallel to the structures.
2.4.3. Preparation of cross sections
For the preparation of the hybrid specimens for optical microscopy, the specimens were embedded in resin and ground for 2 min per grit (grits 320, 600, 1000, 2500, 4000) at a clamping force of 10 N and a rotation speed of 120 rpm, while the specimen grip counter-rotated at 60 rpm. The specimens were polished and etched for 2 min with 2% NaOH solution.
2.5. Simulation model
2.5.1. Estimation of the process-related contact pressure on the contact surface
During the tensile tests, it turned out that the macroscopic form fit is not the only factor influencing the mechanical strength. The process induced irregular surface of the LPBF structure (mesoscopic form fit) or frictional effects (microscopic form fit), which can occur due to the warpage-related contact pressure to the metal surface, also influence the achieved interfacial strength. In order to separate the influences of this meso- or microscopic form fit, the process-induced contact pressure on the contact area of PLA and AlSi10Mg is evaluated. In the case of low contact pressures, friction would have a small effect on the strengths. An idealised FE model of the printing process is used to determine the contact pressure resulting from the thermal expansion and the resulting warpage of the polymer structure. The geometry of the LPBF structure corresponds to the geometry specified for the printing process of the slot-geometry in the G-code (cf. ).
Figure 5. Schematic geometry for estimating the contact pressure on the contact surfaces using FE simulation.
In a coupled thermomechanical simulation, the individual extruded polymer filaments in the FE model are each activated after 0.4 s according to the printing strategy, as shown in . The complete structure is then cooled to room temperature (25C). At the time of activation, the elements are assigned the nozzle temperature of 250
C as an initial condition. The flow depth of the polymer is assumed to be 0.6 mm, the width of the individual extruded filaments to be 0.5 mm, and their length to be 4 mm. The bottom surface of the AlSi10Mg structure is fixed in all directions. In addition, a temperature boundary condition is given here, which represents the heating plate during the process. This boundary condition heats the metal structure to 80
C during the printing process and is lowered to 25
C during the cooling process. According to Patankar (Patankar Citation1978, Citation1980), the heat transfer between PLA and AlSi10Mg can be assumed to be the harmonic mean of the respective thermal conductivity coefficients from with 0.24 Wm
K
The coefficients to account for convection and radiation effects are given in .
Figure 6. Illustration of the schematic reproduction of the printing process.
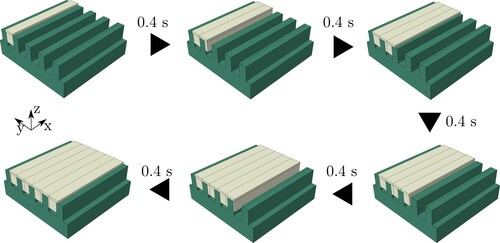
Table 3. Material parameters used for the simulation for AlSi10Mg and PLA. The values are taken from Wu, Wang, and An (Citation2017), BASF 3D Printing Solutions BV (Citation2020), Ferreira et al. (Citation2017), Louvis, Fox, and Sutcliffe (Citation2011), SD3D (Citation2014), 3D-Laserdruck GmbH i.G. (Citation2020), 3D Laser BW GmbH & Co. KG (Citation2021) and Rudolph, Chen, and Dick (Citation2019).
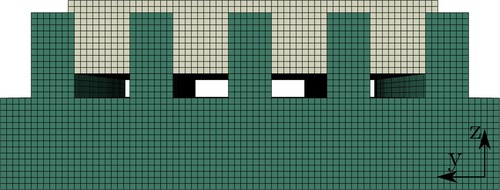
The model is discretised with trilinear thermally coupled elements with eight nodes and reduced integration (in the case of Abaqus: C3D8RT elements). The element size is 0.05 mm in the complete model. Corresponding discretisation is shown in . To estimate the normal forces that occur, the forces are evaluated after the polymer has cooled to 25C.
Figure 7. Discretisation of the model to estimate the normal forces on the contact surfaces.
2.5.2. Material modelling
Both the PLA and the AlSi10Mg used in the experiments are modelled with a linear elastic behaviour. Any plastic deformation or strain hardening that may occur, as well as crystallisation effects, are not considered. For estimating the contact stresses during the printing process, as described in Section 2.5.1, this conservative material modelling is considered sufficient. In order to estimate the heat transfer during the process and the resulting deformation, the heat conduction, the specific heat capacity and the thermal expansion must also be specified. shows the material parameters used.
3. Results
3.1. Manufacturability and polymer penetration
To assess the structure size that is possible to be manufactured in the process, two of the structures with varying slot widths were manufactured in the LPBF process and printed on with the FFF toolhead. (a) shows a metallographic cross-section of one of the structures (specimen A). The lightest phase corresponds to AlSi10Mg, the darkest phase to PLA, and the material in the slots and under the PLA to the embedding medium. Compared to the designed ridge width of 150 μm, the ridge width of the structures manufactured through a single scan vector in each layer was between 180 and 190 μm, which corresponds to the track width at this location in the sample. Subsequently, this deviation affected the widths of the slots, which were lower than intended. This relation is shown in (c) in black as a constant offset to the bisectrix that visualises the intended spacing. The depth of the penetration of the PLA into the gaps of the two specimens is shown in red in (c). It was measured as the average of the depth of penetration in all gaps with the same width. Since the slots were 750 μm high, this was the maximum possible penetration depth. The nominal 150 μm narrow gaps were almost not penetrated by the PLA (around 70–90 μm average penetration depth) while penetration depth increased with increasing gap width. In (b), a cross-section of the T-slot structure (cf. b) is shown. The opening between the structures was 450 μm wide and the gap was 450 μm deep. The PLA filled the structure down to the solid metal surface. It is apparent that the PLA was also able to penetrate into the undercut areas, although voids remained in the undercuts.
Figure 8. Cross-sections of hybrid specimens with dimensional measurements. (a) Cross-section of specimen A with varying slot distance. PLA penetration depth increased with increasing gap width. (b) Cross-section of specimen with T-slot geometry (cf. b). The PLA flowed into the cavities down to the metal surface and also partially filled the undercut voids. (c) The graph shows the actual gap width and the depth of penetration in two specimens with varying slot width (specimen A and B). The actual gap width is reduced about a constant offset to the nominal gap width. The depth of penetration increases with increasing slot width.
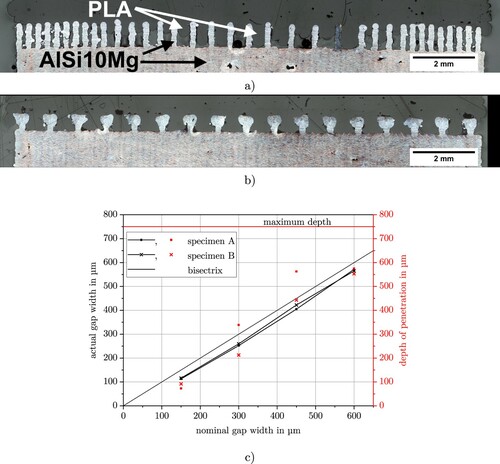
(b) also shows that the overhanging area of the T-slot geometry was produced with sloping instead of horizontal overhangs. This was due to the surface tension of the melt, which hindered an exact reproduction of the geometry. There are also process-related deviations between the structuring elements.
3.2. Analysis of FFF-Parameters
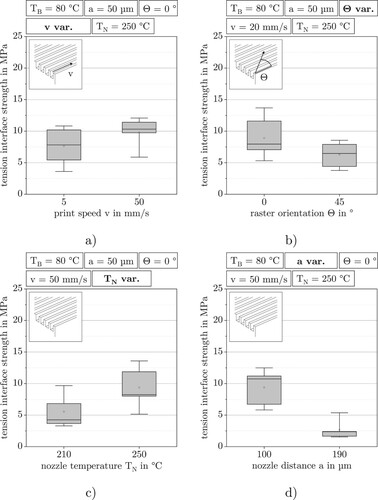
The influence of the FFF process parameters print speed, raster orientation, nozzle temperature and nozzle distance in the first layer on the mechanical strength of the joint was tested in a one parameter at a time approach on the slot geometry shown in (a). The effects found are depicted in (a) –(d). In each of the figures, the unchanged parameters are given for clarity. In all tests, a high scatter of the mechanical strength of the joint could be observed. There was a small influence of print speed on the interlock quality (see a). The tensile strength of the specimens manufactured with a speed of 5 mm s was lower on average (7.6 MPa) than the strength that could be achieved with speeds of 50 mm s
(9.8 MPa). (b) shows the results of a variation of the first layer orientation. 0
corresponds to the orientation of the slots. Orienting the FFF tracks in the first layer in this orientation yielded slightly higher average tensile strengths (8.9 MPa) than a 45
degree orientation of the tracks (6.3 MPa). (c) shows that the average tensile strength of specimens increased with higher nozzle temperatures. The average tensile strength of the specimens manufactured at 210
C was 5.5 MPa while the tensile strength of specimens fabricated with 250
C was 9.4 MPa. (d) depicts the impact of the nominal nozzle distance on the mechanical strength. The difference in nominal nozzle distance was created by building up a portion of the samples three layers lower in the LPBF process, which created a height difference of 90 μm. The increased distance resulted in a low tensile strength of 2.7 MPa compared to 9.4 MPa at the smaller nozzle distance.
Figure 9. Influence of FFF parameters on tensile strength. The whiskers of the box plot show the range from minimal to maximal measured value. A circle visualises the average and a line the median of the respective data. (a) A print speed of 50 mm s increased average tensile strength; (b) parallel orientation of paths resulted in minor improvement of tensile strength; (c) a higher nozzle temperature improved the joint strength; (d) a high dependence of tensile strength on nozzle distance was found.
3.3. μCT imaging
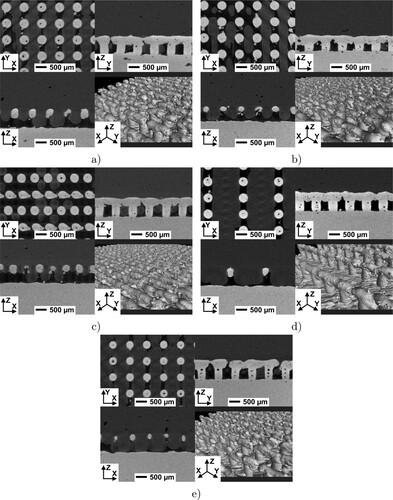
(a) shows slice images of the specimen with 62% PLA ratio and 750 μm height. The upper left part shows a slicing plane in the pin region of the structure, while the upper right part clips a covered line and the lower left slicing plane is perpendicular to this plane. It is visible that the pins were produced in a round shape instead of the desired rectangular shape. PLA partially flowed into the undercut regions of the structure but the depth of penetration varies. (b) shows slice images of the structure with the same PLA ratio and 600 μm height. The PLA penetrated the undercut parts less. In the 50% PLA structure, the PLA penetration is further reduced, with a higher variety in the penetration depth compared to higher PLA ratios. (d) shows slice images of the structure with 80% PLA and 300 μm wide structures. The PLA penetration between the lines is high as the PLA reaches the solid metal surface. In contrast only a small fraction of the PLA does flow into the undercuts here. In comparison, (e) shows the 80%-thin structure. Most of the PLA is located between the line structures (vertical in the upper left image) and a relative high amount was able to flow between the pins in the undercut.
Figure 10. Slice images of interlocking region of hybrid structures. AlSi10Mg is the brightest phase whereas PLA corresponds to the dark grey phase. The upper left part of the images shows a slice image in XY-plane at the height of the pins, while the slicing plane in the upper right part is clipping a covered line. The lower left part of each image shows a slice image perpendicular to the covered lines. The lower right images are 3D renderings of the AlSi10Mg parts: (a) covered pins 62%-high; (b) covered pins 62%-low; (c) covered pins 50%; (d) covered pins 80%-wide; (e) covered pins 80%-thin.
(a) shows a graph visualising the ideal composition of the material in the interlock location based on the CAD of the 62%-high geometry. Basically four regions can be differentiated: the mono-material AlSi10Mg region, the region of the pins, the region of the covering lines and the PLA mono-material region. In comparison, (b) shows a graph visualising the composition of the material in the interlock location of a specimen of the 62%-high geometry measured in μCT. For this graph, the μCT image was segmented into three phases (AlSi10Mg, PLA and air) and the area occupied by each material was measured in relation to the total area. The AlSi10Mg content is shown in red. In the region under the pins, the material consists of nearly 100% AlSi10Mg, apart from a few pores. Over the solid part the pins of the structure, contributing to approx. 25% of the material at this level, are located. The cover on top of the pins has a maximum area ratio of approx. 41% compared to 38% that was intended for it in CAD. The height for the measurement of the material composition at the cover was determined by the maximum of the AlSi10Mg ratio. The green dashed line visualises the desired proportion of PLA in the structure which corresponds to the rest of the area. In comparison PLA is not able to fill every void between the pins, so the PLA fraction is low in the lower parts of the structure (approx. 71% voids maximum). In the height where the cover of the pins is located, the difference between desired PLA fraction and real PLA fraction decreases as less voids are present (2.6%). The material composition in the 62%-low structure is similar in the AlSi10Mg part aside from the reduced height. The void percentage at the top of the interface is higher with 5.1%. Compared to the 62%-high specimen, the PLA ratio in the undercutting region (the region of nearly constant AlSi10Mg ratio, i.e. the pin structures) is low.
Figure 11. Composition of material in interlocking geometry of covered pins geometry: (a) ideal proportions in 62%-high structure; (b) 62%-high; (c): 62%-low; (d) 50%; (e) 80%-wide; (f) 80%-thin.
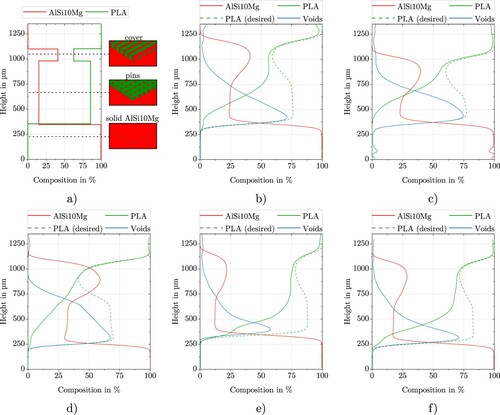
The voids in the cover region of the 50% PLA specimen (see d) contribute to 1.1% of the area. Below this plane, the PLA ratio is relatively lower than in the 62% specimens. The material composition in the 80%-wide specimen is shown in (e), while the material composition of the 80%-thin specimen is shown in (f). Although nominally equal (20%), the AlSi10Mg proportion is 22% in the wide specimen compared to 29% in the thin specimen. The PLA is filling the wide structure to a higher proportion in the lower heights than in the thin specimen. The maximum void proportion in the thin specimen is 71% compared to 57% in the wide specimen. The measured material proportions at the top of the interlocking structures are given in .
Table 4. Measured material composition at top of interlock. The ratios are measured at the height of local maximum AlSi10Mg content.
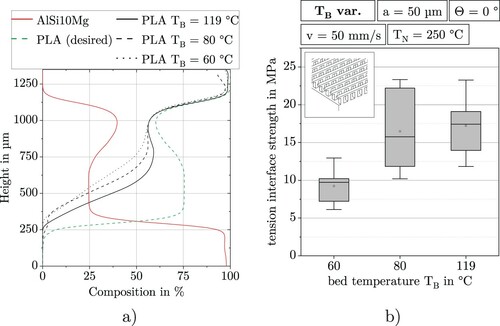
To further improve the PLA penetration, the influence of the FFF bed temperature was also investigated. (a) shows the material composition in specimens of the 62%-high geometry fabricated with different FFF bed temperatures in comparison. A bed temperature of 119C, which is the maximum bed temperature possible on the machine, was compared to 60
C, which is the recommended bed temperature for PLA. It is visible that higher bed temperatures lead to deeper PLA penetration. The PLA curve at
shows the highest ratios. Also this curve is the only one that shows a notable rise of PLA ratio under the cover, indicating good penetration of undercuts. The results of the tensile tests of these structures are shown in (b). Tensile strength of samples printed with 119
C bed temperature was 17.2 MPa on average compared to 9.2 MPa at 60
C bed temperature. The measurable strength improvement of the highest bed temperature compared to 80
C bed temperature was only small in relation to the high scatter of the results.
Figure 12. (a) Material composition in 62%-high geometry fabricated with different bed temperatures . (b) Interlock strengths at different bed temperatures.
3.4. Mechanical properties
3.4.1. Tensile strength
shows the tensile strength of the different structures investigated. The slot geometry reached an average tensile strength of 9.3 MPa. The T-slots specimens yielded slightly higher tensile strengths with 11.8 MPa. The covered pins 62%-high geometry showed the highest mechanical strength with an average of 16.5 MPa. The same geometry with a reduced height of 600 μm only achieved a tensile strength of 10.4 MPa. These structures failed either through pull out of the PLA or through fracture of the PLA in the interlocking region. Similar strength was obtained with the covered pins 50% geometry (12.3 MPa). Two of 10 specimens of this geometry failed through PLA pull out, while the other 8 specimens failed through fracture of the PLA in the interface region. Covered pins 80%-wide showed the lowest mechanical performance of 4.5 MPa on average. The same PLA proportion with thinner structures of 150 μm width showed high mechanical strength of 14.1 MPa on average. All of the covered pins 80%-wide failed through a pull out of the PLA part, while only 3 out of 10 of the 80%-thin specimens failed through pull out. Instead, this geometry showed a failure mode none of the other geometries exhibited. Seven specimens encountered fracture of the metal structures which remained in the PLA part.
Figure 13. Tensile strengths of different interlocking structures. The whiskers of the box plot show the range from minimal to maximal measured value. A circle visualises the average and a line the median of the respective data.
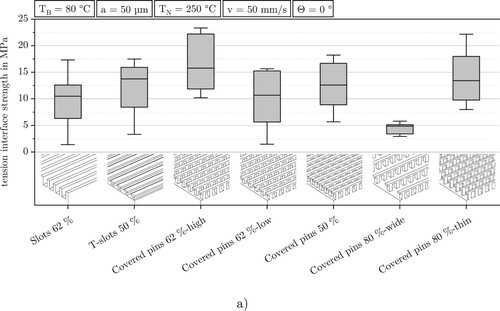
shows the tensile strength measured for two specimens of each structure that were also measured in μCT. The tensile strength is plotted vs.. the measurement of the average nozzle distance the structures were fabricated with. The distances shown here are deviating from the intended 50 μm as a result of the fabrication setup and process fluctuations. As the 50 μm distance was defined from a single highest point found on the surface, a systematic deviation was to be expected. For all specimens investigated, a smaller nozzle distance correlates with a higher tensile strength, although the strengths were different for different geometries despite similar nozzle distances.
Figure 14. Tensile strength of covered pins structures (colour coded) in relation to nozzle distance measured in μCT scans.
3.4.2. Shear strength
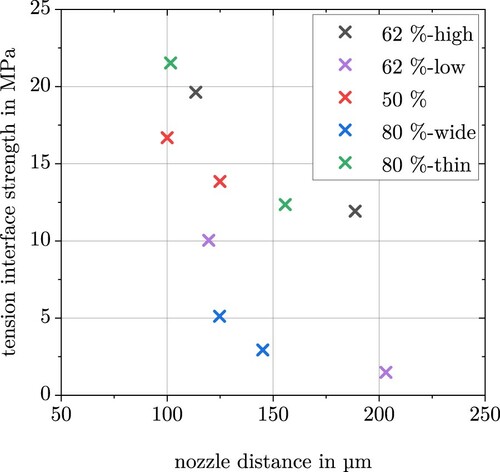
(a) shows the results of the edge shear test on the structure of the covered pins 62%-high. This structure was selected for the edge shear tests as it showed the highest mechanical performance in the tensile test. The tests were conducted with the loading direction parallel to the cover lines and the loading direction perpendicular to the lines. The shear strength of the structure was higher on average than the tensile strength. Moreover, the scatter of the shear strength was lower than that of the tensile strength. Only a small anisotropy of shear strength was found. The parallel loaded specimens failed at an average of 19.0 MPa while the perpendicular loaded specimens failed at an average of 20.7 MPa. The upper slice image in (b) shows a fractured specimen after a shear test with the perpendicular loading condition. The interlocking structures are broken off at their base and remained in the PLA part. All specimens loaded perpendicular to the cover lines failed at the base of the pin structure and not through pull out or fracture in the PLA section like in the tensile tests. Eight tests of the parallel loaded specimens were interrupted through reaching the force switch-off threshold criterion (80% of the maximum force) before separation of the specimen and two of the specimens through fracture of the base pins like the perpendicular loaded ones.
Figure 15. Results of shear tests on covered pins interlocking structure. (a) The whiskers of the box plot show the range from minimal to maximal measured value. A circle visualises the average and a line the median of the respective data. (b) Slice images of damaged specimens. The upper image shows the PLA half of a perpendicular loaded specimen. The interlocking structure is still located in the PLA and the pins fractured at their base. The middle and lower images show a specimen loaded parallel to covered pins structure. The lower image shows a covered line from the inner area of the specimen. The induced bending load lead to a fracture of the pins at the base. The middle image shows a covered line at the edge of the specimen. Here only a part of the interlocking structure fractured.
An assessment of the tested samples by μCT shows the damage. (b) shows a slice image of a sample loaded perpendicular to the covered lines which was separated at the base of the pin structure. The middle and lower parts of the image show slice images of a parallel loaded specimen. The lower image shows a covered pins line which was situated in the inner area of the specimen. All pins fractured at the surface of the AlSi10Mg base structure and some additionally at the cover. The upper image shows a covered pins line which was situated at the edge of the sheared specimen. It is visible that only a part of the pins fractured and the rest remained intact. The PLA at this part sheared in the loading direction.
3.5. Simulation results
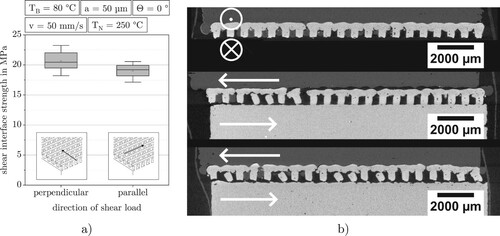
The idealised FE model of the overprinting process presented in Section 2.5.1 generated the contact pressure on the metal structure shown in . In the area shown in white, the pressure is zero. The PLA structure thus detaches from the metal structure in this area due to thermal expansion and the resulting warpage. Overall, the contact pressures are low. Only at the edges of two of the three centre slots, the PLA structure is pressed against the metal structure.
Figure 16. Process-induced contact pressure on the contact surface of AlSi10Mg and PLA. The metal structure is shown here.
4. Discussion
4.1. Polymer penetration behaviour
4.1.1. Influence of process parameters on penetration
The penetration of PLA into the AlSi10Mg structures is driven by the pressure generated by the stream of the extruded material. This pressure must overcome the shear forces that hinder the PLA flow into the cavities. The shear forces depend on the viscosity of the material, which in turn depends on the temperature and shear rate of the PLA. As pointed out in the literature by Kleffel and Drummer (Citation2017) and Lucchetta, Marinello, and Bariani (Citation2011), the mechanical properties of polymer–metal hybrids are governed by the penetration of the polymer into voids (of different scales) in the metal. Therefore the presented cross-sections of the variable slot width specimens and the investigations on the influence of FFF parameters on tensile strength allow an assessment of the penetration behaviour in the hybrid process.
The dependence of the penetration depth on the width of the gaps, visible in (c), can be explained by different mechanisms. After leaving the nozzle, the molten PLA hits the metallic structure where it starts to cool down. The more the PLA cools down, the higher its viscosity becomes (see Bechtel et al. Citation2020 for measurements of PLA viscosity) until eventually the flow front solidifies and the PLA can no longer penetrate deeper into the interlocking structure. Thinner gaps promote the cool down of the molten PLA since a larger surface area is in contact and thus hinders penetration. In addition, with narrower cavities and higher viscosity, more pressure is needed for filling, as the PLA has to be sheared more as it flows in.
The influence of the orientation on mechanical strength is due to the fact that the nozzle always alternates between structures and cavities when printing with a 45 orientation and deposits a contiguous track on top of the metal. PLA deposited on top of the structures hinders the downward flow of the PLA deposited between the structures. With a 0
orientation, the material flow is not hindered by material deposited on top of the neighbouring structures and thus penetration of the structures is improved.
The conducted investigations show that the set nozzle distance has a decisive impact on the mechanical properties (cf. d). With higher nozzle distances, the PLA is sheared less when flowing sideways than when flowing downwards into the cavities. This is also visible when evaluating the actual nozzle distance versus the obtained mechanical strength in . Higher tensile strengths are linked to smaller nozzle distances.
The influence of print speed, nozzle temperature and bed temperature can be explained by their influence on the solidification of the flow front. When changing the print speed, the speed of extrusion is automatically adapted by the slicer. This means that a higher printing speed is accompanied by a higher extrusion speed and thus a faster filling of the cavities. The structures can therefore be filled deeper until the flow front solidifies. A higher nozzle temperature results in a lower viscosity of the extruded PLA which facilitates the flow of the PLA into the structures and also allows for a longer time for filling until solidification. A higher bed temperature reduces the heat that flows from the PLA melt into the metal and thus provides a later solidification of the flow front.
4.1.2. Penetration of covered pins structures
The proposed covered pins structure had the purpose of providing an easily infiltratable interlocking structure. The extent to which this objective has been achieved can be assessed with the μCT images and material fraction curves shown in and . The PLA fraction at the top of the interlocking structure was too low in every specimen studied in μCT. First of all, this was due to the fact that the structures themselves became somewhat wider than intended (cf. the overestimated spacing of the slots in the slot structures in c) and thus the AlSi10Mg content was higher than intended. Second, the interface area was not completely filled and porosity remained (cf. ). The PLA content along the height of the pins can serve as a metric for the penetration behaviour of the PLA. A noteworthy higher PLA area fraction in the pin section than in the cover section is not reached in any of the specimens in . The specimen that is closest to the ideal curve (dashed line) of PLA in is the curve of the 80%-wide specimen ( e). The wide void of 1333 μm width allowed for a deeper filling than in the 80%-thin specimen (630 μm gap width). In contrast, the μCT images in (d) and (e) show that penetration into the undercut areas is poorer in the wide specimen compared to the thin specimen. Thus the wide opening allows for a good filling of the area between the covered lines but not between the pins. A possible reason is that the wide opening allows the extruded material to remain in the gap without being sheared as much as with flowing between the pins. The smaller gap width in the thin specimens enforces material flow into the undercuts. In comparison, the PLA penetrated the 62%-high structure better than the 62%-low structure, even though the gap width was the same (compare a to b). This is caused by a process-related effect. The extrusion amount was adapted to the cavity volume through the extrusion multiplier for each structure. To this end, the extrusion multiplier was calculated by dividing the cavity volume (from CAD) by the nominal first layer volume. As the print speed of the FFF head was kept constant for the different geometries, the extrusion speed could not be kept constant. The higher amount of extruded material in the high geometry therefore resulted in a higher extrusion speed which, as explained above, leads to a better penetration of the structure. The poor penetration of the 50% structure (cf. c) is therefore due to the low gap width of nominally 311 μm as well as a lower extrusion speed. The μCT images of the 62%-high and 62%-low structures confirm the differences visible in the material composition curve. More PLA has penetrated the high structure and also has flowed under the cover lines. The 50% structure shows only a small amount of PLA in the cavity although some material penetrated the undercuts. It is possible that the narrow gap resulted in low penetration volume of PLA into the structures, but it facilitated penetration into the undercuts as the flow between the covered lines required more shearing compared to the shearing required at wider spacing. In conclusion, the material fraction curves provide an indication of how well the structures have been filled. However, it is not possible to assess how well undercuts are used in the structures, as this property is not evenly distributed across the structures.
Better utilisation of the undercuts can be achieved by a higher bed temperature. As (a) shows, a higher bed temperature leads to a higher amount of material penetrating deeper into the structures. The PLA fraction curve of the specimen fabricated with 119C bed temperature is the only sample showing a noteworthy higher fraction of PLA in the pin section than in the cover section. This is also reflected in the average measured strengths. While the average tensile strength of samples manufactured with 80
C bed temperature was measured as 16.5 MPa, a lower bed temperature of 60
C resulted in a lower tensile strength of 9.2 MPa on average. Conversely the highest bed temperature of 119
C leads to the highest average tensile strength of 17.2 MPa. The observed strength increase between 80
C and 119
C seems to be lower than between 60
C and 80
C, but this may also be due to the high process variation that masks effects.
4.2. Factors determining the mechanical properties
Different factors contribute to the measured mechanical properties. The interplay of the various process variations leads to a high scatter in interlock strength. One key factor that was identified in the present work is the nozzle distance. As visible in (d), a difference of 90 μm in the set nozzle distance has a big influence on the tensile strength of the interface. When fabricating the FFF part of a hybrid specimen, the nozzle distance gets set through driving the nozzle downwards in 50 μm steps until electrical contact is established. This procedure is carried out at 10 points on the structures on the build plate and the highest value obtained is selected as the zero point. The nozzle distance is defined from this height. Deviations of the actual nozzle distance from the set distance result from process inaccuracies such as an inclined (LPBF-) build plate and general imperfections in the built height from the LPBF process such as spatter on the parts that result in an overestimation of the height due to the choice of the highest point as the zero height. As visible in , the actual nozzle distance varies between specimens. For example the difference in nozzle distance between the two specimens of the 62%-high geometry is approximately 75 μm. The differences in nozzle distance and tension interface strength correlate in each of the geometries investigated. Another reason for the high scatter in mechanical properties could be the tool path of the FFF head. The tool path was not tuned to hit the cavities so random influences in toolhead registration lead to variations in the extrusion quality into the cavities. Moreover, the LPBF interlocking structures show unsolicited variations in geometry, which influence the load distribution in the interface. These variations are visible for example in for the covered pins and in (b) for the T-slots.
Another key factor is the interlock structure used. Even though no geometrical undercut was intended for the slot geometry, the mechanical strength was higher than in the covered pins 80%-wide. As visible in the cross-section in (a), due to the characteristics of the LPBF process, small interlocks are created on a mesoscopic scale through the process. These surface irregularities in turn offer interlocking possibilities, which are important for the mechanical strength. All structures possibly benefit from these mesoscopic interlocks. The mechanical strength of the slot geometry must therefore be achieved by either friction or these mesoscopic interlocks. To shed light on this issue, the simulation of the contact pressure is considered, since high contact pressures are needed for high frictional forces. As the simulation of the process-induced contact pressure on the slot geometry showed (see ), the contact pressure induced by the thermal expansion and the resulting warpage is small and only exists in a small location at the upper edges of the two outer ridges. It can be concluded that friction at the microscopic level makes only a negligible contribution to the interlock strength and that the small surface irregularities are decisive for the interlock strength. In comparison to the actual geometry of the ridges in the slot geometry (cf. a) the ridges in the simulation have sharp edges. Thus the simulation likely overestimates the contact stress at the edges. More in-depth understanding could be gained with more detailed material and process models. For example, the crystallisation behaviour of the PLA, the actual geometry of the AlSi10Mg structure and the exact process control during the injection of the PLA could be modelled to obtain accurate values for the contact pressure.
The T-slot structures offer a higher mechanical strength, since macroscopic undercuts are utilised. Due to their higher width, less structure elements can be placed on the same area as with the covered pins of the same material ratio, which is a disadvantage when particularly small structures are to be produced. The covered pins in turn provide smaller structuring elements. The covered pins 62%-high showed the highest mechanical strength. In comparison the covered pins 62%-low structures showed a lower strength which is supported by the results on the penetration behaviour of these two structures. Similarly the differences in the mechanical strength of the 80%-wide and 80%-thin can be explained through the penetration behaviour that was made visible through the μCT images. The undercuts were used less in the wide structure which led to lower mechanical strength. This is also supported by the failure mode of the specimens as all specimens of the wide structure failed through a pull out. Moreover less contact surface area is available in the wide structure for mesoscopic interlocks since the number of structure elements is half of the elements in the thin structure. The fracture of the metal structures in the thin geometry can be explained by the fact that these structures were thinner and thus had lower load bearing capacity. A good penetration of the undercuts prevented a pull out failure. The failure mode of the covered pins 50% also fits the explanation presented in , since most of the specimens fractured in the interface.
4.3. Anisotropy of shear strength
The shear strength in both shearing directions of the covered pins 62%-high geometry was on average higher than the tensile strength and scatter of the results was lower. The reduced scatter is due to the fact that the fluctuating nozzle distance and thus fluctuating penetration depth are less important under shear loading, as a pull-out failure is less likely. The difference in shear strength depending on the loading direction can be explained by the different failure modes. All specimens tested perpendicular to the lines of the covered pins failed through abrupt fracture of the pins. Thus mechanical strength is limited by the bending load capacity of all pins. In contrast, the parallel loaded specimens failed at a lower shear load due to partial breakage of the pins. In these cases, the tests were terminated by the force switch-off threshold at 80% of the maximum force before separation of the specimen. As shown in (b), the covered pin lines at the edges of the specimens were only partially fractured. This means that also the load was not equally distributed over all pins of the structure, so that the load in the inner pins was relatively higher, resulting in earlier failure.
5. Conclusion
Hybrid AlSi10Mg/PLA specimens were manufactured through sequential manufacturing of a metal part with the LPBF process and additively adding an FFF part on top of the metal structure.
Mechanical bonding was realised through the use of interlocking structures. The structures with a size of a few multiples of an LPBF bead width proved to be manufacturable in the LPBF process and were tested for tensile strength. A covered pins structure was shown capable of being filled to a high degree with PLA and yielded high tensile (78.5% of the PLA strength) as well as shear strengths.
Different process parameters of the FFF process were investigated for their influence on mechanical properties. The viscosity reduction induced by higher nozzle temperature, the faster filling of the structures through a higher print speed and lower nozzle distance improved the tensile strength.
μCT investigation of the structures showed how PLA was able to flow into undercut areas and created an interlock and quantified the amount of PLA and AlSi10Mg in the structures.
Distance of the FFF nozzle to the structures was determined through μCT, revealing unintentional differences between specimens. These differences were identified as a main cause of a high scatter in mechanical properties.
Contact pressure generated by the thermal expansion and the resulting warpage of the PLA was evaluated through a simulation. Only a minor contribution to the tension interface strength was found.
Depending on geometric variations of the interlocking structure, the failure mode of the parts can be influenced.
The presented results are meant to help in enabling hybrid LPBF/FFF processes but can also be used to improve injection overmoulding processes, as additively manufactured structures providing undercuts make additional coupling agents superfluous. This also would presumably lead to lower process requirements, as less process pressure and preheating of the metal would be necessary. Nonetheless preheating of the metal substrate led to a higher strength of the joint for the structures investigated in this work.
As an outlook, the local arrangement of interlocking structures that was not examined in this work could be optimised. For example, Dröder, Brand, and Kühn (Citation2017) found that the shear strength of a FRP/metal joint by mechanical undercuts was influenced by the arrangement of the structures. The additive fabrication of the structures in this work would allow an optimised placement of the structures according to loading conditions, which could further improve the mechanical properties.
In this work, PLA was chosen because of its excellent processability. In the next step, the process should be adapted to high-performance polymers such as ASA or PEI to enable the use of the process for applications with higher temperature requirements.
Acknowledgments
The authors thank Henrik Werner and Pascal Pinter for fruitful discussions. This work was performed with the help of the Large Scale Data Facility at the Karlsruhe Institute of Technology funded by the Ministry of Science, Research and the Arts Baden-Württemberg and by the Federal Ministry of Education and Research.
Disclosure statement
No potential conflict of interest was reported by the author(s).
Additional information
Funding
Notes on contributors
Lukas Englert
Lukas Englert received his Master of Science degree from the Karlsruhe Institute of Technology (KIT) and is now Ph.D. student at the Institute of Applied Materials (IAM-WK). His research interests include process–structure–property relationships in laser powder bed fusion and characterisation through μCT.
Anselm Heuer
Anselm Heuer received his Master of Science degree from the Karlsruhe Institute of Technology (KIT) and is now working on his PhD in Materials Science at the Institute of Applied Materials (IAM-WK). He is interested in the additive manufacturing of plastics, the foaming of such structures and the characterisation of the resulting microstructure.
Mathias Keanu Engelskirchen
Mathias Keanu Engelskirchen received his Master of Science degree from the Karlsruhe Institute of Technology (KIT) in Karlsruhe. He is interested in the additive manufacturing of hybrid materials.
Felix Frölich
Felix Frölich received his Master of Science degree from the Karlsruhe Institute of Technology, Germany, and is now a Ph.D. student in the Institute of Vehicle System Technology at the Karlsruhe Institute of Technology, Germany, starting 2021. His research interests are developing simulation models of additive manufacturing processes. In particular, he is working on the modelling of Fused Filament Fabrication on multi-size scales.
Stefan Dietrich
Stefan Dietrich is the head of the group Production and Component Behaviour at the Institute of Applied Materials (IAM-WK) at KIT. His research interests are additive manufacturing, non-destructive testing and process simulations.
Wilfried V. Liebig
Wilfried V. Liebig is the head of the group Hybrid and Lightweight Materials at the Institute of Applied Materials (IAM-WK) at KIT. His research focus is the interaction of process, structure and properties of composite materials or material composites.
Luise Kärger
Luise Kärger is Tenured Senior Scientist and Deputy Head of the Lightweight Technology Department at the Institute of Vehicle System Technology at KIT. Her research focus is on modelling and simulation of manufacturing processes of polymer and fibre-reinforced composite components.
Volker Schulze
Volker Schulze is full professor at Karlsruhe Institute of Technology and works on Manufacturing and Materials Technologies.
References
- 3D Laser BW GmbH & Co. KG. 2021. “Materialdatenblatt Aluminiumlegierung AlSi10Mg.” Technical Report. 3D Laser BW. Accessed 31 August 2021. https://www.3-d-laser.de/content/alsi10mg-421.pdf
- 3D-Laserdruck GmbH i.G. 2020. “Materialdatenblatt AlSi10Mg.” Technical Report. 3D-Laserdruck. Accessed 31 August 2021. https://www.3d-laserdruck.de/files/my_files/pdf/downloads/datenblaetter/3D-Laserdruck_Materialdatenblatt_AlSi10Mg.pdf
- Ahrens, James, Berk Geveci, and Charles Law. 2005. “Paraview: An End-user Tool for Large Data Visualization.” The Visualization Handbook, Vol. 717(8).
- BASF 3D Printing Solutions BV. 2020. “Ultrafuse PLA.” Technical Report. BASF Forward AM. Accessed 31 August 2021. https://www.ultrafusefff.com/wp-content/uploads/2016/05/Ultrafuse_PLA_TDS_EN_v4.3.pdf
- Bechtel, Stephan, Mirko Meisberger, Samuel Klein, Tobias Heib, Steven Quirin, and Hans-Georg Herrmann. 2020. “Estimation of the Adhesion Interface Performance in Aluminum-PLA Joints by Thermographic Monitoring of the Material Extrusion Process.” Materials 13 (15): 3371.https://www.mdpi.com/1996-1944/13/15/3371
- Chen, Jie, Yongqiang Yang, Changhui Song, Mingkang Zhang, Shibiao Wu, and Di Wang. 2019. “Interfacial Microstructure and Mechanical Properties of 316L/CuSn10 Multi-material Bimetallic Structure Fabricated by Selective Laser Melting.” Materials Science and Engineering: A 752: 75–85.
- Chueh, Yuan-Hui, Chao Wei, Xiaoji Zhang, and Lin Li. 2020. “Integrated Laser-based Powder Bed Fusion and Fused Filament Fabrication for Three-dimensional Printing of Hybrid Metal/polymer Objects.” Additive Manufacturing 31: 100928. https://www.sciencedirect.com/science/article/pii/S2214860419309467
- Demir, Ali Gökhan, and Barbara Previtali. 2017. “Multi-material Selective Laser Melting of Fe/Al–12Si Components.” Manufacturing Letters 11: 8–11.
- Dröder, Klaus, Michael Brand, and Markus Kühn. 2017. “Numerical and Experimental Analyses on the Influence of Array Patterns in Hybrid Metal-FRP Materials Interlocked by Mechanical Undercuts.” Procedia CIRP 62: 51–55.
- Ferreira, Rafael Thiago Luiz, Igor Cardoso Amatte, Thiago Assis Dutra, and Daniel Bürger. 2017. “Experimental Characterization and Micrography of 3D Printed PLA and PLA Reinforced with Short Carbon Fibers.” Composites Part B: Engineering 124: 88–100.
- Kleffel, Tobias, and Dietmar Drummer. 2017. “Investigating the Suitability of Roughness Parameters to Assess the Bond Strength of Polymer-metal Hybrid Structures with Mechanical Adhesion.” Composites Part B: Engineering 117: 20–25.
- Leuteritz, Georg, Svenja Schudak, Markus Rohling, and Roland Lachmayer. 2020. “Formschlüssige multimaterielle Additive Fertigung zur Realisierung funktionsintegrierter Hybrid-Bauteile.” In Konstruktion für die Additive Fertigung 2018, 299–317. Berlin: Springer.
- Liu, Z. H., D. Q. Zhang, S. L. Sing, C. K. Chua, and L. E. Loh. 2014. “Interfacial Characterization of SLM Parts in Multi-material Processing: Metallurgical Diffusion Between 316L Stainless Steel and C18400 Copper Alloy.” Materials Characterization 94: 116–125. https://www.sciencedirect.com/science/article/pii/S1044580314001351
- Louvis, Eleftherios, Peter Fox, and Christopher J. Sutcliffe. 2011. “Selective Laser Melting of Aluminium Components.” Journal of Materials Processing Technology 211 (2): 275–284.
- Lucchetta, G., F. Marinello, and P. F. Bariani. 2011. “Aluminum Sheet Surface Roughness Correlation with Adhesion in Polymer Metal Hybrid Overmolding.” CIRP Annals 60 (1): 559–562.
- Patankar, S. V. 1978. “A Numerical Method for Conduction in Composite Materials, Flow in Irregular Geometries and Conjugate Heat Transfer.” In 6th International Heat Transfer Conference, Vol. 3, 297–302. Toronto, ON: Begell House Inc.
- Patankar, S. V. 1980. Numerical Heat Transfer and Fluid Flow. Hemisphere, New York: Hemisphere Publishing Corporation.
- Rudolph, Natalie, Jianxing Chen, and Travis Dick. 2019. “Understanding the Temperature Field in Fused Filament Fabrication for Enhanced Mechanical Part Performance.” AIP Conference Proceedings 2055: 140003.
- SD3D. 2014. “Technical Data Sheet PLA.” Technical Report 0. SD3D. Accessed 31 August 2021. https://www.sd3d.com/wp-content/uploads/2017/06/MaterialTDS-PLA_01.pdf
- Tang, Sheng-Hung, Chung-Wei Cheng, Ren-Yu Yeh, and Ray-Quan Hsu. 2018. “Direct Joining of 3D-printed Thermoplastic Parts to SLM-fabricated Metal Cellular Structures by Ultrasonic Welding.” The International Journal of Advanced Manufacturing Technology 99 (1): 729–736.
- Weflen, Eric, and Matthew Charles Frank. 2021. “Hybrid Additive and Subtractive Manufacturing of Multi-material Objects.” Rapid Prototyping Journal 27 (10): 1860–1871.
- Weidenmann, Kay André, Lisa Baumgärtner, and Benedikt Haspel. 2015. “The Edge Shear Test—An Alternative Testing Method for the Determination of the Interlaminar Shear strength in Composite Materials.” In Materials Science Forum, Vol. 825, 806–813. Vienna: Trans Tech Publications.
- Wu, Jiaojiao, Linzhi Wang, and Xuguang An. 2017. “Numerical Analysis of Residual Stress Evolution of AlSi10Mg Manufactured by Selective Laser Melting.” Optik 137: 65–78. doi:https://doi.org/10.1016/j.ijleo.2017.02.060