
 ?Mathematical formulae have been encoded as MathML and are displayed in this HTML version using MathJax in order to improve their display. Uncheck the box to turn MathJax off. This feature requires Javascript. Click on a formula to zoom.
ABSTRACT
It remains challenging to achieve attractive mechanical strength and ductility in commercial 7xxx alloys fabricated by wire-arc additive manufacturing (WAAM). Here, we combine WAAM processing with solution and artificial aging treatments to functionalise their inherent age-hardening capabilities via microstructure controlling. The as-deposit WAAM 7055 alloy shows a heterogeneous microstructure with a bimodal grain size distribution, and the primary metallurgical defects are spherical gas pores with an inter-layer distribution. Upon the optimised T6 temper (470°C/2 h for solution treatment and 120°C/65 h for artificial aging), nano-sized platelike η’ precipitates are generated, and the tensile strength boosts from ∼226 MPa to ∼562 MPa. Evident yielding with a uniform plastic deformation is also mediated by the T6 temper, with the yield strength > 500 MPa and the fracture strain > 5%, which is comparable to conventional wrought 7xxx alloys. This work provides insight into the microstructure tuning for commercial 7xxx alloys via WAAM for achieving excellent mechanical properties.
KEYWORDS: Wire-arc additive manufacturing; Al-Zn-Mg-Cu alloy; Aging; Porosity; Mechanical property
1. Introduction
Wire-arc additive manufacturing (WAAM), a member of the additive manufacturing family, becomes increasingly attractive to fabricate large-scale complex components more efficiently with lower cost (Derekar et al. Citation2022; Liu et al. Citation2020; Yu et al. Citation2021). As a directed energy deposition technique, electric arc heat source and wire feedstock are simultaneously focused on the substrate to form small melt pools during WAAM, and materials can be continuously deposited layer by layer (Attarilar et al. Citation2020; Liu et al. Citation2020; Sing et al. Citation2021). Various engineering materials, up to now, have been reliably fabricated by WAAM, such as steels (Li et al. Citation2021a), titanium (Lu et al. Citation2020) and aluminium alloys (Klein et al. Citation2021b; Zhou et al. Citation2020). In particular, owing to the low reflectivity of electric arc, WAAM is more suitable for the fabrication of aluminium alloys relative to laser additive manufacturing (Zhou et al. Citation2020).
Al-Zn-Mg-Cu (7xxx) alloys are usually chosen in aviation and automotive industries owing to their outstanding specific strength and high fatigue resistance (Chen et al. Citation2020; Sokoluk et al. Citation2019; Zhang et al. Citation2021). Dong et al. (Citation2020) firstly reported the microstructural characteristics and mechanical properties of an Al-Zn-Mg-Cu (7055) alloy processed by WAAM, and the average tensile strength was 230.7 MPa for the as-deposited alloy. Despite constant efforts on optimising fabrication processes and modifying alloy compositions (Dong et al. Citation2020; Klein et al. Citation2021a, Citation2021b; Li et al. Citation2021b, Citation2020b; Morais et al. Citation2020; Yu et al. Citation2021; Zhang et al. Citation2021), the mechanical properties of WAAM Al-Zn-Mg-Cu alloys remain inferior to commercial wrought counterpart alloys with a high yield strength exceeding 450 MPa and a large elongation above 8%.
Controlling metallurgical defects and tuning microstructures are of the essence for mechanical property improvement. In contrast with laser additive manufacturing (Martin et al. Citation2017), severe hot cracking is not frequently found in WAAM 7xxx alloys, which is associated with its relatively low temperature gradient of about 103∼104 K/m (Ding et al. Citation2011; Klein et al. Citation2021b). Unfortunately, the gas porosity caused by the rapidly decreased hydrogen solubility in aluminium is indeed problematic for WAAM-processed aluminium alloys, and the mechanical property is deteriorated resultantly (Hauser et al. Citation2021; Zhong et al. Citation2019). Still, it is an open question that how gas porosity affects the fracture behaviour of WAAM-processed Al-Zn-Mg-Cu alloys.
The effective approach to achieve superior mechanical properties is to activate the inherent strengthening mechanisms of 7xxx alloys, such as grain boundary strengthening and precipitation strengthening (Ma et al. Citation2014; Wang et al. Citation2018). Though the functionalisation with the nucleants, such as WC, etc. generates fine equiaxed microstructures and effectively improves the mechanical property (Lin et al. Citation2019; Martin et al. Citation2017), here we focus on the WAAM processing of commercial property-proven 7xxx alloys that are currently used in industries. The excellent age-hardening capability of commercial 7xxx alloys typically arises from nanoscale precipitation of the metastable Zn- and Mg-rich η’ phases (Khan et al. Citation2021; Sha and Cerezo Citation2004). Heat treatment is the key step for such precipitations, including the solution treatment to obtain a supersaturated solid solution and the ageing treatment to enable precipitations. Then comes the question whether the solution and aging treatments developed from conventional wrought 7xxx alloys are suitable for WAAM alloys, considering the non-equilibrium solidification process of WAAM. Therefore, specific heat treatments have to be developed for WAAM 7xxx alloys to maximise precipitation strengthening.
The commercial 7055 alloy is chosen for WAAM processing here, and its microstructure is controlled to achieve high strength via precipitation strengthening. Solution and aging treatments are optimised to tune microstructures and improve mechanical properties. This work demonstrates that high strength that is comparable to wrought alloys is achievable for WAAM 7xxx alloys with an acceptable ductility, which is of importance for the industrial application of WAAM techniques.
2. Material and methods
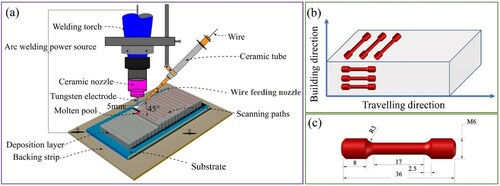
A self-developed WAAM system was used to fabricate 7055 alloy components. It was composed of a tungsten inert gas (TIG) torch, a three-axis computer numerical control (CNC) machine tool, a wire-feeding device and a computer to control the fabrication process, as shown in (a). The angle between tungsten electrode and wire feeding nozzle was ∼45°, and the distance between the electrode tip and the molten pool was ∼5 mm. The standard 7055 pre-alloyed wires, with a diameter of 1.2 mm, were used for WAAM processing. The optimised parameters for the 7055 alloy wires were 300 cm/min wire feeding speed, 240 mm/min troch travel speed, 25 V average arc voltage, 220 A peak current, 35% peak current time ratio, 40% base to peak current ratio, 2.4 pulse frequency and 2.8 mm layer thickness. The flow rate of shielding gas of Ar was 20 L/min. A rectangular alloy bulk, 280 mm × 40 mm × 40 mm, was prepared on the 2024 alloy substrate fixed on the machine tool with a continuous scanning strategy, as illustrated by the red lines in (a), and the hatching distance was 5 mm.
Figure 1. (a) Sketch of the WAAM setup; (b) Sampling positions for tensile testing; (c) Specimen dimensions for tensile testing.
Solution treatments with water cooling were performed in a muffle furnace for 2 h at 460°C (SS460), 465°C (SS465) and 470°C (SS470), respectively. Oil-bath aging treatments at 120°C were followed for such three specimens, and their aging-hardening behaviours were investigated by hardness measurement after different soaking times. The hardness was measured by a Vickers tester (HVST-1000Z) with a load of 200 g and dwell time of 10 s. At least five hardness measurements were performed for each specimen. As soon as the hardness measurements were completed, the specimens were soaked into the homothermic oil immediately.
The composition of the 7055 alloy via WAAM was measured by inductively coupled plasma-atomic emission spectrometry (ICP-AES). Samples for microstructure analysis were cut by electrical discharge machining (EDM), ground by abrasive papers and mechanically polished with a final OPS polishing. For optical microscope (LW600LJT, CEWEI, China) observation, the sample was etched with the Keller’s reagent (3% HCl, 2% HF, 5% HNO3, remainder H2O). The mechanically polished sample was analyzed using a field-emission scanning electron microscope (SEM, FEI Quanta 200F), and the attached energy dispersive X-ray spectrometer (EDS) was utilised to measure the phase compositions. A scanning transmission electron microscope (STEM, Talos F200, 200 kV) was used to observe the microstructures at nano-scale. High-resolution high-angle annular dark field (HAADF)-STEM imaging was carried out with a probe semi-convergence angle of 17 mrad. The corresponding inner and outer semi-collection angles ranged from 73 to 200 mrad. The foil for TEM analysis was mechanically ground to ∼100 μm in thickness, polished by a twin-jet electro-polishing device in perchloric based electrolytes and finally thinned by ion-milling.
Mechanical properties were obtained by tensile testing at room temperature, using a mechanical testing instrument (Instron 5966) with a laser-based video extensometer. The sampling positions along both building and travelling directions were illustrated in (b), and the specimen dimensions were shown in (c). The constant loading rate was 1 mm/min, and at least three specimens were tested for each alloy. The fracture surface of each specimen was observed by SEM (ZEISS Super 55). The fractured specimen was further scanned by 3D X-ray microscopy (XRM, ZEISS Xradia 520 Versa), and the settings for each specimen were 70 kV beam voltage, 6 W beam power, 86 μA target current, 4X optical magnification, 1.2 s exposure time and 1.91 μm pixel size. A LE5 filter was employed to enhance X-ray transmission through the specimen.
3. Results
3.1. Microstructure analysis of the as-deposited alloy
The composition of the 7055 alloy fabricated by WAAM is tabulated in . The contents of the main elements including Cu, Mg, Zn and Zr are in the nominal composition range of standard commercial 7055 alloys, suggesting negligible elemental loss during WAAM in this work.
Table 1. The composition of the WAAM 7055 alloy (wt%).
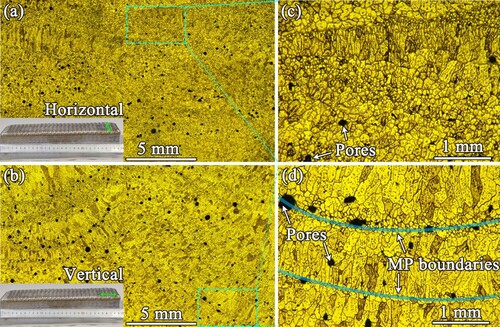
shows the optical microstructures of the as-deposited WAAM 7055 alloy. From the horizontal view (parallel to travelling direction), the microstructure is mainly composed of equiaxed grains and the distribution of pores seems disordered ((a,c)). In contrast, several parts of arcuate molten pools are observed from the vertical view that is perpendicular to the travelling direction ((b)), and equiaxed grains appear alternately at molten pool boundaries. The inter-layer region consists of equiaxed grains, while the inner-layer is composed of columnar grains ((d)). Such a heterogeneous microstructure with bimodal grain size distribution is also reported in other additive manufactured aluminium alloys (Croteau et al. Citation2018). The presence of pores with black contrast is also noted. These pores tend to be formed at molten pool boundaries, namely showing an inter-layer distribution.
Figure 2. Optical microstructures of the WAAM 7055 alloy: (a, c) Horizontal, parallel to the travelling direction; (b, d) Vertical, perpendicular to the travelling direction. (c) and (d) are the zoom-in images of (a) and (b), respectively.
To obtain more microstructural and compositional information, the as-deposited WAAM 7055 alloy has been further analyzed by SEM and TEM. As displayed in (a) imaged by SEM, grain boundary (GB) precipitates are noted, together with a few metallurgical defects like shrinkage void. (b,c) show the irregular GB phases and the eutectic phases, respectively, which are two typical GB phases in the as-deposited alloy, formed via liquid-to-solid (solidification) phase transformation. The elemental distributions for the GB precipitates in (b,c), obtained by SEM-EDS, are presented in (d,e), respectively. The compositions of selected GB precipitates are tabulated in . The phase labelled P1 primarily contains Al and Fe, suggesting the formation of Fe-rich intermetallic phases, probably Cu-containing Al3Fe (She et al. Citation2013). The composition of the phase wrapping Fe-rich intermetallics, represented by P2 measurement, contains Al, Zn, Mg and Cu, with the absence of Fe. The eutectic grey phases (P3) show enrichments of Zn, Mg and Cu, indicating the presence of T (AlZnMgCu) phases (Wang et al. Citation2018; Xu et al. Citation2017).
Figure 3. SEM microstructures and EDS mappings of the as-deposited WAAM 7055 alloy: (a) Overview of the microstructure; (b) Irregular grain boundary phases; (c) Grain boundary eutectic phases; (d) Compositional distributions in the selected region in (b); (e) Compositional distributions in the selected region in (c).
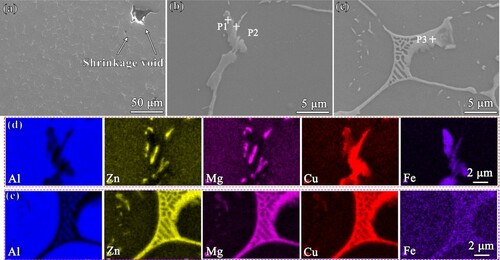
Table 2. The composition of the selected positions in the WAAM 7055 alloy (at%) measured by SEM-EDS. The positions from P1 to P3 are marked in .
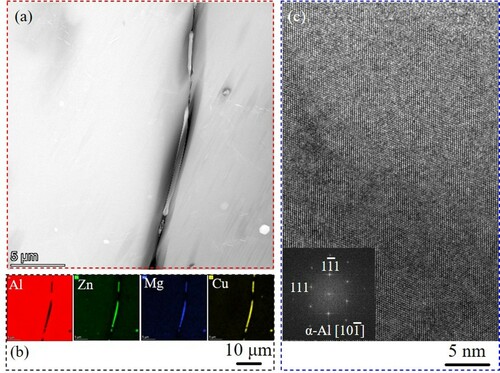
(a) shows the HAADF-STEM image of the as-deposited alloy, and the presence of GB precipitates is observed. According to the SEM mapping in (b), the GB precipitates are enriched in Zn, Mg and Cu, and depleted in Al, which are probably the T phases found in (c). (c) displays the high-resolution TEM image of α-Al grain interior, and the inset is obtained by fast Fourier transformation (FFT). Accordingly, severe lattice distortion and nano-sized precipitates are not observed.
Figure 4. TEM analysis of the as-deposited WAAM 7055 alloy: (a) STEM image; (b) EDS mapping of (a) including Al, Zn, Mg and Cu; (c) High-resolution TEM image of α-Al grain interior. The inset in (c) is obtained by fast Fourier transformation (FFT).
3.2. Aging hardening of the WAAM 7055 alloy
Prior to artificial aging, solution treatments have been carried out for 2 h at 460°C (SS460), 465°C (SS465) and 470°C (SS470), respectively, whose microstructures are displayed in Figure S1. The GB precipitates are partially dissolved after solution treatments. It is also found that the higher solid solution treatment temperature, the lower content of GB precipitate.
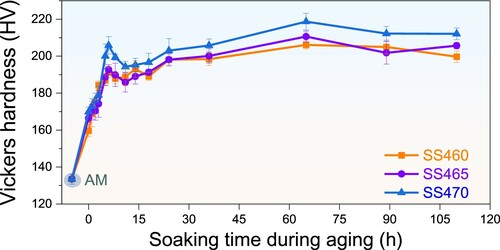
Artificial aging treatments have been performed at 120°C to enable the precipitation of strengthening phases. plots the Vickers hardness evolutions as a function of soaking time during artificial aging for the SS460, SS465 and SS470 specimens. Accordingly, the hardness values of such three specimens show a similar tendency, i.e. increasing with soaking time before reaching peak aging at 6th hour, decreasing to the lowest hardness at 11th hour, and climbing gradually to achieve a hardness plateau at 65th hour. The average Vickers hardness after first peak aging is 205.8HV for SS470, 192.7HV for SS465 and 191.2HV for SS460, respectively. The plateau hardness, represented by the value at 65th hour, is 218.7HV for SS470, 210.6HV for SS465 and 206.1HV for SS460, respectively. It is noted that the hardness of SS470 is higher than that of SS465 and SS460, and therefore, the optimum solid solution treatment temperature is 470°C for WAAM 7055 alloys.
Figure 5. The Vickers hardness evolutions of the WAAM 7055 alloy during solid solution and aging treatments. The solid solution treatments are performed for 2 h at 460°C (SS460), 465°C (SS465) and 470°C (SS470), respectively. The aging treatments are carried out at 120°C.
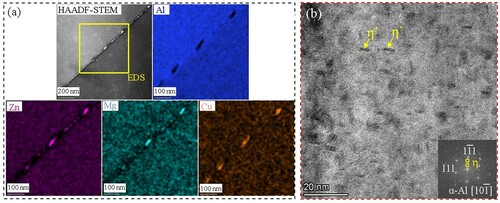
After artificial aging at 120°C for 110 h, the OM microstructures of the SS460, SS465 and SS470 specimens are observed, as displayed in Figure S2. Accordingly, significant grain coarsening is not found for all the specimens. The microstructure of the SS470 specimen after artificial aging at 120°C for 65 h has been further analyzed by TEM. As shown in (a), the microstructure is imaged by HAADF-STEM. Discontinuous GB precipitates are noted, which are depleted in Al and enriched in Zn, Mg and Cu based on the corresponding EDS mappings. Noteworthily, nano-sized platelike precipitates are generated within the grains ((b), labelled by white arrows), which are determined to be the η’ phase by the FFT pattern (Dong et al. Citation2021). Such η’ precipitates are ∼4.5 nm in length and 1.4 nm in thickness.
Figure 6. TEM analysis of the WAAM 7055 alloy in T6 temper condition: (a) STEM image and the EDS mapping of a selected region including Al, Zn, Mg and Cu; (b) High-resolution TEM image of α-Al grain interior. Solution treatment is performed at 470°C for 2 h, and artificial aging is carried out at 120°C for 65 h. The inset in (b) is obtained by FFT.
3.3. Mechanical properties of the WAAM 7055 alloys
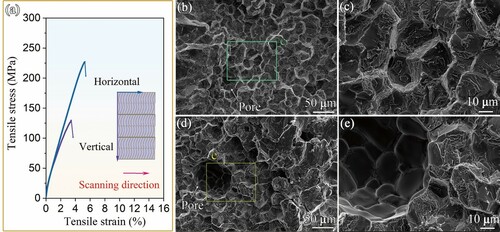
Tensile properties of the as-deposited and aged WAAM 7055 alloys have been tested to examine the influences of solid solution and aging treatments on the mechanical properties. According to the tensile curves (a), both horizontal and vertical as-deposited specimens are fractured before significant yielding, and their tensile strengths are ∼226 MPa and ∼128 MPa, respectively. As revealed by the ice sugar-like fracture surfaces, both horizontal ((b,c)) and horizontal ((d,e)) specimens are fractured in an intergranular mode, with the presence of fractured pores.
Figure 7. (a) Tensile testing of the as-deposited WAAM 7055 alloy along horizontal and vertical directions, respectively; (b, c) Fracture surfaces of horizontal (parallel to the travelling direction) specimens; (d, e) Fracture surfaces of vertical (perpendicular to the travelling direction) specimens.
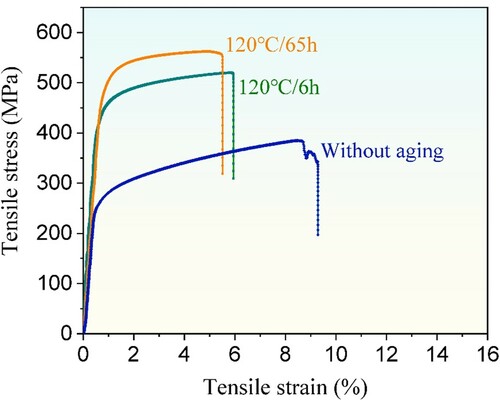
shows the tensile testing curves of the WAAM 7055 alloys with a horizontal sampling direction, including the solution-treated specimen at 470°C for 2 h (without aging) as well as the aged specimens at 120°C for 6 h and 65 h, respectively. Evident yielding is observed for such three alloys, in contrast the as-deposited alloy in (a). Afterwards, the stress necessary to continue uniform plastic deformation increases to a maximum (tensile strength), and then drops until eventual fracture, experiencing a non-uniform plastic deformation. The ultimate strength is ∼385 MPa for the alloy without aging, ∼520 MPa after aging for 6 h and ∼562 MPa after aging for 65 h, respectively. It reveals that a ∼130% increase in the tensile strength of WAAM 7055 alloy, compared with the as-deposited alloy, is achieved by solution and artificial aging treatments. The yield strength boosts from ∼256 MPa (without aging) to ∼455 MPa and ∼501 MPa after aging for 6 h and 65 h, respectively. In terms of ductility, after solution treatment at 470°C for 2 h, the specimen’s fracture stain increases to 8.7%, and the following artificial aging leads to the decrease of fracture strain (5.5%–5.9%) as a compromise of strength increment. Thus, the optimised T6 temper for the WAAM 7055 alloy includes 470°C/2 h for solution treatment and 120°C/65 h for artificial aging to obtain optimum mechanical properties.
Figure 8. Tensile testing of the WAAM 7055 alloy after solution treatment at 470°C for 2 h and aging at 120°C for 6 h and 65 h, respectively, with a horizontal sampling direction.
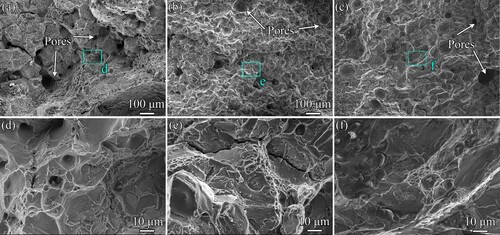
As shown in (a), a transgranular fracture surface is observed for the specimen after solution treatment at 470°C for 2 h, instead of the intergranular fracture surface of the as-deposited alloy. Both tearing ridges and dimples are generated during fracture. The specimens with artificial aging for 6 h ((b)) and 65 h ((c)) remain such a transgranular fracture surface. In addition, fractured gas pores are found on the fracture surfaces of all the specimens.
Figure 9. Fracture surfaces of the WAAM 7055 alloys after solution treatment (a, d) at 470°C for 2 h and aging at 120°C for 6 h (b, e) and 65 h (c, f), respectively. (d), (e) and (f) are the zoom-in images of (a), (b) and (c), respectively.
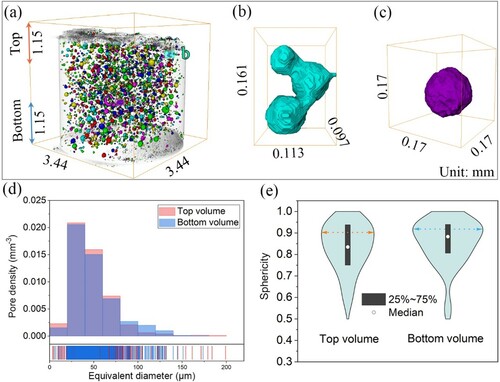
To reveal the evolution of gas pores during plastic deformation, we further employ XRM to reconstruct the gas pores in the as-deposited horizontal WAAM 7055 alloy specimen after mechanical tensile testing. The whole reconstruction of the fractured specimen is shown in (a), and the gas pores are distributed homogeneously. The top and bottom parts, with 1.15 mm in height, are extracted respectively to analyze the differences on the quantity, sphericity and diameters of gas pores under different tensile strains. The closer to the fracture surface, the higher plastic strains. Thus, the top XRM volume has experienced a higher plastic strain than the bottom volume. The coherence of gas pores is noticed nearby the fracture surface within the top volume, as illustrated in (b), while spherical pores prevail inside the bottom volume ((c)). (d) compares the pore density, pore number per mm3, and equivalent diameter between the top and bottom XRM volumes. In contrast to the bottom volume, the top volume shows a higher density of small pores whose diameter is less than 80 μm. More large pores, ranging from 80 μm to 140 μm, are involved in the bottom volume. The Violin plot is used for statistical analysis of gas pore sphericity for the top and bottom volumes, see (e), together with the probability density of the data at different sphericity values. The more spherical gas pores are represented by a higher sphericity value. The average pore sphericity value (labelled by white circles) of the top volume is 0.83, lower than that of the bottom (0.88). The black box representing 25–75% of the values of the top volume is longer than that of the bottom volume, suggesting a more dispersive distribution of sphericity values. As indicated by the width of each curve, the highest frequency of data points in the top volume corresponds to 0.90 in sphericity (orange line), lower than that in the bottom volume (0.92, cerulean blue line).
Figure 10. XRM analysis of the fractured WAAM 7055 alloy (Horizontal, as-deposited) specimen after tensile testing: (a) Overview of the pores distributed in the cylinder XRM reconstruction; (b) 3D morphology of representative merged pores; (c) 3D morphology of original spherical pores; (d) Comparisons of pore density (the number of pores per mm3) and equivalent diameter between top and bottom volumes; (e) Violin plot illustrating the distributions of pore sphericity for the top and bottom volumes. The definition of the top and bottom volumes is shown in (a) with a length of 1.15 mm.
4. Discussion
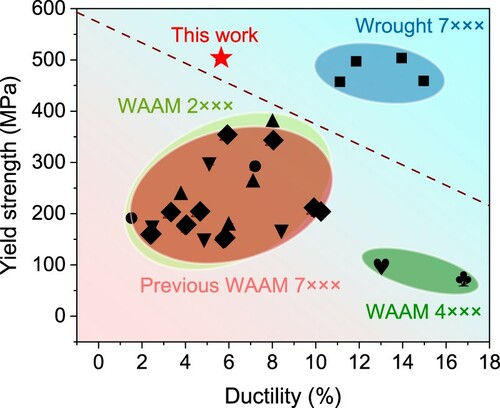
In the present work, high-strength commercial 7055 alloys are obtained upon WAAM processing and T6 treatments. Breakthroughs are achieved by enhancing the yield strength beyond 500 MPa and the ultimate strength exceeding 550 MPa for additive manufactured commercial 7xxx alloys, without modifying alloy compositions or adding secondary nucleants (Lin et al. Citation2019; Martin et al. Citation2017). As summarised in , the yield strength and ductility of WAAM 7xxx alloys in previous literature (Dong et al. Citation2020; Fang et al. Citation2021; Klein et al. Citation2021b; ; Li et al. Citation2020b, Citation2021b) are comparable to those of WAAM 2xxx alloys (Fu et al. Citation2021; Qi et al. Citation2019; Xue et al. Citation2021; Zhou et al. Citation2020, Citation2021); the WAAM 4xxx alloys show higher ductility but lower strength (Guo et al. Citation2022; Miao et al. Citation2020). The mechanical strength of WAAM 7xxx in this work is higher than that of any previously reported WAAM-produced commercial aluminium alloys, and is comparable to conventional wrought 7xxx alloys (Davis Citation1993).
Figure 11. Summary of ultimate strength and fracture strain for various commercial aluminium alloys fabricated by WAAM. The reference WAAM 7xxx alloys are compared from previous literature (Klein et al. Citation2021a, Citation2021b; Dong et al. Citation2020; Li et al. Citation2020a, Citation2020b, Citation2021a, Citation2021b; Fang et al. Citation2021). The reference 2xxx alloys include 2219 (▾, Zhou et al. Citation2021; Zhou et al. Citation2020), 2024 (▴, Fu et al. Citation2021; Qi et al. Citation2019) and 2196 (●, Xue et al. Citation2021). The reference 4xxx alloys include 4047 (♥, Guo et al. Citation2022) and 4043 (♣, Miao et al. Citation2020). The property of wrought 7xxx alloys are taken from the handbook (Davis, ASM international, 1993).
To provide more details on the alloys’ strengthening behaviour, contributions of the main strengthening mechanisms are analyzed. The contribution of GB strengthening (σGB), a key strengthening mechanism for aluminium alloys can by calculated by the Hall-Petch relationship:
(1)
(1) where σ0 is the friction stress (20 MPa), d the average grain diameter (147 μm for the WAAM 7055 alloy) and k the Hall–Petch slope (0.14 MPa/m1/2) (Li et al. Citation2020a). It thus reveals that GB strengthening offers ∼32 MPa (∼6%) for the yield strength, which is not surprising due to the relatively large grain size of WAAM 7055 alloys in this work. When comparing as-deposited and heat-treated WAAM 7055 alloys, it is found the GB strengthening mechanism provides a negligible effect on enhancing the alloy’s strength, because of their similar grain sizes.
Therefore, it is proposed that such a significant strength increment is primarily contributed by precipitation strengthening, as a large amount of nano-sized η’ precipitates are generated upon artificial aging. The precipitation sequence for 7xxx alloys is generally as follows: supersaturated solid solution → Guinier-Preston zones → η′ phase → η (MgZn2) phase (Sha and Cerezo Citation2004). The metastable η′ phase with higher Zn/Mg ratios is considered as the major strengthening precipitate for 7xxx alloys rather than the stable η phase (Dong et al. Citation2020; Sha and Cerezo Citation2004).
It has been reported that the operative strengthening mechanism for η’ precipitates in 7xxx alloys is the Orowan bypass mechanism with dislocation looping around η’ precipitates (Ma et al. Citation2014). Their strengthening contribution can be estimated from:
(2)
(2) where M is the mean orientation factor (3.06), G the shear modulus (26.9 GPa), b the magnitude of the Burgers vector (0.286 nm) and ʋ the Poisson’s ratio (0.33) (Ma et al. Citation2014). r is the average radius of spherical principates in a circular cross-section in a random plane, which is calculated as:
(3)
(3) where rP is the mean radius of the precipitates. λP is the mean inter-precipitates measured edge to edge, which can be estimated from:
(4)
(4) where f is the volume fraction of the η′ precipitates. For the WAAM 7055 alloy after artificial aging, the volume fraction (area fraction here) and the mean radius of η′ precipitates are ∼2.2% and ∼2.91 nm, respectively. The calculated strength of σP provided by the η′ precipitates is about 423 MPa. Therefore, the estimated yield strength (σ) of the WAAM 7055 alloy is ∼455 MPa, i.e. σ = σGB + σP. This value is slightly lower than the yield strength measured by mechanical testing (501 MPa). This suggests that the solid solution strengthening mechanism also operates, with the contribution of approximately 40.3 MPa (Zhu et al. Citation2021). Noteworthily, the estimation results prove that the precipitation strengthening by nano-sized η’ precipitates is primarily responsible for the excellent mechanical strength of the WAAM 7055 alloy, which highlights the importance of artificial aging.
Compared with the as-deposited WAAM 7055 specimen, mechanical yielding with evident uniform plastic deformation is favourably enabled by solution treatment, see the ‘Without aging’ curve in . The corresponding enhanced ductility is associated with the work-hardening behaviour, which tends to arise from the dislocation interactions with obstacles and/or other dislocations (Shimokawa et al. Citation2022). The coarse irregular GB phases and the eutectic phases shown in , particularly the Fe-rich intermetallics, typically act as stress concentrators during mechanical loading, leading the initiation of cracks and brittle intergranular fracture (Mao et al. Citation2020). Such a fracture mode could be suppressed by the reduction of large GB phases during solution treatment (Figure S1), and this explains the transition from intergranular fracture in to transgranular fracture in . The reduction of compositional segregation also contributes to the coordination deformation of neighbouring grains and the improvement of ductility. In addition, the heterogeneous microstructure with alternate equiaxed and columnar grains ((d) and Figure S2) is of benefit to ductility improvement by inducing the strain hardening mechanism (Huang et al. Citation2022; Kürnsteiner et al. Citation2020; Suryawanshi et al. Citation2016).
The artificial aging following solution treatment enhances the mechanical strength, but unfortunately, sacrifice the ductility of solution-treated WAAM 7055 alloys. This is a classical conflict for structural metallic materials referred as the strength-ductility trade-off (Li et al. Citation2016). The root cause is that the nanoscale η’ precipitates generated via artificial aging act as obstacles to dislocation glide, normally leading to high stress concentration and even microcracks, and the ductility thus decreases (Peng, Wei, and Gao Citation2020; Teng et al. Citation2018). Noteworthily, synergistic improvements in strength and ductility are achieved for WAAM 7055 alloys by artificial aging following solution treatment, compared with the as-deposited alloys.
In terms of the metallurgical defects, though hot cracking is not problematic for WAAM 7055 alloys, porosity defects do exist, as a result of hydrogen gas entrapment (Hauser et al. Citation2021). On the one hand, gas porosity leads to the loss of resistant area and the decrease of engineering yield strength; on the other hand, stress concentration and crack initiation tends to be caused by the presence of gas porosity, particularly the large-sized pores, contributing to the fracture of alloys (Ryan et al. Citation2018; Teng et al. Citation2009). Our results reveal the tendency of inter-layer distribution for gas pores (). Such an anisotropic distribution is associated with the mechanical property anisotropy between horizontal and vertical dislocations for as-deposited WAAM 7055 alloys (), due to the difference on sectional bearing area. The XRM analysis discloses that under higher plastic strain, the pores are deformed and their sphericity is reduced. Meanwhile, more pores are observed, possibly coming from the original pores that grow large enough to be detected by XRM or the newly formed pores during tensile testing. Along with the quantity increase of detectable pores, coalescence of pores is also noticed, as a result of the increased stress triaxiality parameter (Kim, Gao, and Srivatsan Citation2004). The coalesced pores will eventually form large irregular-shaped pores, which tends to deteriorate the tensile fracture strain in a roughly linear way (Teng et al. Citation2009). Samei et al. (Citation2019) have proposed that pore coalescence is a primary damage mechanism leading to fracture of AlSi10Mg fabricated by selective laser melting. Namely, the gas pores indeed participate in the progressive deterioration of mechanical properties for WAAM aluminium alloys including the microvoid nucleation, growth and coalescence, as well as the final fracture process. Eliminating the gas porosity of WAAM Al-Zn-Mg-Cu alloys can thus be required to reduce the property anisotropy and further improve their mechanical properties.
5. Conclusions
In summary, microstructure tuning has been employed to achieve synergistic improvements in strength and ductility for a commercial Al-Zn-Mg-Cu 7055 alloy fabricated by WAAM. The following conclusions can be drawn.
The as-deposit WAAM 7055 alloy shows a heterogeneous microstructure with bimodal grain size distribution with the presence of coarse GB phases. The inter-layer region consists of fine equiaxed grains, while the inner-layer is composed of coarse columnar grains. The primary metallurgical defects are spherical gas pores, which is featured by inter-layer distribution.
The optimised T6 temper for WAAM 7055 alloys includes the solution treatment at 470°C for 2 h and the artificial aging at 120°C for 65 h with the peak hardness of 218.7HV. Nano-sized platelike η’ precipitates are generated upon T6 temper, which are ∼4.5 nm in length and 1.4 nm in thickness, together with discontinuous (Zn, Mg, Cu)-enriched GB precipitates.
In contrast to the low ultimate strength of ∼226 MPa for the as-deposited alloy with a brittle intergranular fracture mode, the ultimate strength and yield strength of the WAAM 7055 alloys after the optimised T6 temper increase to ∼562 MPa and ∼501 MPa, respectively, with a transgranular fracture mode. The significant strength increment is associated with the nanosized η’ precipitates via precipitation strengthening.
Evident yielding with uniform plastic deformation is mediated by the optimised T6 temper with a fracture strain exceeding 5%. As revealed by XRM, the gas pores located closer to the fracture surface shows a decrease in the sphericity and an increase in the quantity of small pores with a diameter less than 80 μm.
Acknowledgements
The authors would thank the Analysis & Testing Center of Beijing Institute of Technology for the assistance the XRM experiments.
Disclosure statement
No potential conflict of interest was reported by the author(s).
Additional information
Funding
Notes on contributors
Yueling Guo
Yueling Guo is an assistant professor of Beijing Institute of Technology.
Qifei Han
Qifei Han is a currently Master’s candidate of Beijing Institute of Technology.
Wenjun Lu
Wenjun Lu is an assistant professor of Southern University of Science and Technology.
Fengchao An
Fengchao An is a currently postdoctor of Southern University of Science and Technology.
Jinlong Hu
Jinlong Hu is a currently Master’s candidate of Beijing Institute of Technology.
Yangyu Yan
Yangyu Yan is a currently Master’s candidate of Beijing Institute of Technology.
Changmeng Liu
Changmeng Liu is an associate professor of Beijing Institute of Technology.
References
- Attarilar, S., M. Ebrahimi, F. Djavanroodi, Y. Fu, L. Wang, and J. Yang. 2020. “3D Printing Technologies in Metallic Implants: A Thematic Review on the Techniques and Procedures.” International Journal of Bioprinting 7 (1): 306.
- Chen, S., R. Gu, Q. Liu, W. Wang, and X. Wei. 2020. “Experimental and Numerical Investigation on Strengthening Behavior of 7075 Aluminum Alloy Sheets in Hot Forming–Quenching Integrated Process.” Journal of Manufacturing Science and Engineering 142 (6): 61005.
- Croteau, J. R., S. Griffiths, M. D. Rossell, C. Leinenbach, C. Kenel, and V. Jansen. 2018. “Microstructure and Mechanical Properties of Al-Mg-Zr Alloys Processed by Selective Laser Melting.” Acta Materialia 153: 35–44.
- Davis, J. R. 1993. Aluminum and Aluminum Alloys. Materials Park, OH: ASM International.
- Derekar, K. S., B. Ahmad, X. Zhang, S. S. Joshi, J. Lawrence, and L. Xu. 2022. “Effects of Process Variants on Residual Stresses in Wire Arc Additive Manufacturing of Aluminum Alloy 5183.” Journal of Manufacturing Science and Engineering 144: 7.
- Ding, J., P. Colegrove, J. Mehnen, S. Ganguly, P. M. Sequeira Almeida, and F. Wang. 2011. “Thermo-Mechanical Analysis of Wire and Arc Additive Layer Manufacturing Process on Large Multi-Layer Parts.” Computational Materials Science 50 (12): 3315–3322.
- Dong, B., X. Cai, S. Lin, X. Li, C. Fan, and C. Yang. 2020. “Wire Arc Additive Manufacturing of Al-Zn-Mg-Cu Alloy: Microstructures and Mechanical Properties.” Additive Manufacturing 36: 101447.
- Dong, B., X. Cai, Y. Xia, S. Lin, C. Fan, and F. Chen. 2021. “Effects of Interlayer Temperature on the Microstructures of Wire Arc Additive Manufactured Al-Zn-Mg-Cu Alloy: Insights Into Texture Responses and Dynamic Precipitation Behaviors.” Additive Manufacturing 48: 102453.
- Fang, X., G. Chen, J. Yang, Y. Xie, K. Huang, and B. Lu. 2021. “Wire and Arc Additive Manufacturing of High-Strength Al–Zn–Mg Aluminum Alloy.” Frontiers in Materials 8: 656429.
- Fu, R., S. Tang, J. Lu, Y. Cui, Z. Li, and H. Zhang. 2021. “Hot-Wire Arc Additive Manufacturing of Aluminum Alloy with Reduced Porosity and High Deposition Rate.” Materials & Design 199: 109370.
- Guo, Y., Q. Han, J. Hu, X. Yang, P. Mao, and J. Wang. 2022. “Comparative Study on Wire-Arc Additive Manufacturing and Conventional Casting of Al–Si Alloys: Porosity, Microstructure and Mechanical Property.” Acta Metallurgica Sinica (English Letters) 35: 475–485.
- Hauser, T., R. T. Reisch, P. P. Breese, B. S. Lutz, M. Pantano, and Y. Nalam. 2021. “Porosity in Wire Arc Additive Manufacturing of Aluminium Alloys.” Additive Manufacturing 41: 101993.
- Huang, S., P. Kumar, W. Y. Yeong, R. L. Narayan, and U. Ramamurty. 2022. “Fracture Behavior of Laser Powder Bed Fusion Fabricated Ti41Nb via in-Situ Alloying.” Acta Materialia 225: 117593.
- Khan, M. A., Y. Wang, M. Hamza, G. Yasin, M. Tabish, and C. Feng. 2021. “Precipitation Behaviour in an Al-Zn-Mg-Cu Alloy Subjected to High Strain Rate Compression Tests.” Materials Characterization 180: 111398.
- Kim, J., X. Gao, and T. S. Srivatsan. 2004. “Modeling of Void Growth in Ductile Solids: Effects of Stress Triaxiality and Initial Porosity.” Engineering Fracture Mechanics 71 (3): 379–400.
- Klein, T., G. Graf, P. Staron, A. Stark, H. Clemens, and P. Spoerk-Erdely. 2021a. “Microstructure Evolution Induced by the Intrinsic Heat Treatment Occurring During Wire-Arc Additive Manufacturing of an Al-Mg-Zn-Cu Crossover Alloy.” Materials Letters 303: 130500.
- Klein, T., M. Schnall, B. Gomes, P. Warczok, D. Fleischhacker, and P. J. Morais. 2021b. “Wire-Arc Additive Manufacturing of a Novel High-Performance Al-Zn-Mg-Cu Alloy: Processing, Characterization and Feasibility Demonstration.” Additive Manufacturing 37: 101663.
- Kürnsteiner, P., M. B. Wilms, A. Weisheit, B. Gault, E. A. Jägle, and D. Raabe. 2020. “High-Strength Damascus Steel by Additive Manufacturing.” Nature 582 (7813): 515–519.
- Li, K., M. A. Klecka, S. Chen, and W. Xiong. 2021a. “Wire-Arc Additive Manufacturing and Post-Heat Treatment Optimization on Microstructure and Mechanical Properties of Grade 91 Steel.” Additive Manufacturing 37: 101734.
- Li, S., J. Ning, G. Zhang, L. Zhang, J. Wu, and L. Zhang. 2021b. “Microstructural and Mechanical Properties of Wire-Arc Additively Manufactured Al–Zn–Mg Aluminum Alloy: The Comparison of as-Deposited and Heat-Treated Samples.” Vacuum 184: 109860.
- Li, Z., K. G. Pradeep, Y. Deng, D. Raabe, and C. C. Tasan. 2016. “Metastable High-Entropy Dual-Phase Alloys Overcome the Strength–Ductility Trade-Off.” Nature 534: 227.
- Li, R., M. Wang, Z. Li, P. Cao, T. Yuan, and H. Zhu. 2020a. “Developing a High-Strength Al-Mg-Si-Sc-Zr Alloy for Selective Laser Melting: Crack-Inhibiting and Multiple Strengthening Mechanisms.” Acta Materialia 193: 83–98.
- Li, S., L. Zhang, J. Ning, X. Wang, G. Zhang, and J. Zhang. 2020b. “Microstructures and Mechanical Properties of Al–Zn–Mg Aluminium Alloy Samples Produced by Wire + Arc Additive Manufacturing.” Journal of Materials Research and Technology 9 (6): 13770–13780.
- Lin, T., C. Cao, M. Sokoluk, L. Jiang, X. Wang, and J. M. Schoenung. 2019. “Aluminum with Dispersed Nanoparticles by Laser Additive Manufacturing.” Nature Communications 10: 1.
- Liu, D., D. Wu, G. Ma, C. Zhong, F. Niu, and A. Gasser. 2020. “Effect of Post-Deposition Heat Treatment on Laser-TIG Hybrid Additive Manufactured Al-Cu Alloy.” Virtual and Physical Prototyping 15 (4): 445–459.
- Lu, T., C. Liu, Z. Li, Q. Wu, J. Wang, and T. Xu. 2020. “Hot-Wire Arc Additive Manufacturing Ti–6.5Al–2Zr–1Mo–1V Titanium Alloy: Pore Characterization, Microstructural Evolution, and Mechanical Properties.” Journal of Alloys and Compounds 817: 153334.
- Ma, K., H. Wen, T. Hu, T. D. Topping, D. Isheim, and D. N. Seidman. 2014. “Mechanical Behavior and Strengthening Mechanisms in Ultrafine Grain Precipitation-Strengthened Aluminum Alloy.” Acta Materialia 62: 141–155.
- Mao, X., Y. Yi, H. He, S. Huang, and W. Guo. 2020. “Second Phase Particles and Mechanical Properties of 2219 Aluminum Alloys Processed by an Improved Ring Manufacturing Process.” Materials Science and Engineering: A 781: 139226.
- Martin, J. H., B. D. Yahata, J. M. Hundley, J. A. Mayer, T. A. Schaedler, and T. M. Pollock. 2017. “3D Printing of High-Strength Aluminium Alloys.” Nature 549 (7672): 365–369.
- Miao, Q., D. Wu, D. Chai, Y. Zhan, G. Bi, and F. Niu. 2020. “Comparative Study of Microstructure Evaluation and Mechanical Properties of 4043 Aluminum Alloy Fabricated by Wire-Based Additive Manufacturing.” Materials & Design 186: 108205.
- Morais, P. J., B. Gomes, P. Santos, M. Gomes, R. Gradinger, and M. Schnall. 2020. “Characterisation of a High-Performance Al–Zn–Mg–Cu Alloy Designed for Wire Arc Additive Manufacturing.” Materials 13 (7): 1610.
- Peng, S., Y. Wei, and H. Gao. 2020. “Nanoscale Precipitates as Sustainable Dislocation Sources for Enhanced Ductility and High Strength.” Proceedings of the National Academy of Sciences 117 (10): 5204.
- Qi, Z., B. Qi, B. Cong, H. Sun, G. Zhao, and J. Ding. 2019. “Microstructure and Mechanical Properties of Wire + Arc Additively Manufactured 2024 Aluminum Alloy Components: As-Deposited and Post Heat-Treated.” Journal of Manufacturing Processes 40: 27–36.
- Ryan, E. M., T. J. Sabin, J. F. Watts, and M. J. Whiting. 2018. “The Influence of Build Parameters and Wire Batch on Porosity of Wire and Arc Additive Manufactured Aluminium Alloy 2319.” Journal of Materials Processing Technology 262: 577–584.
- Samei, J., M. Amirmaleki, M. Shirinzadeh Dastgiri, C. Marinelli, and D. E. Green. 2019. “In-Situ X-Ray Tomography Analysis of the Evolution of Pores During Deformation of AlSi10Mg Fabricated by Selective Laser Melting.” Materials Letters 255: 126512.
- Sha, G., and A. Cerezo. 2004. “Early-Stage Precipitation in Al–Zn–Mg–Cu Alloy (7050).” Acta Materialia 52 (15): 4503–4516.
- She, H., D. Shu, W. Chu, J. Wang, and B. Sun. 2013. “Microstructural Aspects of Second Phases in As-Cast and Homogenized 7055 Aluminum Alloy with Different Impurity Contents.” Metallurgical and Materials Transactions A 44 (8): 3504–3510.
- Shimokawa, T., T. Niiyama, T. Miyaki, M. Ikeda, and K. Higashida. 2022. “A Novel Work Hardening Mechanism of Nanoscale Materials by Grain Boundary Transformation.” Acta Materialia 224: 117536.
- Sing, S. L., C. N. Kuo, C. T. Shih, C. C. Ho, and C. K. Chua. 2021. “Perspectives of Using Machine Learning in Laser Powder Bed Fusion for Metal Additive Manufacturing.” Virtual and Physical Prototyping 16 (3): 372–386.
- Sokoluk, M., C. Cao, S. Pan, and X. Li. 2019. “Nanoparticle-Enabled Phase Control for Arc Welding of Unweldable Aluminum Alloy 7075.” Nature Communications 10: 1.
- Suryawanshi, J., K. G. Prashanth, S. Scudino, J. Eckert, O. Prakash, and U. Ramamurty. 2016. “Simultaneous Enhancements of Strength and Toughness in an Al-12Si Alloy Synthesized Using Selective Laser Melting.” Acta Materialia 115: 285–294.
- Teng, G. B., C. Y. Liu, Z. Y. Ma, W. B. Zhou, L. L. Wei, and Y. Chen. 2018. “Effects of Minor Sc Addition on the Microstructure and Mechanical Properties of 7055 Al Alloy During Aging.” Materials Science and Engineering: A 713: 61–66.
- Teng, X., H. Mae, Y. Bai, and T. Wierzbicki. 2009. “Pore Size and Fracture Ductility of Aluminum Low Pressure Die Casting.” Engineering Fracture Mechanics 76 (8): 983–996.
- Wang, W., Q. Pan, X. Wang, Y. Sun, L. Long, and Z. Huang. 2018. “Mechanical Properties and Microstructure Evolution of Ultra-High Strength Al-Zn-Mg-Cu Alloy Processed by Room Temperature ECAP with Post Aging.” Materials Science and Engineering: A 731: 195–208.
- Xu, D., Z. Li, G. Wang, X. Li, X. Lv, and Y. Zhang. 2017. “Phase Transformation and Microstructure Evolution of an Ultra-High Strength Al-Zn-Mg-Cu Alloy During Homogenization.” Materials Characterization 131: 285–297.
- Xue, C., Y. Zhang, P. Mao, C. Liu, Y. Guo, and F. Qian. 2021. “Improving Mechanical Properties of Wire Arc Additively Manufactured AA2196 Al–Li Alloy by Controlling Solidification Defects.” Additive Manufacturing 43: 102019.
- Yu, Z., T. Yuan, M. Xu, H. Zhang, X. Jiang, and S. Chen. 2021. “Microstructure and Mechanical Properties of Al-Zn-Mg-Cu Alloy Fabricated by Wire + Arc Additive Manufacturing.” Journal of Manufacturing Processes 62: 430–439.
- Zhang, X., Z. Xiao, W. Yu, C. K. Chua, L. Zhu, and Z. Wang. 2021. “Influence of Erbium Addition on the Defects of Selective Laser-Melted 7075 Aluminium Alloy.” Virtual and Physical Prototyping, Epub ahead of print. https://doi.org/https://doi.org/10.1080/17452759.2021.1990358.
- Zhong, H., B. Qi, B. Cong, Z. Qi, and H. Sun. 2019. “Microstructure and Mechanical Properties of Wire + Arc Additively Manufactured 2050 Al–Li Alloy Wall Deposits.” Chinese Journal of Mechanical Engineering 32: 1.
- Zhou, Y., X. Lin, N. Kang, W. Huang, and Z. Wang. 2021. “Mechanical Properties and Precipitation Behavior of the Heat-Treated Wire + Arc Additively Manufactured 2219 Aluminum Alloy.” Materials Characterization 171: 110735.
- Zhou, Y., X. Lin, N. Kang, W. Huang, J. Wang, and Z. Wang. 2020. “Influence of Travel Speed on Microstructure and Mechanical Properties of Wire + Arc Additively Manufactured 2219 Aluminum Alloy.” Journal of Materials Science & Technology 37: 143–153.
- Zhu, Z., F. L. Ng, H. L. Seet, W. Lu, C. H. Liebscher, Z. Rao, et al. 2021. “Superior Mechanical Properties of a Selective-Laser-Melted AlZnMgCuScZr Alloy Enabled by a Tunable Hierarchical Microstructure and Dual-Nanoprecipitation.” Materials Today. Epub ahead of print. https://doi.org/https://doi.org/10.1016/j.mattod.2021.11.019