
 ?Mathematical formulae have been encoded as MathML and are displayed in this HTML version using MathJax in order to improve their display. Uncheck the box to turn MathJax off. This feature requires Javascript. Click on a formula to zoom.
ABSTRACT
The varying physical property in a functionally graded material can be tailored to its specific requirements while using material resources effectively. 3D concrete printing can produce robust and lightweight functionally graded material for the construction industry. In this study, an approach was developed to create an objective tailored functionally graded concrete material by examining the filament material property correlations with the printing parameters. It was found that the physical property of the printed material is closely correlated to the flow rate and travel speed of the printer. Results obtained from the experiment show that the optimised structure achieved an approximately 50% improvement in the strength-to-weight ratio. This preliminary examination of the 2D optimised concrete structure opens the realm of possibility for future work in 3D optimised functionally graded concrete.
Highlights
A 3D printing method was developed for functionally graded concrete material was developed.
The method varied the printing parameters to control the material properties.
Optimised structures with various volume fractions were printed by this method.
Printed samples show an approximately 50% strength-to-weight ratio improvement.
1. Introduction
1.1. Background
Functionally graded materials (FGM) are inhomogeneous that have a gradual transition of properties by location (Oxman Citation2011). It usually comprises different material properties engineered to perform a multi-functional role. This type of material has an enormous impact on cost, material and energy-saving (Oxman Citation2011; Dey et al. Citation2022). However, due to the limitation in the conventional method of casting concrete, functionally graded cementitious material (FGCM) is not common in the building and construction (B&C) industry. It is even more uncommon for porosity gradient functionally gradient concrete material, where the porosity within a specific region of the concrete changes according to its requirement. Such material is more prevalent in the biomedical industry. Usually, the material intended to be replaced has functionally graded porosity in nature, and the graded porosity would help in the integrations of the implant and the surrounding tissue (Mahamood and Akinlabi Citation2017).
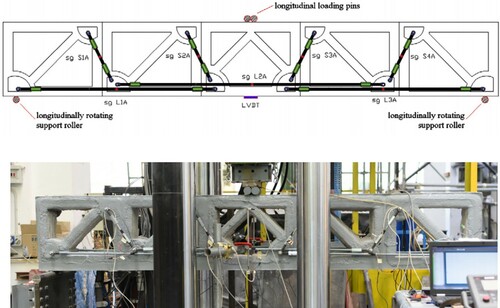
In recent years, the interest in using three-dimensional (3D) printing for the B&C industry has increased (Tay et al. Citation2017; Delgado Camacho et al. Citation2017). This manufacturing method can create complex structures without the need for formwork. Additionally, 3DCP’s layer-wise manufacturing method can produce FGM due to its precise and automated control over the deposition and build-up of objects. Most research work in 3D concrete printing focuses on new printable materials and possible designs to improve the mechanical strength (Paul et al. Citation2018; Figueiredo et al. Citation2019; Chen et al. Citation2019; Panda, Pual, and Tan Citation2017). There is a dearth of research on the topological optimisation of the printed structure, particularly in the direction perpendicular to the print path. Considering that this manufacturing technique produces a structure in an additive manner, should the amount of material deposition be controlled through topology optimisation, a structure with different mechanical properties can be created. Additionally, printing an FGCM structure helps improve the strength to weight ratio, economising on the load-bearing requirements of the structure and use resources effectively. Asprone et al. (Citation2018) demonstrated the concept of printing a concrete beam with reinforcement. shows the flexural test set-up of the printed reinforced concrete (RC) beam, which has an initial flexural stiffness comparable with a full solid RC beam. Similar work was carried out by Salet et al. (Citation2018) whose team printed a full-scale concept bridge with characteristic 3DCP lattices. The lattices reduce the overall material consumption compared to a solid beam design. Due to safety consideration, the bridge was reinforced heavily to ensure that the 3D printed bridge would function as intended. The reinforcement cable withstands the tensile load, and the compressive loads were supported by the concrete struts. SimilarlyNguyen-Van et al. explored the use of plastic scaffold to reinforce cementitious beams (Nguyen-Van et al. Citation2022). Although these works were not topologically optimised, they prove that printing concrete struts in the beam can improve the performance.
Figure 1. 3D printed reinforced concrete beam (Asprone et al. Citation2018).
1.2. Related works
Limited by the conventional manufacturing technique and the cost to create freeform structures, the existing beam and column topologically optimised are not common. Optimised, geometrically complex structures can economise on material saving while not compensating in structural degradation. This improves the strength to weight ratio. Material saving can also help reduce redundant load-bearing requirements from the structural elements (Zhang and Gjvorv Citation1991; Choudhry, Panda, and Kumar Citation2022). Alteration to the formwork using the conventional method to create material saving elements requires additional time and money, ultimately losing the incentive to optimise the structure.
1.2.1. Functionally graded concrete material
Jeffery et al. (Roesler et al. Citation2007) experimented to study functionally graded concrete material (FGCM) for rigid pavement. Fibre-reinforced concrete (FRC) and plain cement concrete (PCC) fabricated four configurations of functionally layered concrete materials: PCC-PCC, FRC-FRC, PCC-FRC and FRC-PCC, with the first mixture on the top and the second mixture on the bottom. A flexural bending test characterised the fracture behaviour of the samples with different configurations. According to Jeffery et al. (Roesler et al. Citation2007), the application of FGCM for rigid pavement shows promising results in flexural test and computational modelling. Concrete specimens with FRC have a better residual strength than pure PCC specimens. Hence, it is possible to achieve higher performance at a lower cost by having layers within the concrete pavement surface with a specific function.
Nazari and Sanjayan (Citation2015) experimented to understand how different volume percentages of a functionally graded geopolymer made by two geopolymer mixtures affect the compressive strength. Unlike the production method by Jeffery et al., there is a transition phase between the two geopolymer layers instead of having two distinct layers. According to their results, all the FGM specimens have achieved higher compressive strength than anticipated. The strength of these specimens is affected by the thickness of the constituent layers and the position of the functionally graded layers.
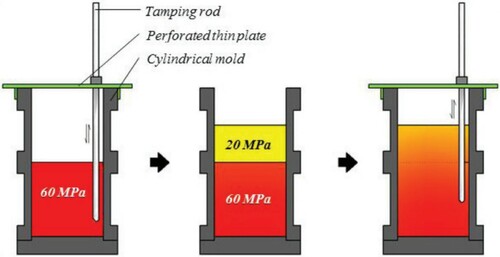
Oxman, Keating, and Tsai (Citation2011) designed and produced a rapid fabrication apparatus to vary the properties of the cellular material, as shown in . The work focuses on cementitious foam material, where the density is controlled by the production of hydrogen gas bubbles by the reaction of the aluminium powder and lime. The results show that a graded beam with 9% less mass can support the same load as a solid beam of the same size. Besides using the material chemical reaction, a liner density gradient concrete can be created with mechanical means (Choudhry, Panda, and Kumar Citation2022; Roesler et al. Citation2007). A compacting equipment can create a smooth graded concrete in the transition zone between the different mixtures with different material strengths. As shown in , the higher and lower concrete strength layers are mixed with the temping rod. The ultimate strength of this graded material follows closely to the strength of the lower concrete strength layer (Han, Gan, and Pratama Citation2016). On the other hand, the material stiffness is affected by the lower and high concrete strength layers (Han, Gan, and Pratama Citation2016). It appears that this lower concrete strength layer failed first upon reaching the ultimate load, while the higher concrete strength layer remained intact after testing (Gan, Aylie, and Pratama Citation2015).
Figure 2. Radial and linear density gradient of concrete samples (Oxman, Keating, and Tsai Citation2011).
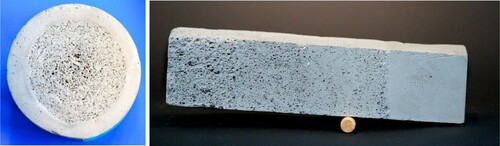
Figure 3. Compacting method to create a linear graded concrete (Gan, Aylie, and Pratama Citation2015).
1.2.2. Functionally graded printed material
Loh et al. (Citation2018) presented two types of FGMs in additive manufacturing: single-material functionally graded additive manufacturing (FGAM) and multi-material FGAM. Single-material FGAM can create a density gradient by fine-tuning the microstructure across the volume of the bulk material (Kieback, Neubrand, and Riedel Citation2003). This FGAM process can create biological inspired rapid fabrication such as the radial density gradient in palm trees. This approach varied the densification to produce lightweight structures by modifying the lattice arrangement and varying the strut geometry to retain its structural strength (Aremu et al. Citation2017).
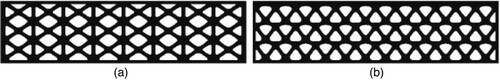
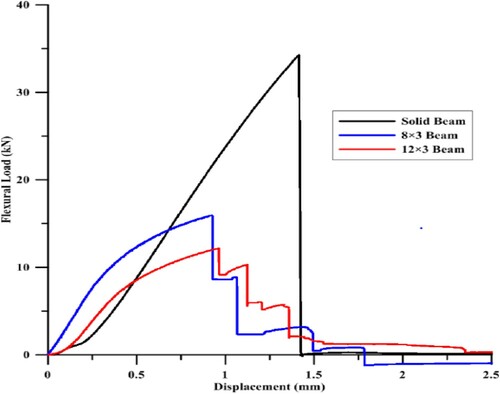
Rashid et al. (Citation2018) experimented to study how topology optimised printed metal beam fair against a regular solid beam under a three-point bend test. To create a complex optimised structure, a case study of a simple bending beam was made. Two topology optimised structures were generated using a modified topology optimisation algorithm, as shown in .
Figure 4. (a) 8 × 3 Periodic lattice topology optimisation design (b) 12 × 3 Periodic lattice topology optimisation design (Rashid et al. Citation2018).
A three-point bending test was conducted on these two structures, and the results were compared to a regular solid beam. Based on the results, a graph of flexural load and displacement was plotted, as shown in . The optimised lattice unit beam absorbed more energy per unit volume than the solid beam. The reason was that the fracture occurs one after another along the loading direction, which allows increased energy absorption by the links before complete failure, while the sold beam fails almost instantaneously with the initial crack (Rashid et al. Citation2018). van den Heever et al. (Citation2022) proposed different finite element modelling strategies for 3D printed elements. These models are used to predict the hardened state structural capacity and failure mechanisms of the fibre-reinforced printed concrete beams under various loading configurations. Results were validated with the mechanical performance of a 3D printed concrete beam with lattice cross-sections. The optimised lattice units could potentially open up avenues to improve the strength to weight ratio by replacing solid material with it (Rashid et al. Citation2018).
Figure 5. Load vs. displacement graph (Rashid et al. Citation2018).
Martens et al. (Citation2018) present work on optimising 3D printed concrete structures that incorporate the orthotropic properties of the printed concrete. The 3D concrete printer manufacturing constraint was also considered in the topology optimisation algorithm. This adoption of topology optimisation in concrete structures can save material, which can potentially create sustainable and cost-efficient structures (Martens et al. Citation2018). However, their investigation only introduces the methodology and algorithm to optimise the structure for stiffness, and the work proposed was not validated with actual printing.
The geometry and the material arrangement of the phase-in multi-material FGAM control the overall properties and functions of the printed item. Common failures in multi-material FGAM are delamination and cracks caused by the surface tension due to discrete changes in material properties. To overcome this challenge, the different material boundaries can be removed by a heterogeneous compositional transition with smooth concentration gradients (Loh et al. Citation2018). Combining two materials with smooth concentration gradients, the printed component can have the optimum properties of both materials. Small sections or strategic locations around pre-determined parts with site-specific properties can be tailored with multi-material FGAM (Vaezi et al. Citation2013).
Leu et al. (Citation2012) use a freeze-form extrusion fabrication (FEF) method to fabricate a 3D printed functionally graded material. An extruder was designed with three individual plungers with different pastes. This extruder development is the proof of concept for a triple-nozzle system to allow the different material compositions to be extruded. The triple-extruder FEF system could mix multiple aqueous pastes according to the required mix composition by varying the plungers’ velocities. This extruded mixed paste can be used to fabricate 3D functionally graded parts layer-by-layer with the desired material gradient, as shown in . However, the main challenge is the coordination between the three plungers to maintain a consistent flow at the end of the nozzle. If any plungers is not synchronised, breakage or overflow might occur.
Figure 6. Functionally graded material with different material compositions (Leu et al. Citation2012).
shows the different techniques of creating 3D printed FGCM. It is by varying the amount of material added to the printed structure at a specific print location. This is carried out using a Y-shaped nozzle, as shown in (a,b). Ahmed et al. (Ahmed et al. Citation2020) focus on adding varying quantities of fibres. An air blower transfered different quantities of fibres to the mixer before extrusion. The control of the addition of the fibre allows on-demand functional grading of the printed specimen. On the other hand, Craveiro et al. (Citation2020) researched the amount of cork quantity to be exchanged in the filament. The graded filament is created by controlling the flow rate of two materials: one with cork aggregates and the other with sand aggregates. As per Craveiro et al., this can improve the lightweight and thermal properties.
Figure 7. 3D printing for FGCM for; (a) varying fibre deposition systems (Ahmed et al. Citation2020); (b) multi-material, especially for cock aggregates (Craveiro et al. Citation2020).
With 3D printing, FGMs can be created without intermixing with other materials. In this study, the effect of the change of material flow rate and nozzle travel speed on the printed filament dimensions is investigated. With the results, this study aims to create a concrete structure with a spatially varying microstructure for optimal structure efficiency and maximum strength-to-weight ratio. Considering that the low tensile strength of fresh concrete prohibits the printing of cantilevers of meaningful length, a support structure must be printed to print the main structure. This can be done by adjusting its volume flow rate or travel speed at a specific portion of the printing process to create an objective-tailored material property. To the best knowledge of the authors, this approach has never been made for concrete material.
2. Methodology
2.1. Materials preparation and experiment set-up
The maximum allowable particle size is 2 mm for the material to be delivered through the hose with a diameter of 25.4 mm, according to the pump specification. The main objective is to investigate the effects of the filament with different printing parameters; therefore, no additives were used to avoid increasing the complexity of this study (Tay, Qian, and Tan Citation2019b). Ordinary Portland cement (OPC, ASTM Type 1, Grade 42.5), silica fume (Undensified, Elkem), fly ash (Class F) and river sand were used in this study. shows the chemical composition of the cement, silica fume and fly ash. The fly ash is shown as a range due to the variance caused by different batches from the same source. shows the individual percentage retained and the cumulative percentage passing the result of the raw material obtained from the particle size analyser (Malvern Mastersizer). The material mix design used cannot be disclosed due to the non-disclosure agreement with the collaborators.
Figure 8. (a) Cumulative percentage passing of raw material (b) Individual percentage retained of raw material.
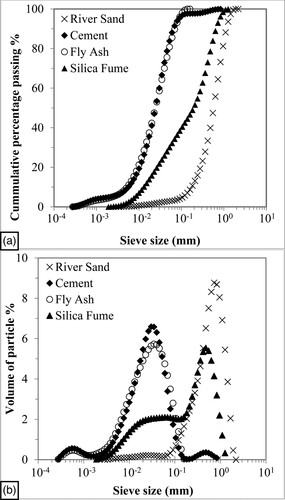
Table 1. Chemical composition (%) of fly ash, silica fume and cement.
After weighing, the dry materials were dry-mixed for 5 mins at 59 rpm to obtain a homogenous dry mixture. Water is then added to the mixture for mixing at slow speed (59 rpm) for 1 min and followed by 7 mins of high-speed mixing (198 rpm). After mixing, the material was placed in the pump’s hopper to be printed.
A gantry printer was used in this study, and using a positive displacement pump, the concrete is extruded out of the nozzle. The shapes and sizes of the nozzles determine the dimension and geometry of the concrete filament. Hence, it is vital to select the right nozzle for the print. Furthermore, the print path of the structure in this investigation has many sharp corners to navigate. Therefore, a round nozzle with a 12 mm diameter was selected for this investigation to print the two-dimensional optimised structure in three dimensions. The printed samples were encased with a plastic sheet during the curing process to prevent moisture loss. The control sample was cast in a mould with a 450 × 100 × 100 mm (length × width × height) after mixing. This dimension was selected based on the maximum allowable size that we can fit in our flexural testing machine. The samples were demoulded after 24 h and wrapped with the plastic sheet throughout the curing process. Three specimens were prepared for printing parameters and control samples for flexural testing. These samples were cured under laboratory conditions with an ambient temperature of 22.5°C and 61% humidity for 28 days before testing, and the experimental results are shown in Section 3.
2.2. Parameters’ characterisation test
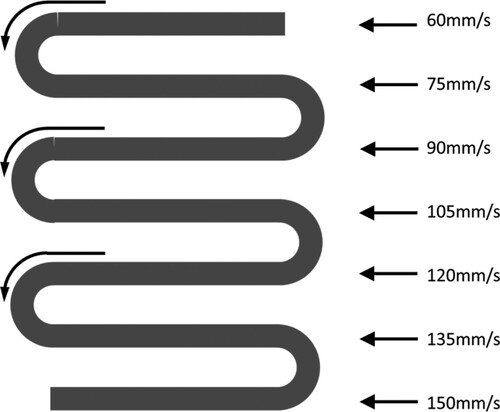
This study uses two parameter characterisation tests. The first characterisation test is the s-shaped printing test, where seven flowrates (6, 9, 12, 16, 19, 22 and 24 ml/s) and seven travel speeds (60, 75, 90, 105, 120, 135 and 150 mm/s) are used in this characterisation. The printing parameters were chosen to map out the printable range of the printer and the material. The gantry printer was programmed to print an s-shaped path with seven nozzle travel speeds at a specific volume flowrate. Each row of the filament within the s-shaped test represents one travel speed, and this travel speed changes in an ascending manner based on the order of the list above (See ). This test is repeated seven times at different flow rates. This test maps out the printable range of the printing parameter. Some printing parameters can cause poor structural integrity due to defective material or dimensional error due to an excess amount of material.
Figure 9. S-shaped printing test print path.
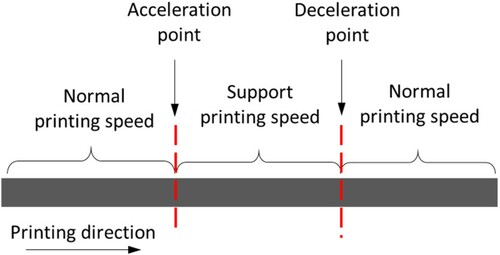
The second parameters characterisation test is the acceleration–deceleration printing test. This print path prints only one filament and has a consistent flow rate; however, the nozzle travel speed changes within the single row. This test characterised the effect of the acceleration and deceleration of the nozzle have on the printed filament. The top view of the print path for this test is shown in . The travel speed of the nozzle increases from the selected normal printing speed to the support structure printing speed and back to the normal printing speed in a single row. This helps capture the effect of the acceleration and deceleration of the nozzle travel speed have on the printed filament.
Figure 10. The top view of a schematic drawing of the acceleration-deceleration test print path.
2.3. Topology optimisation
Topology optimisation is a numerical optimisation module to find the optimal material distribution in the material subjected to constraints. Literature has widely adopted the common strategy of using topological optimisation to generate an FGM design model (Paulino and Silva Citation2005). In this paper, a topology optimisation method finds the optimal design for the beam under defined loading conditions. This simulation was performed to as a guide to create the optimised structure for the experimental programme.
Topology optimisation was performed on the Messerschmitt–Bölkow–Blohm (MBB) beam problem with a dimension of 450 × 100 × 100 mm. The beam has two simple supports at each end, and a constant load is applied in the middle. With the initial design, properties of the material, and external constraint established, the topology optimisation process determines the optimum method by effectively removing elements from the analysis with the software Abaqus (Larsson Citation2016). Structural optimisation using Abaqus is an iterative design process that refines the part design subjected to design constraints and objectives. The result of the structural optimisation would produce a lightweight and rigid part, which can bear the same structural load as its original unoptimised design.
The finite element modelling uses the Concrete Damaged Plasticity to capture the nonlinearity of concrete (Concrete damaged plasticity Citation2017). In the Concrete Damaged Plasticity model, the isotropic damages elasticity can model the compressive plasticity and the isotropic tensile plasticity, thereby representing the inelastic behaviour of the modelled concrete. The concrete might undergo isotropic stresses during fracture when subjected to service loads.
During uniaxial compression, the stress–strain response curve remains linear until its yield point. After yielding, the concrete undergoes plastic deformation, and strain hardens until its ultimate stress point. After the ultimate stress point, the concrete stain softens until the end of the test. Under uniaxial tension, the concrete’s response curve similarly displays a linearly elastic before yielding. During the plastic phase, the microcracks develop in the concrete cement paste matrix. The microcracks form a crack network with microcracks and cracks. After the ultimate stress point, the concrete undergoes strain-softening response. The compression crushing and tensile cracking described above generally represent the concrete response when undergoing flexural loading and are suitable for our simulation. The values in the simulation were retrieved from the existing literature as the aim of the simulation is to provide a benchmark for the experimental programme (Esfahani et al. Citation2017). The objective function of the optimisation is to minimise the strain energy, in effect maximising the stiffness of the optimising structure while constraining the volume of the structure (Bendsoe and Sigmund Citation2004). (a) shows the MBB beam problem.
Figure 11. (a) A MBB beam problem with the initial design dimensions (b) Centre-point loading method set-up.
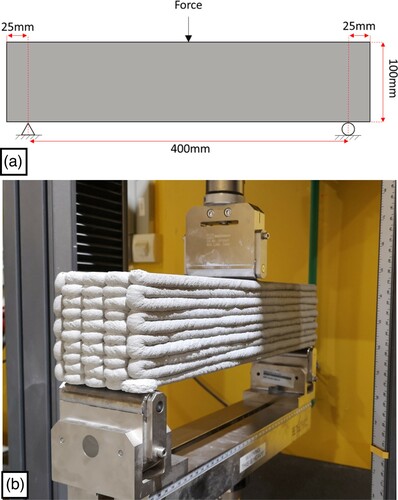
All samples were tested with the centre-point loading method on a Universal Instron testing machine (Instron 5969). The experiment set-up is shown in (b). The loading rate, r, as shown in Equation (1), used for testing is obtained from the ASTM standard (ASTM C293/C293M-Citation16 Citation2016).
(1)
(1) where S is the maximum stress on the tension surface, b is the width of the specimen, d is the depth of the specimen, and L is the span length. Using Equation (1) (when S = 0.9 MPa/min), the loading rate is 1.5 kN/min.
2.4. Printing code generation
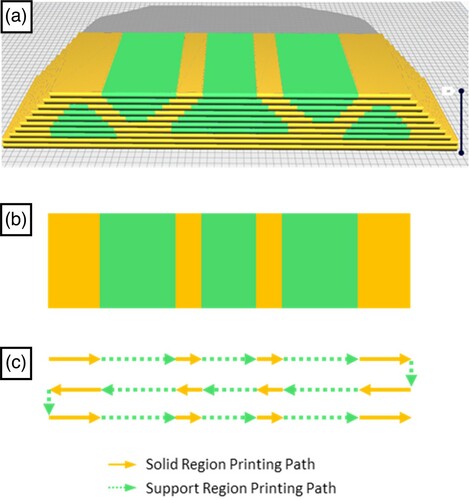
The STL files were fed into open source slicing software (Slic3r) to find the boundaries between solid and support regions. The STL files were sliced into layers, as shown in . The region in red denotes the overhanging portion that requires support. The G-code generated from the slicing software is further processed with a Python code before downloading into the gantry printer. A self-developed Python code extracted the boundary information from the generated G-code. The coordinates of the solid and support regions were read from the G-code, then the layer width was added into the solid region to find the real boundaries between the solid and support regions. Next, the coordinates of these boundaries generated the printing code of the parts, as shown in . For the solid region, the nozzle travels at a slow speed. For the support region, the nozzle travels at a faster speed.
Figure 12. The STL file and slicing preview in slicing software.
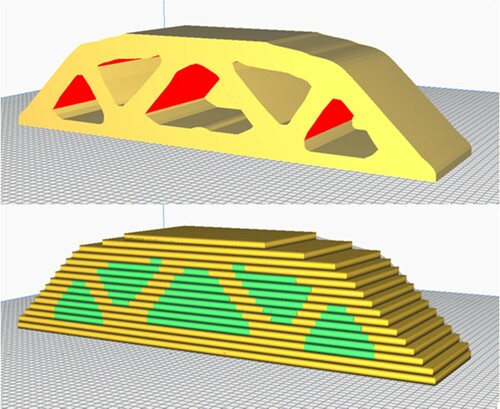
Figure 13. (a) The slicing preview of the 10th layers. (b) The top view of the 10th layer showing the solid and support regions (c) The longitudinal printing path for the 10th layer generated from extracted boundary coordinates with slowed down nozzle travel speed for some of the sections.
3. Results
3.1. S-shaped printing test
The investigations of the s-shaped printing test protocol gave an insight into the behaviour of the extruded material with different printing parameters. Three of the seven s-shape printing results are shown in , depicting the effect of the filament by varying the printing parameters. Forty-nine filaments were printed with various material flow rates and nozzle travel speeds. Consistent with the existing literature (Tay, Li, and Tan Citation2019a), the breakage in the filament increases as the travel speed increases or the flow rate decreases. The increase in the travel speed or reduction in the flow rate will decrease the solidity ratio (SR), as shown in Equation (2).
(2)
(2) As defined in the previous work (Tay, Li, and Tan Citation2019a), SR is the expected filament size, AP (mm2) is the cross-section area of the nozzle, v (mm/s)is the nozzle travel velocity, and Q (ml/s) is the flow rate of the material. When SR is more than 1, a larger filament is expected. When SR is lesser than 1, the filament will show more discontinuity and breakage (Tay, Li, and Tan Citation2019a). However, instead of quantifying the results with the SR value, a dimensionless value (Rm/i) (see Equation (3)), the difference in the surface area, is introduced.
(3)
(3) where As (mm2) is the printed specimen surface area, and Ai (mm2) is the ideal surface area calculated based on the diameter of the nozzle. Although the information that SR and Rm/i values provide is the same, the approach to obtaining the values is different. The flow rate of the printed material obtains the SR value; on the other hand, the surface area of the filament obtains the Rm/i value. Quantifying the filament using flow rate to obtain the SR value may not be accurate. Due to the material’s brittle nature, breakages appear in the filaments. These breaks were caused by the disproportionate flow rate of the material and the fast travel speed of the nozzle. The friction force between the substrate and the material that has been extruded causes a shear on the existing material at the nozzle, thus resulting in breakages. Furthermore, recording the flow rate of the material is a challenging process. Thus, capturing the top surface area using an image analysing software to obtain the Rm/i value seems to be a more rational solution and an easier approach to quantify the filament extruded.
Figure 14. S-shaped printing with round nozzle (a) 6 ml/s (b) 12 ml/s (c) 22 ml/s.
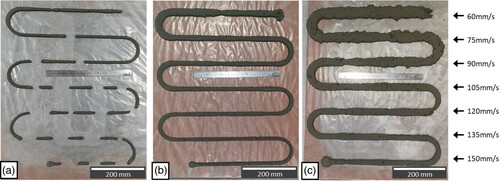
Although the s-shaped printing test has been carried out in previous research (Tay, Li, and Tan Citation2019a), the nozzle in this investigation has a different geometry. The size of the nozzle used in this study is much smaller. To achieve SR = 1, without changing the travel speed, the flow rate has to reduce.
The Rm/i value of the filament shown in was obtained using image analyzing software (ImageJ) as shown in . As shown in , the top surface areas of the variouos printing parameters were captured at a fixed length of 350 mm and were recorded as As. On the other hand, Ai is consistent, which is the width of the nozzle multiple by the length of the filament of 350 mm. Based on visual inspection, the filaments were separated into different regions, as denoted by the different shading colours, as shown in . The examination to divide the Rm/i into the different regions was recorded in the previous literature (Tay, Li, and Tan Citation2019a). When Rm/i values exceed 1.4, bulging starts to appear on the filament, which can cause dimension in-accuracy in the printed filament and is deemed to be the oversupply region. The previous literature shows that to print the support layer that will cause a deformation of less than 2 mm slump in the subsequent bridging layer, the Rm/i should be between 0.7 and 0.8. The intermediate region is between the normal printing region and support printing region with an Rm/i range of 0.8–1. This region is not suitable for printing the main structure because of the cracks that appear on the surface of the filament, which may reduce the strength of the main structure. It is also not desired for printing supports because the gap distance is too narrow in this region. This leads to the normal printing region having a Rm/i range of 1–1.4. In this region, the filament has high dimensional accuracy and minimum cracks on the surface.
Figure 15. Contour plot of the Rm/i.
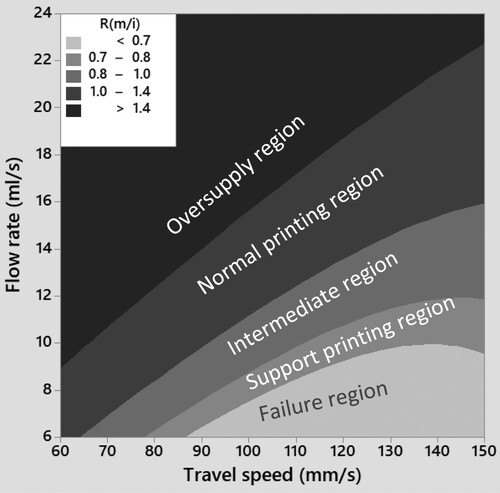
Table 2. Rm/i of filament obtained from ImageJ.
Although the s-shaped experiment protocol was established in previous literature (Tay, Li, and Tan Citation2019a), there is a difference in the investigation results. The nozzle used in this investigation has a different geometry to help navigate through the tight corners in the optimised structure. Although a rectangular nozzle can print filament with high stability and provide a high contact surface area between the top and bottom layer, it cannot print complex high-resolution models compared to a round nozzle. The round nozzle can follow more closely to the complex path than the rectangular nozzle. Due to this reduction in the size and shape of the nozzle, the range of Rm/i values is much higher than the previous research, as shown in . This high Rm/i value makes the material flow perpendicular to the printing path, and this phenomenon was not observed in the previous investigation.
3.2. Acceleration–deceleration printing test
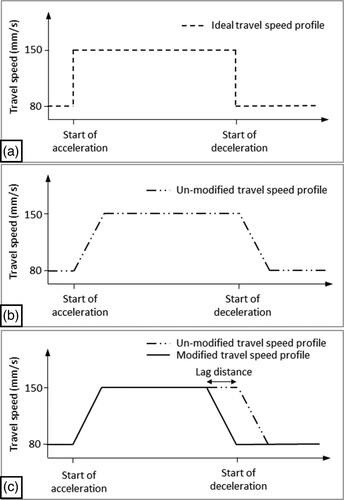
The change of the travel speed will cause acceleration or deceleration of the nozzle, as shown in . This acceleration and deceleration at a constant flow rate cause the filament to have a transition region. If there is no adjustment to accommodate this acceleration and deceleration of the nozzle speed, the structure printed may not achieve the actual dimensions. For this investigation, printing the normal section is paramount to avoid compromising structural integrity. Therefore, the actual deceleration of the travel speed has to start before the deceleration start point, shown in (c). The distance that needs to be compensated is illustrated as the lag distance.
Figure 16. (a) Ideal travel speed profile of the nozzle (b) Travel speed profile of the nozzle without modification (c) Travel speed profile of the nozzle with modification.
From the results in the s-shaped printing, the printing parameter was 10 ml/s at 80 and 150 mm/s for the normal printing and the supported printing, respectively. With the printing parameters known, the acceleration and deceleration printing test can be carried out, and the results are shown in . The acceleration and deceleration transition regions were marked by the red lines, and the distance between the lines was measured using image processing software (ImageJ). From the test result, the acceleration and deceleration cause a tapered filament to appear in this region. The length of this tapered region for acceleration and deceleration is 16.06 and 19.73 mm, respectively.
Figure 17. Acceleration-deceleration printing test.
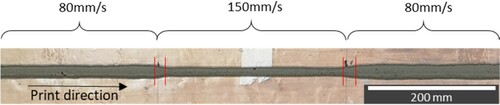
The acceleration and deceleration have a transition region, which starts near the mark, where the acceleration or deceleration begins. Printing without consideration of this acceleration and deceleration region can cause the support region and the solid region to deviate from their position and may cause the stresses from the loading to fail at a weaker region resulting in a weaker structure. The results concluded that the adjustment of the deceleration of the travel speed is more prominent than the acceleration region. This deceleration needs to be adjusted so that the strut of the optimised structure will not be compromised, and the lag distance is added into the code to accommodate this delay. On the other hand, no modification has to be made to the acceleration since it does not affect the normal printing region.
3.3. Topology optimised structure
The topology optimisation was performed on the simulation software (ABAQUS). The simulation was performed on two-dimensional (2D) only to determine if such an approach is achievable and prevent complicating the optimisation problem. The 2D model is prepared in Abaqus representing the initial design space of a conventional beam that is to be tested under a centre-point loading set-up. This initial design space measures 450 mm × 100 mm. For it to be printed and actual measurement of the flexural strength, the depth of the sample was given the same length as the height of 100 mm. The objective of the topological optimisation is to find the material distribution with a volume constraint in the given initial design domain such that the structure is the stiffest.
By imposing a volumetric constraint on the concrete beam, the key areas, where concrete must be extruded, were identified, and this forms the optimised structure. However, the non-essential area still needed to be printed to support the subsequent essential layer. The proposed approach uses a weaker material that acts as a support for the subsequent layers and does not contribute significantly to the overall material strength of the final printed beam. This causes an FGM material to be created with a gradual change in microstructure.
Mesh size can influence the results of the Abaqus analysis, such as stress, displacement, and energy. As the results are sensitive to the mesh size, it is reasonable to assume that the finer the mesh, the more accurate the results. However, a finer mesh would also result in more elements requiring more computational effort. A mesh sensitivity analysis would determine the optimal mesh size while maintaining a reasonable trade-off between accuracy and computation time.
As the FEM model is modelled after a three-point flexural test, the maximum tensile stress is located at the bottom node in the middle of the beam. The stress at the locations is observed as the mesh density of the FEM model increases. This mesh refinement was performed until a critical result, such as maximum stress in a specific location converges. Using a mesh size of 20 mm will produce a model with 110 elements, while a 3 mm mesh will produce a model with 4950 elements. shows the maximum in-plane stress of the model has converged with a mesh size of 5 mm. Therefore, topology optimisation would be conducted using a mesh size of 5 mm. The 2D model meshes into 1800 elements with a load of 50 N applied as a single load case.
Table 3. Mesh size and total element analysis.
The results of the topology optimisation converged, with different volume constraints, after numerous iterations giving a detailed shape of the final figure, are shown in . With the initial design, properties of the material, and external constraint established, the topology optimisation process determines the optimum method by effectively removing elements from the analysis. The optimisation results show a new design layout with internal struts as links between the loading points and the support points. The areas that do not contribute to the stress loading are removed and appear as voids. It is evident from the result that the topology of the structure has the same contour among the different volume fractions.
Figure 18. 2D optimised beam structure for the volume-fraction of (a) 20% (b) 40% (c) 60% (d) 80%.
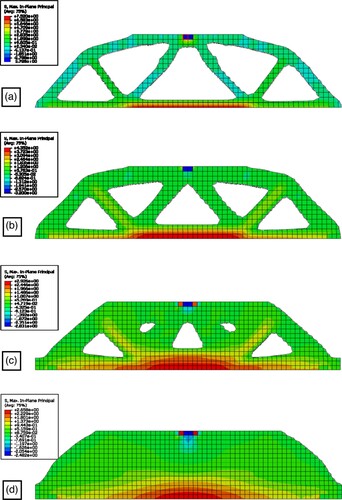
shows the collated result of the maximum stress in tension experienced by the different structures at different volume constraints given a constant load. As shown in , the maximum stress in tension concentrates at the bottom surface of the model. This proves to be the weakest region in the whole structure. Therefore, to increase the region’s strength, the thickness of the material at the region increases as the volume permissible increases. As the internal struts widen with an increase in the volume constraint, the maximum stress reduces.
Figure 19. Maximum stress of a 2D optimised structure at different volume constraints.
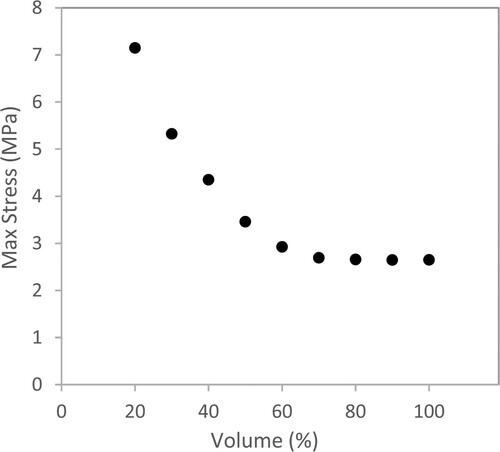
As shown in , the optimised structure with a volume-fraction constraint with 50% or lesser experiences more than 130% of the maximum stress compared to a structure with a volume-fraction constraint at 100%. On the other hand, the optimised structure with a volume-fraction constraint of 60% or more has less than 10% deviation in the maximum stress. To achieve a high strength structure, lower maximum stress experienced by the structure is necessary. Therefore, the 60% volume-fraction constraint structure is the optimum structure to be printed. Furthermore, the 80% volume-fraction constraint structure was printed to determine if the topology optimised 60% structure has an advantage compared to the 80% structure without the inner voids in terms of strength to weight ratio. The results obtained from the s-shaped printing test, acceleration–deceleration test and topology optimisation result generated the code for printing.
Results of the topology optimisation are refined and smoothened in the SolidWorks program. The 2D model was converted to a 3D model using the extruded function in this software by 100 mm. The SolidWorks part file was subsequently converted into an STL format file for processing in the Slic3r software. The voids in the 60P structure were printed with a support material, as described in Section 3.1. After slicing the model in the Slic3r software, the optimised model was modified at this stage to account for deceleration lag distance, as described in Section 3.2. The finally optimised model ready for 3D concrete printing is shown in .
Figure 20. 3D printed structure in the longitudinal direction with a volume-fraction of 100% (b) 80% (c1) a 2D optimised structure of 60% (c2) a 2D optimised structure of 60% with the outline of the strut.
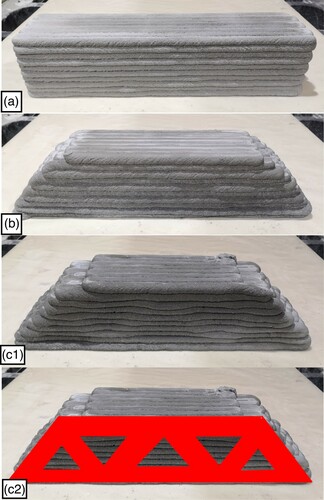
The struts of the optimised structure can also be seen from the contour of the surface of the 60P structure (See (c1)) compared to the 80P structure (See (b)). (c2) shows the outline of the optimised struts. The strength and weight ratio will be as an indicator to determine the improvement of using such printing technique. A control sample beam with a dimension of 450 × 100 × 100 mm (L × W × H) was cast. This allows the printed samples to be compared with the conventional manufacturing method.
3.4. Validation of results
Four samples were prepared for comparison. A 100% beam was cast (100C) and printed (100P), a sample with the 80% of the volume-fraction (80P) was printed, and the sample with the 60% volume-fraction (60P) was printed along the longitudinal direction. shows the fracture of the different samples. In the flexural test, the samples were subjected to a bending motion. This motion causes the top half section to be in compression and the bottom half to be in tension. As concrete is weak under tension, cracks propagated from the bottom layer under the loading point.
Figure 21. Photo of tested samples (a) 100C (b) 100P (c) 80P (d) 60P.
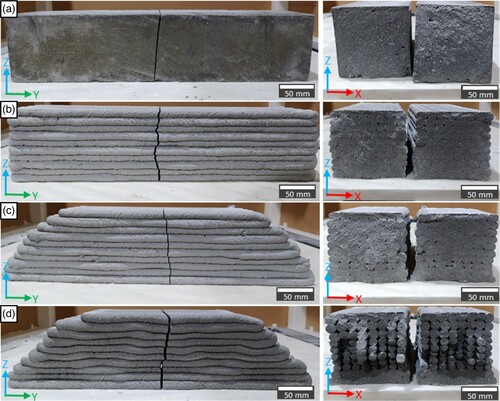
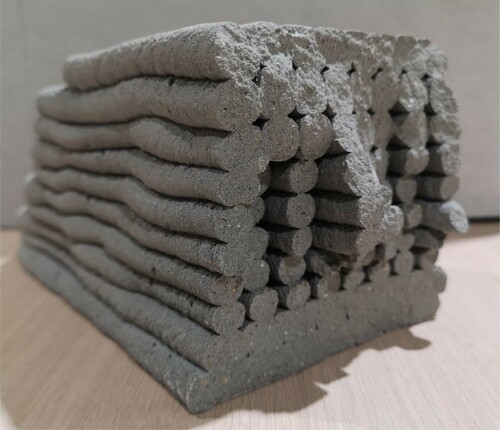
As shown in , all samples fail in the middle section, under the loading point. From (a)–(c), it can be seen that the samples have a flat crack across the fracture surface (in the x and z-axis direction). As with unreinforced concrete, it is common to see a single vertical crack under the load point, as that is the location of max stress and where concrete is most likely to fail. The unreinforced nature of the concrete and use of small aggregates also cause the crack to be sudden as there is no reinforcement to arrest the crack, and the crack surface is smooth. Although printed with different volume-fractions, the fracture surfaces for (b,c) were similar, with the iconic voids in-between the filaments when a round nozzle was used. These voids between the filaments are created due to the geometrical shape of the round nozzle, which made a rounded filament.The cross-section of the filament in (b,c) has a consistent geometry throughout the structure. However, for (d), the crack propagation was different, the crack propagation in the z-axis direction was independent of the x-axis (see ). Furthermore, the cross-section of the filaments did not have the same geometry thought the structure. The filaments were more compact at the top and bottom surfaces and more loosely packed in the middle range. Moreover, the filaments in (d) seem to be stacked in individual filament column and not in contact with the neighbouring filament column, as shown in .
Figure 22. Diagonal view of the 60P sample.
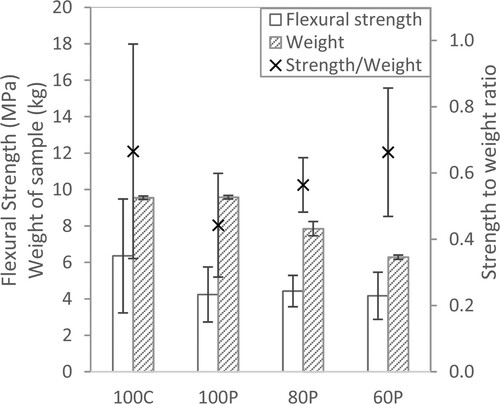
The flexural strength, weight and strength-to-weight ratio of the samples are shown in . The weights of the 100C and 100P are comparable; however, the 100P sample shows a lower flexural strength (approximately 35% lesser). This result is due to the lack of fusion between the interbonding as seen from (a,b), which can impair the mechanical and thermo-mechanical performance in the hardened concrete (Kruger and van Zijl Citation2021). This result is also in good agreement with the existing literature (Le et al. Citation2012). The decrease in the flexural strength of the printed sample reduces the strength-to-weight ratio significantly since the weights of the 100C and 100P are similar. On the other hand, the flexural strengths obtained for the 100P, 80P and 60P samples are similar. As the weight of the sample reduces through topology optimisation, the strength-to-weight ratio increases. It shows an increase of approximately 50% in the strength-to-weight ratio when the 60P optimised structure is compared to a fully printed 100P structure. The authors have observed that the variance of the 100C specimen is high compared to the printed specimens. The impurities in the fly ash could be one of the reasons that cause this huge difference. In the existing literature, research has pointed that contrary to expectation, fly ash obtained from the same source can be contaminated with varying amounts of impurities (Antoni et al. Citation2017). These impurities can subsequently impact and cause large variations in the strength of concrete.
Figure 23. Flexural strength, weight and the strength-to-weight ratio of different samples.
The amount of savings in terms of time and material are shown in . The saving is a comparison between the optimised and the non-optimised printed samples. The estimation of the printing time for the different printed structures can be achieved using open-source slicing software. On the other hand, the weights of the material used were recorded and compared to determine the material saved. The saving in both cases does not amount to a perfect 40% for the 60P and 20% for the 80P could be due to the losses in the resolution of the printed samples caused by the layering manufacturing method. This difference can be observed in .
Table 4. Estimated printing time and material used with respective savings for the different samples.
4. Discussion
From the authors’ previous work, it was found that the print speed and flow rate have a great influence on the flow of the material extruded out of the nozzle (Tay, Li, and Tan Citation2019a). Breakage in the filament or overflowing of material can happen when there is an asymmetry in flow rate and travel speed. While the layer and nozzle size or shape is a crucial part of the printing parameters, in the most printing process, the nozzle size or shape is fixed, and the optimised layer height will be determined by the nozzle size or shape (Salet et al. Citation2018). Varying the layer thickness could affect the layer width and result in a dimensional error (Carneau et al. Citation2020). Therefore, in the context of this paper, where the localised control on the amount of material to be deposited is the main focus, the layer height and nozzle orifice are less significant than the material flow rate and the nozzle travel speed printing parameter.
The decrease in the weight of the sample is due to the different types of material properties that are printed. Rm/i is a dimensionless value proposed to determine the size of the filament. The filaments with different Rm/i value are shown in and . This difference was due to the change in the printing parameter. A high Rm/i value occurs when there was an excess of material being extruded per unit length of filament, which means the filament was more compacted and had a higher strength than filament with a low Rm/i value. From (b,c), it was observed that 100P and 80P samples have a similar cross-section in the middle of the sample. This similarity was due to the same printing parameter (material flow rate and nozzle travel speed) used for these two samples. The only difference was the material that was not printed at the top corners of the 80P sample. Through topology optimisation, these two corners were identified as the low-stressed region, which was not used effectively and can be removed (Mitropoulou et al. Citation2013). This removal of the material causes weight reduction without affecting the strength of the structure.
The first two layers at the bottom for all specimens had the same printing parameters. It was printed with a stronger material property to withstand the load. This was where the stress concentrates, as shown in . The crack formation also began from these bottom layers. Furthermore, through topology optimisation, the strut structure, as shown in (c2) was the more critical region. These struts ensured that the structure had a maximum stiffness at 60% volume constraint. By comparing (c1) and (c2), the contour of the optimised struts can be easily identified. These contours of the strut in (c2) were printed with a higher Rm/i value filament, and the concave surfaces were printed with a lower Rm/i value filament. Lesser material was extruded in these concave surfaces of the structure, causing a reduction in the structure’s weight. The gaps between the filament for the 60P, as shown in and were the concave region caused by the different printing parameters chosen to print this region. Instead of a normal filament similar to the 100P and 80P printed in this region, the 60P was printed with a support filament. This means lesser material will be printed, causing larger gaps between the filament, as shown in and . This change in the Rm/i value of the printed filament within the structure is the reason for the difference in the weight between the 80P and 60P samples. The 80P sample and the 60P sample cross-section can be seen in (c,d), respectively.
The existing literature investigating the cracking of concrete mostly revolves around homogenous concrete on the microscale (Huang et al. Citation2015; Lott and Kesler Citation1966) and has limited research on fracture analysis on non-homogenous concrete, especially in 3D concrete printing. The analysis of the failure mechanism is important so that solutions can be designed to develop strategies to prevent them in the future for concrete. In a homogenous concrete, the propagation of a crack under loading is influenced by the properties of the cementitious paste and the heterogeneity of the concrete (Lott and Kesler Citation1966). However, the cementitious paste and heterogeneity of the concrete also influence the crack propagation in non-homogenous concrete. For the non-homogenous concrete, such as 100P and 80P samples, the structure can only be seen as a homogenous material in the direction of the print path (y-axis), but the matrix arrangement in the filament could be different from the concrete manufactured by the conventional casting method. On the other hand, the printed material in the other directions (x and z-axis) have an interstitial void between the filament and could have crack lines appearing between the filament if the time gap was significantly large. Although these filaments have impurities such as voids and cracks in the x and z-axis, the close filament in contact in the x-axis influences the crack propagation on the neighbouring filament in the x-axis.
Although there was no apparent crack line form between the printed filaments, the interaction zone between filaments has been formed to present sites for void formation (Zhang et al. Citation2021). This possible site of void formation is unique and could be the source of anisotropy for 3DCP, which determines the directional strength and durability of 3DCP. Whereas in a homogenous mixture, an existing crack will propagate rapidly through the material if the total energy supplied by an external force and the change of the stored strain energy is more than the total energy required for the formation of the new crack (Lott and Kesler Citation1966). Furthermore, the crack did not propagate as one single crack (Kaplan Citation1961), but was formed by many micro-cracks in the paste content (Petersson Citation1981). These micro-cracks are present in the matrix and the matrix-aggregates interface even before any load was applied. Since 3D printing is a process without compaction, there could be a possibility that there are more micro-cracks present in the matrix, thus resulting in a much lower strength than the cast sample, as shown in .
From and , the crack pattern for 60P samples is much different from the rest. The cross-section of the printed structure in (d) shows how the support filament is printed as the layer progress. The first few layers at the bottom were printed as the normal filaments. These few layers had the same characteristic as the filament printed in 100P and 80P samples. They were more compact than the support filament. Furthermore, the crack propagation of these few layers affected the crack propagation of the neighbouring filaments. However, as the layer progresses, the support filament starts to separate from the neighbouring filament along the x-axis. Huang et al. show that the damage evolution process in the tension direction is that the crack nucleates around the voids and propagates through the weak interfacial transition zone (ITZ) (Huang et al. Citation2015). The crack tip usually propagates through the weakest region of the concrete. Since the filament was not in contact, there was no influence of the crack propagation direction on the neighbouring filament column; thus, these filament columns had different crack routes, as shown in .
Functionally graded concrete has many applications in the building construction industry. For example, having a functionally graded floor slab will lead to a considerable reduction in the weight and the material used. The area subjected to low compressive strength could be made up of high porosity concrete, while the area subjected to high compressive strength could be made up of low porosity concrete. Furthermore, a functionally graded wall can be used for this application where the gradual change in density and porosity within the wall will allow the differentiation in the load-bearing wall and non-load bearing wall, which can ultimately reduce the dead weight of the building. While the research work presented in this paper shows promising results, there are limitations in this study. The result obtained in Section 3 is only limited to the printer and material used. If a different mix or printer set-up is used, the results could be different. Nevertheless, this proposed approach allows the effect of the specific concrete mixture and printer set-up on the filament to be explored and to create FGCM. Next, the printing resolution is low due to the large nozzle size, and this printing method creates a stepwise structure. The accuracy and stepwise effect can be nominally reduced using a smaller diameter nozzle; however, in the current printing set-up with a single nozzle extrusion printing system, large aggregates in the mixture would have to be discounted. In the literature, a novel two-nozzle printing system, where the paste and aggregate are separated would allow for the inclusion of large aggregates (Yu, Du, and Sanjayan Citation2020); however such a novel system has shown greater void distribution therefore requires further study. Additionally, the topological optimisation was based on a homogenous material, and the layering effect was not incorporated in the optimisation. Future work can incorporate the layering effect into the topological optimisation to compare with the experimental result.
To the best knowledge of the authors, there is little literature available regarding structural optimisation on MBB beam with concrete material. This is because the manufacturing method to create such a beam is extremely costly without 3D printing. This experiment was printed with a 2D optimised design with a consistent cross-sectional area in the x-axis direction. The challenge for printing 2D optimisation is the overhanging elements that need to be addressed carefully; otherwise, such elements can collapse. Furthermore, the intricate design of the 2D optimised structure requires correct planning on the acceleration and deceleration of the nozzle, or the structure may become distorted and can jeopardise the structural integrity of the printed structure. 2D optimised structure in this preliminary study is only for the proof of concept and should be done before further exploration is useful. This study opens the possibility for future work in 3D functionally graded concrete. With the promising result in the 2D format, this research can be further explored in the 3D format. In the 3D optimised structure, the connection between the internal structures is considered and will be different from the 2D optimised structure. A 3D model will provide a more realistic simulation of the actual results than a 2D model as more variables are accounted for. However, this 3D optimisation will increase the number of iterations increasing the time needed to perform the optimisation process. This optimised 3D model may result in a structure more complex than the current 2D format. Nevertheless, the printing code generation and the printing process will remain similar. This printed structure may only resemble the simulated optimised design and may not be a complete replicate of the actual design due to the printer’s resolution.
5. Conclusion
The conventional method to create FGCM is by casting. While the specimen may have a gradient of different material properties, the change in the material property is usually layered due to the casting process. Topologically optimisation in the concrete structure would be impractical with this casting process. At the same time, creating functionally graded material (FGM) with different materials in 3D printing has its challenges. Delamination between layers and the complex coordination between the multiple nozzles are challenges. In this study, an approach was developed to create a topologically optimised structure with the advantage of reducing the complexity and the chance of delamination to create an objective tailored FGCM.
The effects of printing parameters on 3D printed concrete were conducted, and it was shown that the flow rate and travel speed play a huge role in the effects of the filament dimensions. The main advantage of having a functionally graded structure is using lesser material to achieve the same objective. Using the results in sections 3.1, 3.2 and 3.3, a carefully optimised functionally graded structure was printed. Additionally, the results in section 3.4 show an increase in the strength-to-weight ratio by approximately 50% when the optimised structure is compared to a fully printed 100P structure. The selection of the strength to weight ratio is dependent on the strength or weight requirement. If there is a requirement on the strength, the properties of the weight will have to be compromised and vice versa. On the other hand, if both properties are uncompromisable, then a different mix design will have to be formulated. This shows that through topology optimisation, this functionally graded material can be manufactured to produce a structure that has improved performance compared to the un-optimised structure.
Disclosure statement
No potential conflict of interest was reported by the author(s).
Additional information
Funding
Notes on contributors
Yi Wei Daniel Tay
Dr. Yi Wei Daniel Tay is currently working as a Research Fellow in Building and Construction programme of Singapore Centre for 3D Printing. He received both his B.Sc. (Eng.) and Ph.D. in Mechanical Engineering from Nanyang Technological University. His current research interest are the areas of Additive Manufacturing (AM), with emphasis on rheology for shear-thinning materials, functionally graded material and control of extrusion-based AM processes.
Jian Hui Lim
Dr. Jian Hui Lim is currently working as a Research Fellow in Building and Construction programme of Singapore Centre for 3D Printing. He received both his B.Sc. (Eng.) and Ph.D. in Mechanical Engineering from Nanyang Technological University. His research interest includes 3D Concrete Printing, printing path design and vision based geometric inspection. He is currently working on laser scanning for geometric inspection of large-scale 3D printed concrete.
Mingyang Li
Dr. Mingyang Li is currently working as a Senior Research Fellow in Building and Construction programme of Singapore Centre for 3D Printing. He received his Ph.D. from Missouri University of Science and Technology. His research interests are in the areas of Additive Manufacturing (AM), with emphasis on process modelling and control of extrusion-based AM processes.
Ming Jen Tan
Dr. Ming Jen Tan received both his B.Sc. (Eng.) and Ph.D. from The Royal School of Mines, Imperial College, London. He was Japan Society for the Promotion of Science (JSPS) Fellow at Kyoto University in 1991, Science & Technology Agency (STA) Fellow at the Mechanical Engineering Laboratory (A.I.S.T., M.I.T.I.), Tsukuba, Japan 1992-93, Visiting Scientist at Columbia University (2003) and Fulbright Scholar (2004) at both UCLA and Northwestern University in the U.S. He was previously Programme Director for Building & Construction at the Singapore Centre for 3D Printing (SC3DP), and currently the Director of the HP-NTU Digital Manufacturing Corporate Lab. Since 2019, he has been on the World Economic Forum's (WEF) Global Future Council on Advanced Manufacturing and Value Chains.
References
- Ahmed, Z. Y., F. P. Bos, M. C. A. J. van Brunschot, and T. A. M. Salet. 2020. “On-Demand Additive Manufacturing of Functionally Graded Concrete.” Virtual and Physical Prototyping 15 (2): 194–210. doi:https://doi.org/10.1080/17452759.2019.1709009.
- Antoni, A., J. Satria, A. Sugiarto, and D. Hardjito. 2017. “Effect of Variability of Fly Ash Obtained from the Same Source on the Characteristics of Geopolymer.” MATEC Web of Conferences 97: 1–6. doi:https://doi.org/10.1051/matecconf/20179701026.
- Aremu, A. O., J. P. J. Brennan-Craddock, A. Panesar, I. A. Ashcroft, R. J. M. Hague, R. D. Wildman, and C. Tuck. 2017. “A Voxel-Based Method of Constructing and Skinning Conformal and Functionally Graded Lattice Structures Suitable for Additive Manufacturing.” Additive Manufacturing 13: 1–13. doi:https://doi.org/10.1016/j.addma.2016.10.006.
- Asprone, D., F. Auricchio, C. Menna, and V. Mercuri. 2018. “3D Printing of Reinforced Concrete Elements: Technology and Design Approach.” Construction and Building Materials 165: 218–231. doi:https://doi.org/10.1016/j.conbuildmat.2018.01.018.
- ASTM C293/C293M-16. 2016. Standard Test Method for Flexural Strength of Concrete (Using Simple Beam with Center-Point Loading). West Conshohocken, PA: ASTM International.
- Bendsoe, M. P., and O. Sigmund. 2004. Topology Optimization: Theory, Methods, and Applications. doi:https://doi.org/10.1007/978-3-662-05086-6.
- Carneau, P., R. Mesnil, N. Ducoulombier, N. Roussel, and O. Baverel. 2020. Characterisation of the Layer Pressing Strategy for Concrete 3D Printing.” Second RILEM International Conference on Concrete and Digital Fabrication, 185–195.
- Chen, Y., S. Chaves Figueiredo, Ç Yalçınkaya, O. Çopuroğlu, F. Veer, and E. Schlangen. 2019. “The Effect of Viscosity-Modifying Admixture on the Extrudability of Limestone and Calcined Clay-Based Cementitious Material for Extrusion-Based 3D Concrete Printing.” Materials 12: 1374. doi:https://doi.org/10.3390/ma12091374.
- Choudhry, N. K., B. Panda, and S. Kumar. 2022. “In-Plane Energy Absorption Characteristics of a Modified Re-Entrant Auxetic Structure Fabricated Via 3D Printing.” Composites Part B: Engineering 228: 109437. doi:https://doi.org/10.1016/j.compositesb.2021.109437.
- Concrete Damaged Plasticity. 2017. Accessed11 November 2018. [Online]. https://abaqus-docs.mit.edu/2017/English/SIMACAEMATRefMap/simamat-c-concretedamaged.htm.
- Craveiro, F., S. Nazarian, H. Bartolo, P. J. Bartolo, and J. Pinto Duarte. 2020. “An Automated System for 3D Printing Functionally Graded Concrete-Based Materials.” Additive Manufacturing 33: 101146. doi:https://doi.org/10.1016/j.addma.2020.101146.
- Delgado Camacho, D., P. Clayton, W. O’Brien, R. Ferron, M. Juenger, S. Salamone, and C. Seepersad. 2017. Applications of Additive Manufacturing in the Construction Industry – A Prospective Review.” Proceedings of the 34rd International Symposium on Automation and Robotics in Construction, 246–253. doi:https://doi.org/10.22260/ISARC2017/0033.
- Dey, D., D. Srinivas, B. Panda, P. Suraneni, and T. G. Sitharam. 2022. “Use of Industrial Waste Materials for 3D Printing of Sustainable Concrete: A Review.” Journal of Cleaner Production 340: 130749. doi:https://doi.org/10.1016/j.jclepro.2022.130749.
- Esfahani, M. H., F. Hejazi, R. Vaghei, M. Jaafar, and K. Karimzade. 2017. “Simplified Damage Plasticity Model for Concrete.” Structural Engineering International 27: 68–78. doi:https://doi.org/10.2749/101686616X1081.
- Figueiredo, S. C., C. R. Rodríguez, Z. Y. Ahmed, D. H. Bos, Y. Xu, T. M. Salet, O. Çopuroğlu, E. Schlangen, and F. P. Bos. 2019. “An Approach to Develop Printable Strain Hardening Cementitious Composites.” Materials & Design 169: 107651. doi:https://doi.org/10.1016/j.matdes.2019.107651.
- Gan, B. S., H. Aylie, and M. M. A. Pratama. 2015. “The Behavior of Graded Concrete, an Experimental Study.” Procedia Engineering 125: 885–891. doi:https://doi.org/10.1016/j.proeng.2015.11.076.
- Han, A., B. S. Gan, and M. M. A. Pratama. 2016. “Effects of Graded Concrete on Compressive Strengths.” International Journal of Technology 7 (5): 530–538. doi:https://doi.org/10.14716/ijtech.v7i5.3449.
- Huang, Y., Z. Yang, W. Ren, G. Liu, and C. Zhang. 2015. “3D Meso-Scale Fracture Modelling and Validation of Concrete Based on In-Situ X-Ray Computed Tomography Images Using Damage Plasticity Model.” International Journal of Solids and Structures 67–68: 340–352. doi:https://doi.org/10.1016/j.ijsolstr.2015.05.002.
- Kaplan, M. F. 1961. “Crack Propagation and the Fracture of Concrete.” American Concrete Institute Journal Proceedings 58 (11): 591–610. doi:https://doi.org/10.14359/7999.
- Kieback, B., A. Neubrand, and H. Riedel. 2003. “Processing Techniques for Functionally Graded Materials.” Materials Science and Engineering: A 362 (1): 81–106. doi:https://doi.org/10.1016/S0921-5093(03)00578-1.
- Kruger, J., and G. van Zijl. 2021. “A Compendious Review on Lack-of-Fusion in Digital Concrete Fabrication.” Additive Manufacturing 37: 101654. doi:https://doi.org/10.1016/j.addma.2020.101654.
- Larsson, R. 2016. “Methodology for Topology and Shape Optimization: Application to a Rear Lower Control Arm.” Master Thesis, Department of Applied Mechanics, Chalmers University of Technology, Goteborg.
- Le, T. T., S. A. Austin, S. Lim, R. A. Buswell, R. Law, A. G. F. Gibb, and T. Thorpe. 2012. “Hardened Properties of High-Performance Printing Concrete.” Cement and Concrete Research 42 (3): 558–566. doi:https://doi.org/10.1016/j.cemconres.2011.12.003.
- Leu, M. C., B. K. Deuser, L. Tang, R. G. Landers, G. E. Hilmas, and J. L. Watts. 2012. “Freeze-Form Extrusion Fabrication of Functionally Graded Materials.” CIRP Annals 61 (1): 223–226. doi:https://doi.org/10.1016/j.cirp.2012.03.050.
- Loh, G. H., E. Pei, D. Harrison, and M. D. Monzón. 2018. “An Overview of Functionally Graded Additive Manufacturing.” Additive Manufacturing 23: 34–44. doi:https://doi.org/10.1016/j.addma.2018.06.023.
- Lott, J., and C. E. Kesler. 1966. “Crack Propagation in Plain Concrete.” Symposium on Structure of Portland Cement Paste and Concrete, Special Report No. 90, Highway Research Board, pp. 204–218. Accessed 10 September 2019. http://onlinepubs.trb.org/Onlinepubs/sr/sr90/90-017.pdf.
- Mahamood, R. M., and E. T. Akinlabi. 2017. Functionally Graded Materials. doi:https://doi.org/10.1007/978-3-319-53756-6.
- Martens, P., M. Mathot, F. Bos, and J. Coenders. 2018. “Optimising 3D Printed Concrete Structures Using Topology Optimisation.” High Tech Concrete: Where Technology and Engineering Meet, edited by D. Hordijk and M. Luković, 301–309. Cham: Springer. doi:https://doi.org/10.1007/978-3-319-59471-2_37.
- Mitropoulou, C. C., Y. Fourkiotis, N. D. Lagaros, and M. G. Karlaftis. 2013. “Evolution Strategies-Based Metaheuristics in Structural Design Optimization.” In Metaheuristic Applications in Structures and Infrastructures, edited by A. H. Gandomi, X.-S. Yang, S. Talatahari, and A. H. Alavi, 79–102. Oxford: Elsevier.
- Nazari, A., and J. G. Sanjayan. 2015. “Compressive Strength of Functionally Graded Geopolymers – Role of Position of Layers.” Construction and Building Materials 75: 31–34. doi:https://doi.org/10.1016/j.conbuildmat.2014.10.043.
- Nguyen-Van, V., N. K. Choudhry, B. Panda, H. Nguyen-Xuan, and P. Tran. 2022. “Performance of Concrete Beam Reinforced with 3D Printed Bioinspired Primitive Scaffold Subjected to Three-Point Bending.” Automation in Construction 134: 104060. doi:https://doi.org/10.1016/j.autcon.2021.104060.
- Oxman, N. 2011. “Variable Property Rapid Prototyping.” Virtual and Physical Prototyping 6 (1): 3–31. doi:https://doi.org/10.1080/17452759.2011.558588.
- Oxman, N., S. Keating, and E. Tsai. 2011. Functionally Graded Rapid Prototyping,” Proceedings of VRAP: Advanced Research in Virtual and Rapid Prototyping, 483–489. doi:https://doi.org/10.1201/b11341-78.
- Panda, B., S. C. Pual, and M. Tan. 2017. “Anisotropic Mechanical Performance of 3D Printed Fiber Reinforced Sustainable Construction Material.” Materials Letters 209 (15): 146–149. doi:https://doi.org/10.1016/j.matlet.2017.07.123.
- Paul, S. C., Y. W. D. Tay, B. Panda, and M. J. Tan. 2018. “Fresh and Hardened Properties of 3D Printable Cementitious Materials for Building and Construction.” Archives of Civil and Mechanical Engineering 18 (1): 311–319. doi:https://doi.org/10.1016/j.acme.2017.02.008.
- Paulino, G. H., and E. C. N. Silva. 2005. “Design of Functionally Graded Structures Using Topology Optimization.” Functionally Graded Materials VIII 492: 435–440. doi:https://doi.org/10.4028/www.scientific.net/MSF.492-493.435.
- Petersson, P. E. 1981. “Crack Growth and Development of Fracture Zones in Plain Concrete and Similar Materials.” Doctoral Dissertation, Dividion of Building Materials Lund Institute of Technology, Lund University. Accessed 30 August 2019. https://inis.iaea.org/collection/NCLCollectionStore/_Public/13/668/13668228.pdf.
- Rashid, R., S. H. Masooda, D. Ruan, S. Palanisamy, X. Huang, and R. A. R. Rashid. 2018. “Topology Optimisation of Additively Manufactured Lattice Beams for Three-Point Bending Test.” Annual International Solid Freeform Fabrication Symposium, 635–647.
- Roesler, J., G. Paulino, C. Gaedicke, A. Bordelon, and K. Park. 2007. “Fracture Behavior of Functionally Graded Concrete Materials for Rigid Pavements.” Transportation Research Record 2037 (1): 40–49. doi:https://doi.org/10.3141/2037-04.
- Salet, T. A. M., Z. Y. Ahmed, F. P. Bos, and H. L. M. Laagland. 2018. “Design of a 3D Printed Concrete Bridge by Testing.” Virtual and Physical Prototyping 13 (3): 222–236. doi:https://doi.org/10.1080/17452759.2018.1476064.
- Tay, Y. W. D., M. Y. Li, and M. J. Tan. 2019a. “Effect of Printing Parameters in 3D Concrete Printing: Printing Region and Support Structures.” Journal of Materials Processing Technology 271: 261–270. doi:https://doi.org/10.1016/j.jmatprotec.2019.04.007.
- Tay, Y. W. D., B. Panda, S. C. Paul, N. A. Noor Mohamed, M. J. Tan, and K. F. Leong. 2017. “3D Printing Trends in Building and Construction Industry: A Review.” Virtual and Physical Prototyping 12 (3): 261–276. doi:https://doi.org/10.1080/17452759.2017.1326724.
- Tay, Y. W. D., Y. Qian, and M. J. Tan. 2019b. “Printability Region for 3D Concrete Printing Using Slump and Slump Flow Test.” Composites Part B: Engineering 174: 1–9. doi:https://doi.org/10.1016/j.compositesb.2019.106968.
- Vaezi, M., S. Chianrabutra, B. Mellor, and S. Yang. 2013. “Multiple Material Additive Manufacturing – Part 1: A Review.” Virtual and Physical Prototyping 8 (1): 19–50. doi:https://doi.org/10.1080/17452759.2013.778175.
- van den Heever, M., F. Bester, J. Kruger, and G. van Zijl. 2022. “Numerical Modelling Strategies for Reinforced 3D Concrete Printed Elements.” Additive Manufacturing 50: 102569. doi:https://doi.org/10.1016/j.addma.2021.102569.
- Yu, S., H. Du, and J. Sanjayan. 2020. “Aggregate-Bed 3D Concrete Printing with Cement Paste Binder.” Cement and Concrete Research 136: 106169. doi:https://doi.org/10.1016/j.cemconres.2020.106169.
- Zhang, M. H., and O. E. Gjvorv. 1991. “Mechanical Properties of High-Strength Lightweight Concrete.” American Concrete Institute Materials Journal 88 (3): 240–247. doi:https://doi.org/10.14359/1839.
- Zhang, Y., Y. Zhang, L. Yang, G. Liu, Y. Chen, S. Yu, and H. Du. 2021. “Hardened Properties and Durability of Large-Scale 3D Printed Cement-Based Materials.” Materials and Structures 54 (1): 45. doi:https://doi.org/10.1617/s11527-021-01632-x.