
 ?Mathematical formulae have been encoded as MathML and are displayed in this HTML version using MathJax in order to improve their display. Uncheck the box to turn MathJax off. This feature requires Javascript. Click on a formula to zoom.
ABSTRACT
This study demonstrated that the gas flow direction in the laser beam powder bed fusion (PBF-LB) significantly affects the crystallographic texture evolved in the products. The effect on texture is attributed to the difference in the melt pool depth, which depends on gas flow direction. The melt pool was shallower when the laser scanning and gas flow directions were parallel than when they were perpendicular. This phenomenon should be of particular concern when applying Scan Strategy_XY wherein the laser was scanned with a 90° rotation in each layer, which is often used in PBF-LB. The asymmetry in the melt pool depth generated by laser scanning in the x- and y-directions can lead to unintended variations in the crystallographic texture. The gas phase would interact with a part being manufactured immediately beneath the gas and affect the crystallographic feature of the product.
GRAPHICAL ABSTRACT

1. Introduction
Additive manufacturing (AM) is the most notable metal-processing technology specialising in the accurate fabrication of arbitrarily shaped structures (Murr Citation2019; Blakey-Milner et al. Citation2021; Wang et al. Citation2020). Recently, the laser beam powder bed fusion (PBF-LB) method, a type of AM technology, has attracted attention as a process capable of controlling not only the shape of metallic materials but also their crystallographic textures (Gokcekaya et al. Citation2023; Liu et al. Citation2020; Ekubaru et al. Citation2022) and related mechanical and chemical functions (Ishimoto et al. Citation2017; Ren et al. Citation2020; Gokcekaya et al. Citation2020). In the PBF-LB process, inert gases such as argon (Ar) or nitrogen are generally used as flow gases to remove byproducts such as spatters and fumes generated in the interaction region of the laser and metal powders, which degrades the quality of the fabricated products (Wen et al. Citation2018; Wen et al. Citation2019; Liu et al. Citation2022). Herein, we focused on the quality control of metallic products by actively utilising this gas, which is an unavoidable part of this process, as a functional element in PBF-LB. For example, it has been reported that helium, which has a low density and high thermal conductivity, can improve mechanical properties (Amano et al. Citation2021), melt pool depth (Bidare et al. Citation2018) and build speed (Pauzon et al. Citation2020), and suppress byproducts (Amano et al. Citation2021). Factors that affect the quality and properties of fabricated products include the physical properties and flow direction of the gas. Since the gas outlet is on the other side of the fabrication table from the inlet, the gas flow in the PBF-LB apparatus is generally unidirectional. In contrast, various laser scanning strategies have been proposed and implemented depending on the objectives, such as reducing residual stress (Ali, Ghadbeigi, and Mumtaz Citation2018; Zhang et al. Citation2023), improving shape accuracy (Zhang, Zhang, and Zhu Citation2021), and obtaining optimal microstructures (Marattukalam et al. Citation2020).
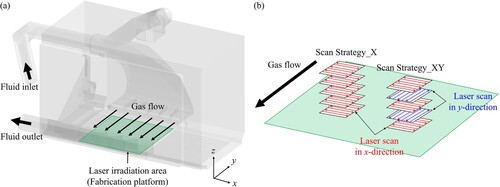
As typical and simple scanning strategies, Scan Strategy_X (or _Y) where the laser is bidirectionally scanned only in the x- (or y-) direction ((b)), Scan Strategy_XY where the laser scan direction is rotated by 90° between layers ((b)), and Scan Strategy_Rot where the laser scan direction is rotated by 67° between layers, are frequently used. Under Scan Strategy_X (or _Y), the laser scanning and gas flow directions are always perpendicular (or parallel) to each other. Under Scan Strategy_XY, the directional relationship between the laser scan and gas flow is repeatedly orthogonal and parallel for each layer. We hypothesised that this change in the gas flow direction in relation to the scanning direction, which depends on the scanning strategy, may have unknown effects on the microstructure of the product, even when using the same gas species. However, Scan Strategy_Rot was not used because, in Scan Strategy_Rot, the direction of gas flow in relation to the scanning direction changes every layer, which complicates the analysis of the effects of the gas flow direction on the texture.
Figure 1. (a) Schematic of gas flow paths in the equipment and (b) schematic showing the direction of gas flow in relation to the laser scanning directions for Scan Strategy_X and Scan Strategy_XY.
The crystallographic texture of metallic materials is an important factor that governs their mechanical properties. Materials with preferential crystal orientation can impart mechanical anisotropy to properties such as Young’s modulus (Lee et al. Citation2012; Cloots et al. Citation2016), yield stress and elongation (Marattukalam et al. Citation2020; Gokcekaya et al. Citation2021; Galindo-Fernández et al. Citation2018), fatigue resistance (Gabb, Gayda, and Miner Citation1986), and creep resistance (Wang et al. Citation2020). Thus, if the above-mentioned hypothesis is valid and the crystallographic texture changes, the mechanical properties of the PBF-LB product change unintentionally. In other words, it is possible to expand the control range of the microstructure and mechanical properties of metallic products by utilising the gas flow direction in relation to the laser scanning direction.
In this study, we aim to clarify the effect of gas flow on the crystallographic texture of a fabricated product. To elucidate the effect of gas flow on the crystallographic texture, we fabricated specimens using two scanning strategies, Scan Strategy_X and Scan Strategy_XY, by varying the powder bed thickness and comparing the crystallographic textures. In this study, 316L stainless steel (316L SS) was used because specific distinguishable texture formations have been reported for Scan Strategy_X and Scan Strategy_XY. Scan Strategy_XY results in a single crystalline-like texture with <100> orientation in the build and two scanning directions, while Scan Strategy_X forms a crystallographic lamellar texture, wherein two types of grains with <011> and <100> orientations along the build direction are alternately stacked (Sun et al. Citation2019). Numerical simulations were performed to analyse the mechanism underlying changes in texture.
2. Experimental procedures
2.1. PBF-LB fabrication with varied powder bed thickness and scan strategy
Gas-atomized 316L SS powder was obtained from EOS GmbH (Germany). The nominal composition was 18Cr-14Ni-2.5Mo-0.03C (wt.%), and the powder size was less than 53 μm. Products of dimensions 10 mm (depth) × 10 mm (length) × 10 mm (height) were manufactured using a PBF-LB apparatus (M 290, EOS, Germany). During fabrication, the differential pressure turbine control was set to 56 Pa (Hanemann et al. Citation2020) and Ar gas flowed on the fabrication platform. The resulting Ar gas flow velocity was measured, as described below. The build direction was defined as the z-direction, and the directions parallel and perpendicular to the Ar gas flow in the fabrication stage were defined as the y- and x-directions, respectively. The scan process parameters, that is, the laser power, scanning speed, and hatch distance, were set to 250 W, 800 mm/s, and 80 μm, respectively. The powder bed thickness varied across 20, 30, 40, 50, 60, and 80 µm. Preliminary tests confirmed that the type of crystallographic texture formed under Scan Strategy_X (or _Y) changes little in this powder bed thickness range, which is an essential condition setting for this study to investigate the effects of the gas flow direction in relation to the laser scanning direction. Two types of laser scan strategies, Scan Strategy_X and Scan Strategy_XY were used. The relationship between the laser scanning directions in Scan Strategies_X and _XY and the gas flow direction is illustrated in . Two specimens were prepared for each condition.
2.2. Measurement of gas flow velocity
Gas flow velocity is a crucial factor that influences product quality (Liu et al. Citation2022); therefore, it should be kept as uniform as possible. In the present study, fabrication was carried out within the area on the fabrication table where the direction and velocity of gas flow can be considered uniform, as determined in a previous study (Amano et al. Citation2021).
The numerical calculation described in Section 2.4 requires the velocity of the Ar gas flow. Therefore, the gas flow velocity was measured using a vane-type (φ16 mm) anemometer (testo 440 dP, Testo, Germany) at the centre of the fabrication platform under the same conditions as those used in the actual fabrication described in Section 2.1. The measurement was continued for 1 min at intervals of 1 s (Amano et al. Citation2021) and then averaged. Schematics of gas flow velocity measurement and variation in velocity with time are provided in Supplementary Figure S1. The averaged gas flow velocity obtained was 1.7 m/s (1.6–1.8 m/s), which agrees well with the reported range in PBF-LB (Liu et al. Citation2022). A gas flow velocity of 1.7 m/s was used in the simulation.
2.3. Characterisation of the specimens
The density of the specimens was measured using the Archimedes method (LA310S, 147 Sartorius, Germany), and the relative density was calculated based on the absolute density of 316L SS, i.e. 7.98 g/cm3. The cross-section of the specimen was mechanically polished using emery papers up to #4000 and mirror-polished with colloidal silica. Crystallographic texture analysis was conducted using an electron backscatter diffraction (EBSD) system (NordlysMax3, Oxford Instruments, UK) mounted on a field-emission scanning electron microscope (FE-SEM; JIB–4610F, JEOL, Japan). The specimens were etched in a solution consisting of 21% HF, 29% HNO3, and 50% H2O at room temperature for 20 min to observe melt-pool traces. Melt-pool traces were investigated using optical microscopy (OM; BX60, Olympus, Japan).
To quantitatively analyse the intensity of the crystallographic texture evolution, the degree of crystal orientation, P<uvw>, was calculated based on the Euler angle obtained by EBSD analysis. The maximum value of P<uvw> is 1, and the closer it is to 1, the stronger is the crystal orientation of <uvw> along the observation direction. If the specimen is polycrystalline and exhibits a completely random texture, the values of P<100> and P<110> are 0.7008 and 0.8354, respectively, based on crystallographic symmetry (Ishimoto et al. Citation2021).
Quantitative results were expressed as mean ± standard deviation (SD). Statistical significance was assessed using Student’s t-test. Statistical significance was set at P < 0.05.
2.4. Numerical analyses
Two types of simulations were performed in a pseudo-tandem manner to analyse the effect of gas flow on heat removal from the melt pool surface to the gas phase during laser irradiation. The gas phase consists of Ar gas flowing in the chamber and metal vapour evaporated by laser irradiation. The flux of metal vapour depends on the surface temperature of the melt pool. Therefore, a temperature simulation was performed to calculate the melt pool temperature and metal vapour flux, and a fluid flow simulation was performed to analyse the flow behaviour of the generated metal vapour under Ar gas flow.
For temperature simulation, a 3D transient melt pool model was developed using the commercial software COMSOL Multiphysics® 5.5 (COMSOL) (Takase et al. Citation2021). The dimensions of the finite element model were 10 mm (width) × 10 mm (depth) × 5 mm (height). In the simulation, the laser scanned the entire 10 × 10 mm x-y plane to calculate the temperature distribution inside the model. The scanning conditions described in Section 2.1 were used in the simulation. Assuming that the heat flux from the laser beam satisfies the Gaussian distribution (Knapp et al. Citation2019; Willy et al. Citation2018; Liu et al. Citation2018), the three-dimensional energy distribution can be expressed as a function of radius r and depth z:
(1)
(1) where α is the heat absorptivity of the laser beam on the metal powder bed, P is the laser power, R is the radius of the beam (set to 50 µm) (Chen et al. Citation2019; EOS M 290 – industrial 3D printed parts from metal materials Citation2022), and z0 is the penetration depth of the laser. This calculation does not include modelling of the powder bed; however, to consider the high heat absorptivity of the powder bed, α was set to 85% (Willy et al. Citation2018). z0 was adjusted based on the melt-pool dimensions (Pham et al. Citation2020; Foroozmehr et al. Citation2016). The temporal and spatial heat transfers are governed by the following equation (Carslaw and Jaeger Citation1986; Li and Gu Citation2014):
(2)
(2) where ρ is the material density, C is the specific heat capacity, T is the temperature, t is the time, q is the heat flux, and Q is the amount of heat generated per unit volume. Latent heat was considered by incorporating it into the temperature dependence of the specific heat capacity (Wolff et al. Citation2017; Pashkis Citation1945). The heat flux due to heat conduction is represented by the following equation according to Fourier's law:
(3)
(3) where k is the thermal conductivity. The boundary conditions on the outer surface of the model were set using the following equation:
(4)
(4) where n is the normal vector of the surface through which the heat flows, h is the heat transfer coefficient, and Text is the external temperature, set to 353 K. The calculation conditions listed in were used in this simulation.
A gas fluid flow simulation was performed using STAR-CCM+® 15.02.009 R8 software (SIEMENS, Germany). For the fluid flow simulation, a space of 30 mm × 30 mm × 160 mm was modelled, as shown in (a). The steady-state analysis was solved in the turbulence model of SST k–ω (Matthews et al. Citation2016) which accurately calculates near the wall and can predict the flow behaviour away from the wall (Menter Citation1994; Menter, Kuntz, and Langtry Citation2003). The following continuity equation, Navier-Stokes equation, and energy equation were used for the calculation:
(5)
(5)
(6)
(6)
(7)
(7) where ρ is the fluid density, u is the flow velocity,
is the Kronecker product, fb is the force per unit volume, σ is the stress tensor, H is the total enthalpy,
is the heat flux vector, and SE is the energy source. The metal vapour was assumed to be generated from the liquid metal (i.e. melt pool) surface, where the temperature was above the liquidus temperature of 316L SS (1715K) (Pham et al. Citation2020). The temperature distribution on the surface during laser irradiation was derived from the simulation of the aforementioned temperature (). The evaporation rate of metal vapour was calculated using the following equation:
(8)
(8)
(9)
(9) where J, D, MN, Csat, and Cvap are the evaporation rate, diffusion coefficient, molar mass, saturated molar concentration, and vapour molar concentration of the cells adjacent to the wall, respectively; dis, Psat, and R are the distance, saturated vapour pressure, and gas constant, respectively. The fluid gas velocity was set to 1.7 m/s as previously mentioned. The temperature of the gas was set to 300 K. For the physical properties of the metal vapours, the physical properties of iron (Fe) (Cressault et al. Citation2013), which is the main component of 316L SS, were used because of the absence of the physical properties of 316L SS vapour. lists the physical properties of the Ar and Fe vapours used. The density, specific heat at constant pressure, and viscosity of Ar and Fe vapours are temperature-dependent (Cressault et al. Citation2013). The calculation model is shown in . The following equation was used for the vapour pressure of Fe (Beutl, Pottlacher, and Jager Citation1994):
(10)
(10) To analyse the effects of the gas flow direction with respect to the laser scan direction, gas flow simulations were performed for two cases in which the directional relationship between the gas flow and laser scanning direction was perpendicular ((b)) and parallel ((c)).
Figure 2. Calculation model for fluid flow simulation. (a) Definition of model dimensions, coordinate axes, and gas flow direction. The bottom of the model is the upper surface of the fabricating object. Laser irradiation raises the surface temperature of the object (see ), causing evaporation and heating of the gas phase by heat transfer. The laser was scanned in (b) the x- and (c) y-directions on the bottom side of the model (object surface).
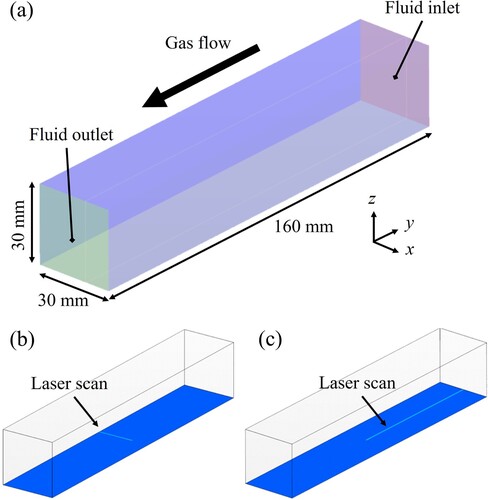
Figure 3. Temperature distribution on the fabricating object surface during laser irradiation calculated by a finite element temperature simulation.
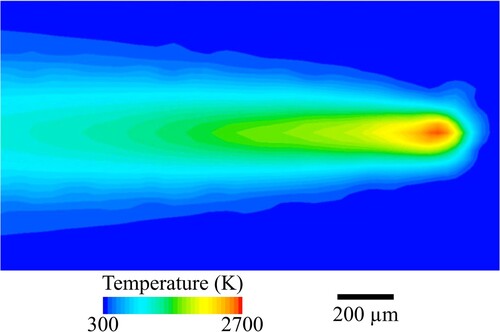
Table 1. Materials parameters of 316L SS used in the temperature simulation (Pham et al. Citation2020).
Table 2. Physical properties of Ar gas and Fe vapour used in the fluid flow simulation.
3. Results
3.1. Variation in crystallographic texture as a function of powder bed thickness and scan strategy
lists the relative densities of the specimens fabricated with various powder bed thicknesses and scan strategies. The relative density was greater than 99.9% under all conditions.
Table 3. Relative density of the specimens fabricated under Scan Strategy_X and Scan Strategy_XY with varied powder bed thicknesses of 20, 30, 40, 50, 60 and 80 µm.
shows the IPF maps taken in the y-z plane and the corresponding {001} pole figures of the samples fabricated using Scan Strategy_X and Scan Strategy_XY for each powder bed thickness. The characteristics of each texture were quantified based on the degree of orientation of <100> (P<100>) and <110> (P<110>) along the build (z-) direction, as shown in . In Scan Strategy_X ( (a)), a lamellar-type crystallographic texture with a predominant orientation, wherein <011> and <100> are preferentially oriented in the z- and x-directions, respectively (herein, this texture is referred to as {011}z <100>x). This lamellar-type texture contains thinner grains with a <100>//z orientation, which is consistent with the crystallographic lamellar microstructure (CLM) texture reported in (Sun et al. Citation2019). Scan Strategy_Y formed the same crystallographic texture as Scan Strategy_X, as shown in Supplementary Figure S2.
Figure 4. Crystallographic texture variations in the specimens. Variations in IPF maps and the corresponding {001} pole figures of the specimens fabricated under (a) Scan Strategy_X and (b) Scan Strategy_XY as a function of powder bed thickness (20, 30, 40, 50, 60 and 80 µm). Observation was performed on the y-z plane.
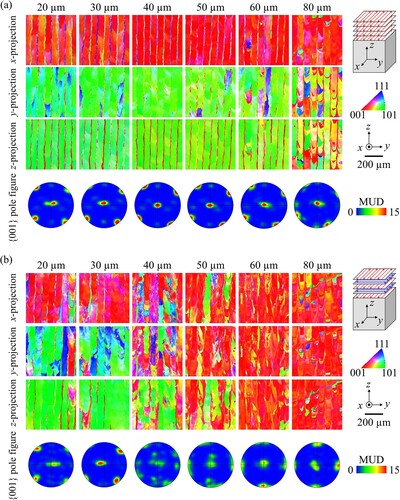
Figure 5. Variation in the degree of orientation of (a) P<100> and (b) P<110> along the build (z)-direction. The dashed lines indicate random orientation for each crystallographic direction. *: P < 0.05.
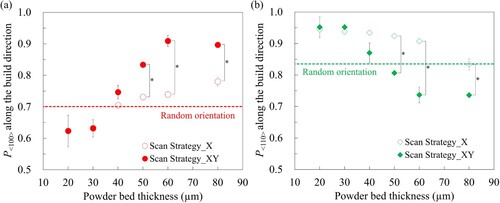
However, for Scan Strategy_XY ( (b)), the crystallographic texture varied as a function of the powder bed thickness. A CLM-like texture was formed under fabrication with a thinner powder bed of 20–30 µm. For the quantitatively calculated orientations (), the differences in P<100> and P<110> disappeared between Scan Strategy_X and _XY with a thinner powder bed. A powder bed with a thickness greater than 60 µm resulted in {001}z <100>x texture evolution. Previous reports have shown that the {001}z <100>x texture is ‘common’ under the fabrication with Scan Strategy_XY (Ishimoto et al. Citation2017), however, it only formed when the powder bed was thick in this study. In contrast, the {011}z <100>x texture unique to Scan Strategy_X was formed under Scan Strategy_XY when the powder bed was thin.
3.2. Size and shape of the melt pool and their effects on texture evolution
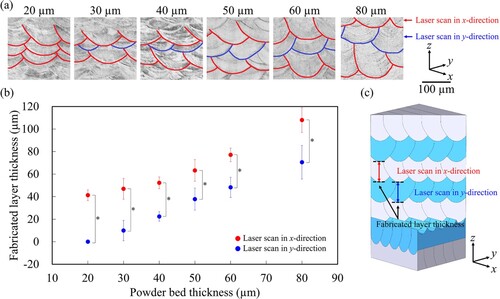
When the powder bed was thin, the texture characteristics that are normally seen in Scan Strategy_X were observed in Scan Strategy_XY. This suggests that the actual melting behaviour may have been similar to that occurring under Scan Strategy_X, even though the laser was scanned in Scan Strategy_XY. After etching the cross-section of the specimens fabricated using Scan Strategy_XY, we observed the melt pool shape in the cross-section (). To uniformly observe the melt pools generated by the laser scan along the x- and y-directions, a cross-section parallel to the z-direction at 45° with respect to the x- and y-directions was prepared ((c)). (a) shows the stacking of the melt pools in the cross-section. Because the direction (x- or y-direction) of the last laser scan (topmost layer of the specimen) was preset for each specimen, we determined the scan direction of a certain layer by counting the number of layers from the topmost layer of the specimen. When the powder bed thickness was large, melt pool traces generated by the laser scan in both the x- and y-directions were observed. However, with a small powder bed thickness of less than 30 µm, the melt pool trace by the laser scan in the y-direction (indicated by the blue line) is almost diminished. In other words, most of the melt pool traces that can be observed were formed by laser scanning in the x-direction (indicated by the red line) ((a)). The change in thickness of the melt pool trace (fabricated layer thickness) formed by laser scanning in the x- and y-directions is shown in (b). The thickness of the fabricated layer is shown in (c). The layer thickness was always larger for the layer fabricated by laser scanning in the x-direction. The sum of the layer thicknesses generated by laser scanning in the x- and y-directions closely corresponded to twice the powder bed thickness, and the difference between them was approximately 30–40 µm ((b)). In cases where the powder bed thickness was 20 or 30 µm, the layer formed by the laser scan in the y-direction was mostly lost because it was overwritten by the laser scan in the x-direction immediately afterwards. Thus, when the powder bed thickness is sufficiently small, only the effect of the laser scan in the x-direction remains in the specimen, even though the laser was scanned in the x- and y-directions alternately between layers under the Scan Strategy_XY.
Figure 6. (a) OM images of the cross-section of the specimens with red and blue lines representing melt pool traces generated by laser scan in x- and y-directions, respectively. (b) Variation of the fabricated layer thickness generated by laser scan in x- and y-directions. (c) Schematics of the observation plane and definition of fabricated layer thickness. *: P < 0.05.
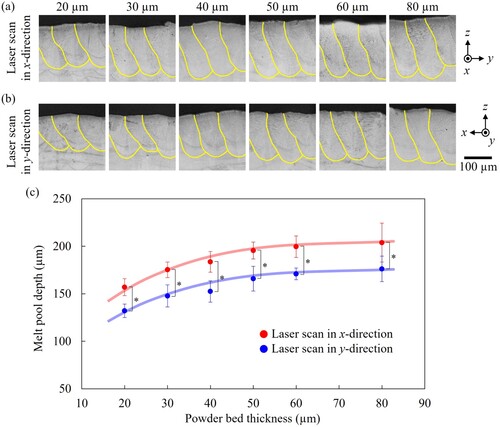
(a) and (b) show the OM images of the topmost part of the specimens, wherein the entire melt pool cross-section can be observed. To observe the melt pool shape generated by the laser scan in the x-direction, a yz-cross-section of the specimen with the last topmost layer melted by the laser scan in the x-direction was used, and vice versa. The depth of the melt pools generated by the laser scan in the x-direction was significantly larger by approximately 30–40 µm than that in the y-direction ((c)), which is in good agreement with the differences shown in (b).
Figure 7. OM images of the topmost part in the cross-section of the specimens for observation of melt pool shape generated by laser scan in (a) x-direction and (b) y-direction. Yellow lines indicate melt pool traces. (c) Variation in the depth of melt pools generated by laser scan. *: P < 0.05.
3.3. Effect of gas flow and scan strategy on fluid simulation
Despite using identical laser parameters, the melt pool depth differed depending on the laser scan direction, that is parallel or perpendicular to the Ar flow direction. This asymmetry can be attributed to the direction of the gas flow. To determine the reason for the decrease in depth of the melt pool when the laser was scanned in the y-direction (parallel to the gas flow), we simulated the difference in the behaviour of the gas fluid on the melt pool during laser scanning in the x- and y-directions. Metal vapour was generated from the molten metal. (a1) and (b1) show the temperature distribution at the build surface for the laser scan in the x- and y-directions, respectively, with respect to the direction of the Ar flow. (a2) and (b2) show the isosurfaces of the Fe vapour (concentration of 100 ppm) generated based on the temperature distribution at the surface shown in (a1, b1). The Fe vapour was blown vertically (in the z-direction) from the region above the melting point of the metal (dotted line). The generated Fe vapour flowed downstream by the Ar flow, and a part of the vapour was distributed just above the surface of the build. The Ar gas flow determined the distribution of Fe vapour, and the distribution of Fe vapour between the laser scan directions was remarkably different. From the shape of the Fe vapour isosurface, we found that the Fe vapour distribution under the laser scan was more spread out in the y-direction than in the x-direction, and the Fe vapour was distributed along the path of the laser under the laser scan in the y-direction. (a3) and (b3) show the mass fraction of Fe vapour in the A-A’ cross-section along the laser path. (a4, b4) and 8(a5, b5) show the distributions of temperature and thermal conductivity, respectively, at the same cross-section, as (a3) and (b3). The temperature and thermal conductivity were high immediately above and behind the melt pool, respectively. The region with high temperature and high thermal conductivity distributed vertically upward at the melt pool tip is consistent with the distribution of the Fe vapour. However, the Fe vapour concentration, which is just above the melt pool tail is not high, but the temperature and thermal conductivity are high because of the heat transfer from the top surface of the object heated by the laser scan. In particular, a higher temperature and thermal conductivity distribution was observed when the laser was scanned in the y-direction (parallel to the gas flow) ((b4)). This is because the gas heated over the melt pool tail moved along the melt pool and was heated further. In this temperature range, the temperature and thermal conductivity showed a positive relationship in Ar (Cressault et al. Citation2013).
Figure 8. (a1, b1, c1) Temperature distribution on the upper surface of the fabricating object. The Fe vapour was generated from the region above the melting point of the metal (within dotted line). (a2, b2, c2) Isosurface of Fe vapour (concentration of 100 ppm). Arrow head indicates laser irradiating point. Distribution of (a3, b3, c3) Fe vapour concentration, (a4, b4, c4) temperature, and (a5, b5, c5) thermal conductivity on A-A’ cross-section drawn in (a1, b1, c1). (a6, b6, c6) Enlarged view of (a5, b5, c5) around the melt pool tip at which the laser is irradiated.
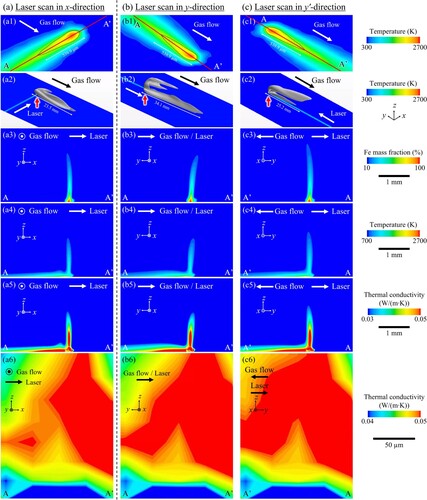
Even when the laser was scanned in the opposite direction of gas flow (referred to as y'-direction), the flow behaviour of the heated Ar gas and Fe vapour was similar to that of laser scanning in the y-direction ((c)). This is because the gas flow velocity (1700 mm/s) is higher than the laser scanning speed (800 mm/s). As a result, the thermal conductivity of the gas phase just above the melt pool was calculated to be almost the same for laser scanning in the y- and y'-directions, and higher for both than for laser scanning in the x-direction as shown in Supplementary Fig. S3.
The high thermal conductivity of the gas phase represented in the case where the laser is scanned in the y-direction may contribute to shallow melt pool generated by the laser scan in the y-direction.
4. Discussion
4.1. Ar gas flow velocity and its uniformity
To estimate the isolated effects of gas flow direction on the crystallographic texture of the products, attention was paid to the location- and time-dependent uniformity of the Ar gas flow. Gas flow velocity is a crucial factor influencing product quality; therefore, it should be maintained as uniformly as possible. According to literature, the appropriate gas flow velocity range for 316L SS is 1.3–2.0 m/s (Liu et al. Citation2022). In the present study, fabrication was carried out within the area on the fabrication table where the direction and velocity of gas flow can be considered uniform, as determined in a previous study (Amano et al. Citation2021). Moreover, the gas flow velocity measured at the centre of the aforementioned area was stable with time (1 min which is long enough to complete laser irradiation in one layer); 1.6–1.8 m/s which locates in the middle of the appropriate range. Thus, there were few location- and time-dependent variations in gas flow velocity during fabrication.
4.2. Variation in crystallographic texture depending on the scan strategy and powder bed thickness
In this study, we clarified the significant dependence of the melting and solidification behaviours of metals under laser scanning on the relationship between the directions of Ar gas flow and laser scan through the change in the crystallographic texture, which is specific depending on the laser scan strategy in PBF-LB. The melt pool depth differed based on the relationship between the directions of the laser scan and gas flow (parallel and perpendicular were compared as extreme cases in this study); furthermore, the melt pool became shallower when the directions of the laser scan and gas flow were parallel to each other. Consequently, the crystallographic texture became similar to that fabricated with Scan Strategy_X when the powder bed thickness was small, although it was fabricated with Scan Strategy_XY.
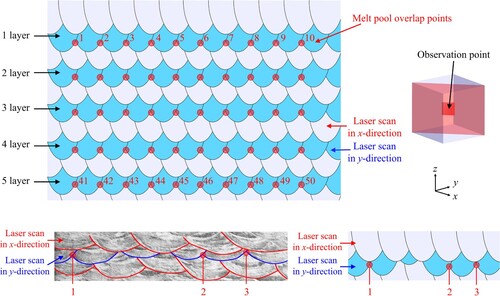
To understand the reason for this phenomenon, the microstructures of the specimens fabricated using Scan Strategy_XY with small (20 µm) and large (60 μm) powder bed thicknesses were analysed using FE-SEM and EBSD. The SEM micrographs and IPF maps of these specimens were recorded within the same region on the y-z cross-section (). A cellular microstructure was observed throughout the cross-section ((a, b)). A comparison between the SEM images ((a, b)) and IPF maps ((c, d)), shows that the cell elongation direction (red arrows) almost agrees with the crystallographic <100> direction. For the specimen with a 20-μm thick powder layer, the <100>-oriented cells angled ±45° with respect to the build (z-) direction grew from the sidewalls of the melt pool, and the cells developed from the bottom of the melt pool, resulting in a lamellar-like structure, wherein two types of layers with different orientations were alternately stacked. A comparable microstructure has been reported for products fabricated using Scan Strategy_X (Gokcekaya et al. Citation2021; Ishimoto et al. Citation2020), even though the specimen in (a, c) was fabricated using Scan Strategy_XY. In contrast, for the specimen with a 60 μm-thick powder layer, vertically and horizontally elongated cells developed, which is the microstructure commonly reported under Scan Strategy_XY. In this case, the horizontal cell growth (right-headed red arrows in (b)) from the side of the melt pool is based on the crystallographic epitaxy from the neighbouring and pre-solidified melt pool. The overlap of neighbouring melt pools is considered important for enabling epitaxial growth to develop a single crystalline-like {001}z <100>x texture, which is the characteristic of Scan Strategy_XY. Therefore, the melt pool continuity was calculated using the cross-section described in (a). As shown in , we analysed 50 melt pool boundaries in the layer created by the laser scan in the y-direction and calculated the proportion of the overlapped points.
Figure 9. (a, b) FE-SEM images and (c, d) IPF maps along the z-direction of the y-z cross-sections of the specimens fabricated in the Scan Strategy_XY. The solid line shows the melt pool traces. The powder bed thickness was (a, c) 20 µm and (b, d) 60 µm. Red arrows indicate the direction of cell elongation and * indicates compartment formed by laser scan in the y-direction.
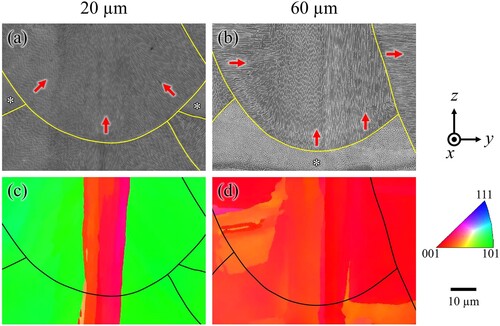
Figure 10. Calculation of melt pool continuity. The melt pools generated by laser scan in the y-direction are indicated with light blue colour. Red points between the melt pools represent overlapped points.
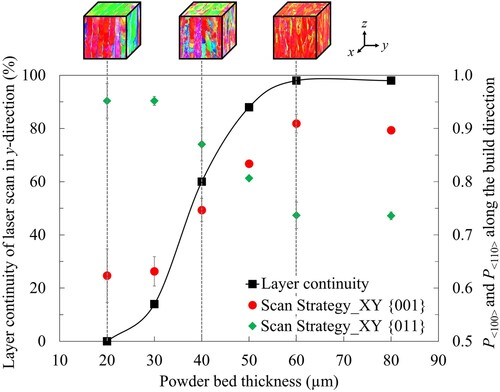
shows the melt pool continuity accompanying the degree of crystal orientations P<100> and P<110> along the build direction for the specimens fabricated with Scan Strategy_XY. When the powder bed was thick (60 and 80 µm), the melt pool continuity was approximately 100%. The melt pool continuity dropped drastically as the powder bed thickness decreased and finally reached 0% for a powder bed thickness of 20 µm. This change in melt pool continuity corresponds well with the transition in the crystallographic texture. Thus, it is understood that the crystallographic texture developed is highly dependent on the continuity of the melt pool and that this melt pool continuity is greatly affected by the depth of the melt pool, which depends on the combination of the directions of the gas flow and laser scan when a product is fabricated using multiple laser scanning directions.
Figure 11. Variation in the melt pool continuity as well as P<100> and P<110> along the build direction as a function of powder bed thickness analysed for the specimens fabricated with the Scan Strategy_XY.
4.3. Effect of relative gas flow direction on the thermal properties of gas phase
The thermal conductivity of the gas phase, which directly affects the cooling of the build surface, was higher for the laser scan in the y-direction than that in the x-direction behind the melt pool ((a5, b5)). Behind the melt pool, the thermal conductivity changed in the laser scan direction despite the absence of Fe vapour distribution. This was attributed to the Ar gas behind the melt pool. The thermal conductivity of Ar gas increases with increasing temperature (Cressault et al. Citation2013). As shown by the temperature distributions in (a4) and (b4), the temperature behind the melt pool was higher for the laser scan in the y-direction than that in the x-direction. Therefore, the thermal conductivity increased owing to the presence of Ar gas at high temperatures on the build surface. This difference in thermal conductivity may lead to an increase in the heat dissipation from the build surface for the laser scan in the y-direction and a decrease in the melt pool depth generated by the laser scan in the y-direction. Bidare et al. (Bidare et al. Citation2018) reported that in the PBF-LB process, as the pressure of the gas phase is increased, the melt pool depth becomes shallower in a pressure-dependent manner. The effect of an increase in thermal conductivity owing to an increase in the pressure of the gas phase has been suggested (Bidare et al. Citation2018). The rate of temperature change via heat transfer in molten salt droplets placed in various gases is higher when the surrounding gas has a higher thermal conductivity (Ghandehariun et al. Citation2017). Thus, depending on the thermal conductivity of the gas phase, the heat transfer from the melt to the gas phase changes, affecting the temperature change of the melt and possibly the melt pool size. The extent to which the difference in thermal conductivity of the gas phase estimated in the simulation in this study affects the melt pool depth remains to be clarified; however, the difference in thermal conductivity of the gas phase itself has the potential to affect heat dissipation and melt pool depth.
In contrast, during laser irradiation, spatters and fumes are generated, and their presence in the path of laser irradiation physically attenuates the laser energy input to the fabricated product (Wen et al. Citation2018; Wen et al. Citation2019; Liu et al. Citation2022). In addition, metal vapour plumes have been reported to attenuate lasers (Shcheglov et al. Citation2011; Zou et al. Citation2016). The distribution of such byproducts as shields for the laser, depending on the gas flow direction, can cause differences in laser attenuation. Physical attenuation of the laser implies a reduction in the laser power reaching the powder bed and should be a direct cause of the reduction in the melt pool depth. The reduction in irradiated laser power suppresses Marangoni convection by reducing the dynamic viscosity and surface tension of the molten metal (Wang et al. Citation2016; Reijonen et al. Citation2020), leading to a decrease in melt pool depth (Wang et al. Citation2016).
Although the physical attenuation of laser energy is the definitive factor affecting the melt pool depth, our simulation results proposed that the fluid gas may also be a factor.
4.4. Limitations
This study has limitations related to the incompleteness of the numerical simulations, the limited scanning strategy examined, and the lack of product performance analysis.
First, numerical simulations do not reflect some aspects of the real situation, although establishing simulation models and high-performance solvers to perform the coupled calculations are needed to implement this (Bouabbou and Vaudreuil Citation2022). In this study, single-track calculations were performed and the effect of overlap and heat accumulation due to round-trip scanning (Huang et al. Citation2021) cannot be discussed. Furthermore, although this study calculated the injection of Fe vapour into the gas phase, it focused on gas flow-based migration of Fe vapour after injection into the gas phase and does not address the effect of how it is ejected from the melts (Zheng et al. Citation2018; Zheng et al. Citation2021). It also needs to be clarified how the different thermal conductivities of the gas phases can remove heat from the melt pool and cause the melt pool to shrink. This will allow us to determine which has a greater relative effect on the melt pool depth, the attenuation effect of the laser energy due to the fume and spattering, or the thermal conductivity of the gas phase, and thus the magnitude of the effect on crystallographic texture. Future work is needed to advance the sophistication of the simulations and to deepen the knowledge based on the findings of this study.
Second, this study used substantially only two types of scan strategies. The objective of this study was to investigate the effect of gas flow direction in relation to the laser scan direction on crystallographic textures formed in the products. For this purpose, satisfying the two situations (1) characteristic and distinctive crystallographic textures, and (2) simple relative relationship between gas flow and laser scanning directions, were considered to be effective. Scan Strategy_X and _XY were best suited for these situations. In fact, it was easy to capture changes in texture, as seen in (b) and . However, various scan strategies have been proposed and implemented thus far, such as strategies involving laser rotation, island laser scan, and spiral laser scan (Kim and Hart Citation2022; Jia et al. Citation2021), and it is necessary to expand the scope of this study to these strategies in the future.
Finally, mechanical properties should be evaluated in the future to establish process-(micro)structure-performance relationship in terms of gas flow direction.
4.5. Prospects in powder bed thickness
Recent studies have attempted to improve the quality of the fabricated product using the powder bed thickness as a parameter to increase the density, dimensional accuracy, mechanical properties (Nguyen et al. Citation2018; De Souza et al. Citation2019), build speed (Schleifenbaum et al. Citation2011), and oxygen removal rate of the molten metal (Dadbakhsh and Hao Citation2014). However, this attempt did not consider the effect of the gas flow. According to the findings obtained in this study, the gas flow direction in relation to the laser scanning direction leads to unintended effects on the crystallographic texture.
The effective utilisation of this phenomenon makes it possible to control the crystallographic texture and the related mechanical and chemical properties of the fabricated products by changing the powder bed thickness. Although it has been shown that the crystallographic texture can be controlled by parameters such as the scan strategy, laser power, and scan speed (Ishimoto et al. Citation2017; Ishimoto et al. Citation2021; Hagihara and Nakano Citation2022), it has also been clarified that the powder bed thickness can be applied as a new control factor for the crystallographic texture. In other words, it expands the control range of the texture of PBF-LB products. Ultimately, a deeper understanding of the relationship between the effect of the PBF-LB atmosphere gas (species, direction, resulting thermal conductivity, and resulting melt pool shape) and the powder bed thickness is a challenge to further expand the variation of the controllable crystallographic texture. The accumulation of various data during fabrication and the use of machine learning (Sing et al. Citation2021) will enable the selection of better scanning strategies to obtain the desired product quality, including crystallographic texture.
5. Conclusions
This study examined the effect of gas flow in PBF-LB on the crystallographic texture evolution by comparing the products fabricated under Scan Strategy_X and _XY with varying powder bed thicknesses. The conclusions are as follows:
Scan Strategy_X forms a crystallographic lamellar microstructure that is almost independent of the powder bed thickness. In contrast, Scan Strategy_XY developed various textures depending on the powder bed thickness. Notably, Scan Strategy_XY, with a smaller powder bed thickness, resulted in a crystallographic lamellar microstructure, which is the characteristic texture for Scan Strategy_X.
The melt-pool depth generated by the laser scan in the y-direction was significantly smaller than that generated by the laser scan in the x-direction.
Numerical simulations indicated that the thermal conductivity of the gas phase just over the melt pool differed depending on the gas flow direction (parallel or perpendicular) relative to the laser scanning direction. When the gas flow was parallel to the laser scanning direction, the distribution of the metal vapour generated from the melt pool and the efficient heating of Ar gas from the hot melt pool increased the thermal conductivity of the gas phase, resulting in efficient heat removal from the melt pool. This is one reason for the shallow melt pool generated by the laser scan in the y-direction, which resulted in a varied crystallographic texture in the products fabricated under Scan Strategy_XY depending on the powder bed thickness.
This study elucidated that the combination of powder bed thickness and gas flow direction in relation to the laser scanning direction can be a new parameter to control the texture evolution behaviour in PBF-LB, which widens the scope of texture control, enabling further improvement of material properties.
Supplemental Material
Download PDF (926.9 KB)Disclosure statement
No potential conflict of interest was reported by the author(s).
Data availability statement
Data will be available upon reasonable request.
Additional information
Funding
Notes on contributors
Hiroki Amano
Hiroki Amano Ph.D. received the Ph.D. degree from Osaka University in 2022, specialised in effects of flow gas in metal Additive Manufacturing. He is working on new business development for Additive Manufacturing in TAIYO NIPPON SANSO Corporation.
Takuya Ishimoto
Takuya Ishimoto Ph.D. is a Professor of the Aluminium Research Center, University of Toyama, Japan and also a member of the Anisotropic Design & Additive Manufacturing Research Center, Osaka University, Japan. He has been engaged in the study of materials property control of alloys using powder bed fusions.
Koji Hagihara
Koji Hagihara Ph.D. is a Professor of the Department of Physical Science and Engineering, Nagoya Institute of Technology, Japan and also a member of the Anisotropic Design & Additive Manufacturing Research Center, Osaka University, Japan. He has been engaged in the study of plastic deformation of metallic alloys including additive manufactured ones.
Ryoya Suganuma
Ryoya Suganuma is a M.S. student of the Division of Materials and Manufacturing Science, Graduate School of Engineering, Osaka University, Japan. He is working on numerical simulations of thermal diffusion and melt pool formation during the powder bed fusion process.
Keisuke Aiba
Keisuke Aiba is an engineer in TAIYO NIPPON SANSO Corporation. He is working on promoting development efficiency and design support thru numerical simulation.
Shi-Hai Sun
Shi-Hai Sun Ph.D. is an Associate Professor of the School of Materials Science and Engineering, Beijing Institute of Technology, People's Republic of China. He has been engaged in optimising the process parameters of the powder bed fusion process to improve the mechanical function of metallic materials.
Pan Wang
Pan Wang Ph.D. is the Leader of the Electron Beam Melting Team, Additive Manufacturing Group, A*STAR's Singapore Institute of Manufacturing Technology, Singapore. He leads the development of the electron beam melting (EBM) process from fundamental research to industrial applications.
Takayoshi Nakano
Takayoshi Nakano Ph.D. is a Distinguished Professor of the Division of Materials and Manufacturing Science, Graduate School of Engineering, Osaka University, Japan. He is the director of the Anisotropic Design & Additive Manufacturing Research Center, Osaka University, Japan, and leads research on crystallographic texture control and functionalisation of metallic materials using powder bed type additive manufacturing. He is now the President of Japan Institute of Metals and Materials (JIMM). He has authored over 500 peer-reviewed papers.
References
- Ali, H., H. Ghadbeigi, and K. Mumtaz. 2018. “Effect of Scanning Strategies on Residual Stress and Mechanical Properties of Selective Laser Melted Ti6Al4V.” Materials Science & Engineering A 712: 175–187. doi:10.1016/j.msea.2017.11.103.
- Amano, H., T. Ishimoto, R. Suganuma, K. Aiba, S.-H. Sun, R. Ozasa, and T. Nakano. 2021a. “Effect of a Helium Gas Atmosphere on the Mechanical Properties of Ti-6Al-4V Alloy Built with Laser Powder Bed Fusion: A Comparative Study with Argon Gas.” Additive Manufacturing 48: 102444. doi:10.1016/j.addma.2021.102444.
- Amano, H., Y. Yamaguchi, T. Ishimoto, and T. Nakano. 2021b. “Reduction of Spatter Generation Using Atmospheric Gas in Laser Powder Bed Fusion of Ti-6Al-4V.” Materials Transactions 62: 1225–1230. doi:10.2320/matertrans.MT-M2021059.
- Beutl, M., G. Pottlacher, and H. Jager. 1994. “Thermophysical Properties of Liquid Iron.” International Journal of Thermophysics 15: 1323–1331. doi:10.1007/BF01458840.
- Bidare, P., I. Bitharas, R. M. Ward, M. M. Attallah, and A. J. Moore. 2018. “Laser Powder Bed Fusion in High-Pressure Atmospheres.” The International Journal of Advanced Manufacturing Technology 99: 543–555. doi:10.1007/s00170-018-2495-7.
- Blakey-Milner, B., P. Gradl, G. Snedden, M. Brooks, J. Pitot, E. Lopez, M. Leary, F. Berto, and A. du Plessis. 2021. “Metal Additive Manufacturing in Aerospace: A Review.” Materials & Design 209: 110008. doi:10.1016/j.matdes.2021.110008.
- Bouabbou, A., and S. Vaudreuil. 2022. “Understanding Laser-Metal Interaction in Selective Laser Melting Additive Manufacturing through Numerical Modelling and Simulation: A Review.” Virtual and Physical Prototyping 17: 543–562. doi:10.1080/17452759.2022.2052488.
- Carslaw, H. S., and J. C. Jaeger. 1986. Conduction of Heat in Solids. second edition. Oxford (UK): Oxford University Press.
- Chen, Q., X. Liang, D. Hayduke, J. Liu, L. Cheng, J. Oskin, R. Whitmore, and A. C. To. 2019. “An Inherent Strain Based Multiscale Modeling Framework for Simulating Part-Scale Residual Deformation for Direct Metal Laser Sintering.” Additive Manufacturing 28: 406–418. doi:10.1016/j.addma.2019.05.021.
- Cloots, M., K. Kunze, P. J. Uggowitzer, and K. Wegener. 2016. “Microstructural Characteristics of the Nickel-Based Alloy IN738LC and the Cobalt-Based Alloy Mar-M509 Produced by Selective Laser Melting.” Materials Science and Engineering: A 658: 68–76. doi:10.1016/j.msea.2016.01.058.
- Cressault, Y., A. B. Murphy, P. Teulet, A. Gleizes, and M. Schnick. 2013. “Thermal Plasma Properties for Ar-Cu, Ar-Fe and Ar-Al Mixtures Used in Welding Plasmas Processes: II Transport Coefficients at Atmospheric Pressure.” Journal of Physics D: Applied Physics 46: 415207. doi:10.1088/0022-3727/46/41/415207.
- Dadbakhsh, S., and L. Hao. 2014. “Effect of Layer Thickness in Selective Laser Melting on Microstructure of Al/5 wt.%Fe2O3 Powder Consolidated Parts.” The Scientific World Journal 2014: 106129. doi:10.1155/2014/106129.
- De Souza, A. F., K. S. Al-Rubaie, S. Marques, B. Zluhan, and E. C. Santos. 2019. “Effect of Laser Speed,: Layer Thickness, and Part Position on the Mechanical Properties of Maraging 300 Parts Manufactured by Selective Laser Melting.” Materials Science and Engineering: A 767: 138425. doi:10.1016/j.msea.2019.138425.
- Ekubaru, Y., O. Gokcekaya, T. Ishimoto, K. Sato, K. Manabe, P. Wang, and T. Nakano. 2022. “Excellent Strength–Ductility Balance of Sc-Zr-Modified Al–Mg Alloy by Tuning Bimodal Microstructure via Hatch Spacing in Laser Powder Bed Fusion.” Materials & Design 221: 110976. doi:10.1016/j.matdes.2022.110976.
- EOS M 290 – industrial 3D printed parts from metal materials. 2022. https://www.eos.info/en/additive-manufacturing/3d-printing-metal/eos-metal-systems/eos-m-290. [accessed 2022 Nov 15].
- Foroozmehr, A., M. Badrossamay, E. Foroozmehr, and S. Golabi. 2016. “Finite Element Simulation of Selective Laser Melting Process Considering Optical Penetration Depth of Laser in Powder Bed.” Materials & Design 89: 255–263. doi:10.1016/j.matdes.2015.10.002.
- Gabb, T. P., J. Gayda, and R. V. Miner. 1986. “Orientation and Temperature Dependence of Some Mechanical Properties of the Single-Crystal Nickel-Base Superalloy René N4: Part II. Low Cycle Fatigue Behavior.” Metallurgical Transactions A 17: 497–505. doi:10.1007/BF02643956.
- Galindo-Fernández, M. A., K. Mumtaz, P. E. J. Rivera-Díaz-del-Castillo, E. I. Galindo-Nava, and H. Ghadbeigi. 2018. “A Microstructure Sensitive Model for Deformation of Ti-6Al-4V Describing Cast-and-Wrought and Additive Manufacturing Morphologies.” Materials & Design 160: 350–362. doi:10.1016/j.matdes.2018.09.028.
- Ghandehariun, S., M. A. Rosen, M. Agelin-Chaab, and G. F. Naterer. 2017. “Heat Transfer from Molten Salt Droplets in Various Gases.” International Journal of Heat and Mass Transfer 105: 140–146. doi:10.1016/j.ijheatmasstransfer.2016.08.108.
- Gokcekaya, O., N. Hayashi, T. Ishimoto, K. Ueda, T. Narushima, and T. Nakano. 2020. “Crystallographic Orientation Control of Pure Chromium via Laser Powder Bed Fusion and Improved High Temperature Oxidation Resistance.” Additive Manufacturing 36: 101624. doi:10.1016/j.addma.2020.101624.
- Gokcekaya, O., T. Ishimoto, S. Hibino, J. Yasutomi, T. Narushima, and T. Nakano. 2021. “Unique Crystallographic Texture Formation in Inconel 718 by Laser Powder Bed Fusion and Its Effect on Mechanical Anisotropy.” Acta Materialia 212: 116876. doi:10.1016/j.actamat.2021.116876.
- Gokcekaya, O., T. Ishimoto, Y. Nishikawa, Y. S. Kim, A. Matsugaki, R. Ozasa, M. Weinmann, et al. 2023. “Novel Single Crystalline-Like Non-Equiatomic TiZrHfNbTaMo Bio-High Entropy Alloy (BioHEA) Developed by Laser Powder Bed Fusion.” Materials Research Letters 11: 274–280. doi:10.1080/21663831.2022.2147406.
- Hagihara, K., and T. Nakano. 2022. “Control of Anisotropic Crystallographic Texture in Powder Bed Fusion Additive Manufacturing of Metals and Ceramics—A Review.” The Journal of The Minerals, Metals & Materials Society 74: 1760–1773. doi:10.1007/s11837-021-04966-7.
- Hanemann, T., C. Seyfert, P. Holfelder, A. Rota, and M. Heilmaier. 2020. “Dimensionless Enthalpy as Characteristic Factor for Process Control in Laser Powder Bed Fusion.” Journal of Laser Micro/Nanoengineering 15: 257–266. doi:10.2961/jlmn.2020.03.2017.
- Huang, S., R. L. Narayan, J. H. K. Tan, S. L. Sing, and W. Y. Yeong. 2021. “Resolving the Porosity-Unmelted Inclusion Dilemma During In-Situ Alloying of Ti34Nb via Laser Powder Bed Fusion.” Acta Materialia 204: 116522. doi:10.1016/j.actamat.2020.116522.
- Ishimoto, T., K. Hagihara, K. Hisamoto, and T. Nakano. 2021. “Stability of Crystallographic Texture in Laser Powder Bed Fusion: Understanding the Competition of Crystal Growth Using a Single Crystalline Seed.” Additive Manufacturing 43: 102004. doi:10.1016/j.addma.2021.102004.
- Ishimoto, T., K. Hagihara, K. Hisamoto, S.-H. Sun, and T. Nakano. 2017. “Crystallographic Texture Control of Beta-Type Ti-15Mo-5Zr-3Al Alloy by Selective Laser Melting for the Development of Novel Implants with a Biocompatible Low Young’s Modulus.” Scripta Materialia 132: 34–38. doi:10.1016/j.scriptamat.2016.12.038.
- Ishimoto, T., S. Wu, Y. Ito, S.-H. Sun, H. Amano, and T. Nakano. 2020. “Crystallographic Orientation Control of 316L Austenitic Stainless Steel via Selective Laser Melting.” ISIJ International 60: 1758–1764. doi:10.2355/isijinternational.ISIJINT-2019-744.
- Jia, H., H. Sun, H. Wang, Y. Wu, and H. Wang. 2021. “Scanning Strategy in Selective Laser Melting (SLM): A Review.” The International Journal of Advanced Manufacturing Technology 113: 2413–2435. doi:10.1007/s00170-021-06810-3.
- Kim, S. I., and A. J. Hart. 2022. “A Spiral Laser Scanning Routine for Powder Bed Fusion Inspired by Natural Predator-Prey Behaviour.” Virtual and Physical Prototyping 17: 239–255. doi:10.1080/17452759.2022.2031232.
- Knapp, G. L., N. Raghavan, A. Plotkowski, and T. DebRoy. 2019. “Experiments and Simulations on Solidification Microstructure for Inconel 718 in Powder Bed Fusion Electron Beam Additive Manufacturing.” Additive Manufacturing 25: 511–521. doi:10.1016/j.addma.2018.12.001.
- Lee, S.-H., M. Todai, M. Tane, K. Hagihara, H. Nakajima, and T. Nakano. 2012. “Biocompatible Low Young’s Modulus Achieved by Strong Crystallographic Elastic Anisotropy in Ti-15Mo-5Zr-3Al Alloy Single Crystal.” Journal of the Mechanical Behavior of Biomedical Materials 14: 48–54. doi:10.1016/j.jmbbm.2012.05.005.
- Li, Y., and D. Gu. 2014. “Parametric Analysis of Thermal Behavior During Selective Laser Melting Additive Manufacturing of Aluminum Alloy Powder.” Materials & Design 63: 856–867. doi:10.1016/j.matdes.2014.07.006.
- Liu, S. Y., H. Q. Li, C. X. Qin, R. Zong, and X. Y. Fang. 2020. “The Effect of Energy Density on Texture and Mechanical Anisotropy in Selective Laser Melted Inconel 718.” Materials & Design 191: 108642. doi:10.1016/j.matdes.2020.108642.
- Liu, Z., Y. Yang, D. Wang, J. Chen, Y. Xiao, H. Zhou, Z. Chen, and C. Song. 2022. “Flow Field Analysis for Multilaser Powder Bed Fusion and the Influence of Gas Flow Distribution on Parts Quality.” Rapid Prototyping Journal 28: 1706–1716. doi:10.1108/RPJ-12-2021-0351.
- Liu, S., H. Zhu, G. Peng, J. Yin, and X. Zeng. 2018. “Microstructure Prediction of Selective Laser Melting AlSi10Mg Using Finite Element Analysis.” Materials & Design 142: 319–328. doi:10.1016/j.matdes.2018.01.022.
- Marattukalam, J. J., D. Karlsson, V. Pacheco, P. Beran, U. Wiklund, U. Jansson, B. Hjörvarsson, and M. Sahlberg. 2020. “The Effect of Laser Scanning Strategies on Texture: Mechanical Properties, and Site-Specific Grain Orientation in Selective Laser Melted 316L SS.” Materials & Design 193: 108852. doi:10.1016/j.matdes.2020.108852.
- Matthews, M. J., G. Guss, S. A. Khairallah, A. M. Rubenchik, P. J. Depond, and W. E. King. 2016. “Denudation of Metal Powder Layers in Laser Powder Bed Fusion Processes.” Acta Materialia 114: 33–42. doi:10.1016/j.actamat.2016.05.017.
- Menter, F. R. 1994. “Two-Equation Eddy-Viscosity Turbulence Models for Engineering Applications.” AIAA Journal 32: 1598–1605. doi:10.2514/3.12149.
- Menter, F. R., M. Kuntz, and R. Langtry. 2003. “Ten Years of Industrial Experience with the SST Turbulence Model.” In Turbulence, Heat and Mass Transfer 4, edited by K. Hanjalic, Y. Nagano, and M. Tummers, 625–632. Danbury (US): Begell House.
- Murr, L. E. 2019. “Strategies for Creating Living, Additively Manufactured: Open-Cellular Metal and Alloy Implants by Promoting Osseointegration, Osteoinduction and Vascularization: An Overview.” Journal of Materials Science & Technology 35: 231–241. doi:10.1016/j.jmst.2018.09.003.
- Nguyen, Q. B., D. N. Luu, S. M. L. Nai, Z. Zhu, Z. Chen, and J. Wei. 2018. “The Role of Powder Layer Thickness on the Quality of SLM Printed Parts.” Archives of Civil and Mechanical Engineering 18: 948–955. doi:10.1016/j.acme.2018.01.015.
- Pashkis, V. 1945. “Trans.” AFS 53: 90.
- Pauzon, C., P. Forêt, E. Hryha, T. Arunprasad, and L. Nyborg. 2020. “Argon-Helium Mixtures as Laser-Powder Bed Fusion Atmospheres: Towards Increased Build Rate of Ti-6Al-4V.” Journal of Materials Processing Technology 279: 116555. doi:10.1016/j.jmatprotec.2019.116555.
- Pham, M.-S., B. Dovgyy, P. A. Hooper, C. M. Gourlay, and A. Piglione. 2020. “The Role of Side-Branching in Microstructure Development in Laser Powder-Bed Fusion.” Nature Communications 11: 749. doi:10.1038/s41467-020-14453-3.
- Reijonen, J., A. Revuelta, T. Riipinen, K. Ruusuvuori, and P. Puukko. 2020. “On the Effect of Shielding Gas Flow on Porosity and Melt Pool Geometry in Laser Powder Bed Fusion Additive Manufacturing.” Additive Manufacturing 32: 101030. doi:10.1016/j.addma.2019.101030.
- Ren, Y., L. Liang, Q. Shan, A. Cai, J. Du, Q. Huang, S. Liu, X. Yang, Y. Tian, and H. Wu. 2020. “Effect of Volumetric Energy Density on Microstructure and Tribological Properties of FeCoNiCuAl High-Entropy Alloy Produced by Laser Powder Bed Fusion.” Virtual and Physical Prototyping 15: 543–554. doi:10.1080/17452759.2020.1848284.
- Schleifenbaum, H., A. Diatlov, C. Hinke, J. Bultmann, and H. Voswinckel. 2011. “Direct Photonic Production: Towards High Speed Additive Manufacturing of Individualized Goods.” Production Engineering 5: 359–371. doi:10.1007/s11740-011-0331-0.
- Shcheglov, P. Y., S. A. Uspenskiy, A. V. Gumenyuk, V. N. Petrovskiy, M. Rethmeier, and V. M. Yermachenko. 2011. “Plume Attenuation of Laser Radiation During High Power Fiber Laser Welding.” Laser Physics Letters 8: 475–480. doi:10.1002/lapl.201110010.
- Sing, S. L., C. N. Kuo, C. T. Shih, C. C. Ho, and C. K. Chua. 2021. “Perspectives of Using Machine Learning in Laser Powder Bed Fusion for Metal Additive Manufacturing.” Virtual and Physical Prototyping 16: 372–386. doi:10.1080/17452759.2021.1944229.
- Sun, S.-H., T. Ishimoto, K. Hagihara, Y. Tsutsumi, T. Hanawa, and T. Nakano. 2019. “Excellent Mechanical and Corrosion Properties of Austenitic Stainless Steel with a Unique Crystallographic Lamellar Microstructure via Selective Laser Melting.” Scripta Materialia 159: 89–93. doi:10.1016/j.scriptamat.2018.09.017.
- Takase, A., T. Ishimoto, R. Suganuma, and T. Nakano. 2021. “Lattice Distortion in Selective Laser Melting (SLM)-Manufactured Unstable β-Type Ti-15Mo-5Zr-3Al Alloy Analyzed by High-Precision X-ray Diffractometry.” Scripta Materialia 201: 113953. doi:10.1016/j.scriptamat.2021.113953.
- Wang, L., J. Jue, M. Xia, L. Guo, B. Yan, and D. Gu. 2016a. “Effect of the Thermodynamic Behavior of Selective Laser Melting on the Formation of In Situ Oxide Dispersion-Strengthened Aluminum-Based Composites.” Metals 6: 286. doi:10.3390/met6110286.
- Wang, P., J. Song, M. L. S. Nai, and J. Wei. 2020a. “Experimental Analysis of Additively Manufactured Component and Design Guidelines for Lightweight Structures: A Case Study Using Electron Beam Melting.” Additive Manufacturing 33: 101088. doi:10.1016/j.addma.2020.101088.
- Wang, D., C. Song, Y. Yang, and Y. Bai. 2016b. “Investigation of Crystal Growth Mechanism During Selective Laser Melting and Mechanical Property Characterization of 316L Stainless Steel Parts.” Materials and Design 100: 291–299. doi:10.1016/j.matdes.2016.03.111.
- Wang, L. Y., Y. C. Wang, Z. J. Zhou, H. Y. Wan, C. P. Li, G. F. Chen, and G. P. Zhang. 2020b. “Small Punch Creep Performance of Heterogeneous Microstructure Dominated Inconel 718 Fabricated by Selective Laser Melting.” Materials & Design 195: 109042. doi:10.1016/j.matdes.2020.109042.
- Wen, P., L. Jauer, M. Voshage, Y. Chen, R. Poprawe, and J. H. Schleifenbaum. 2018. “Densification Behavior of Pure Zn Metal Parts Produced by Selective Laser Melting for Manufacturing Biodegradable Implants.” Journal of Materials Processing Technology 258: 128–137. doi:10.1016/j.jmatprotec.2018.03.007.
- Wen, P., Y. Qin, Y. Chen, M. Voshage, L. Jauer, R. Poprawe, and J. H. Schleifenbaum. 2019. “Laser Additive Manufacturing of Zn Porous Scaffolds: Shielding Gas Flow: Surface Quality and Densification.” Journal of Materials Science & Technology 35: 368–376. doi:10.1016/j.jmst.2018.09.065.
- Willy, H. J., X. Li, Z. Chen, T. S. Herng, S. Chang, C. Y. A. Ong, C. Li, and J. Ding. 2018. “Model of Laser Energy Absorption Adjusted to Optical Measurements with Effective Use in Finite Element Simulation of Selective Laser Melting.” Materials & Design 157: 24–34. doi:10.1016/j.matdes.2018.07.029.
- Wolff, S. J., S. Lin, E. J. Faierson, W. K. Liu, G. J. Wagner, and J. Cao. 2017. “A Framework to Link Localized Cooling and Properties of Directed Energy Deposition (DED)-Processed Ti-6Al-4V.” Acta Materialia 132: 106–117. doi:10.1016/j.actamat.2017.04.027.
- Zhang, W., D. Guo, L. Wang, C. M. Davies, W. Mirihanage, M. Tong, and N. M. Harrison. 2023. “X-ray Diffraction Measurements and Computational Prediction of Residual Stress Mitigation Scanning Strategies in Powder Bed Fusion Additive Manufacturing.” Additive Manufacturing 61: 103275. doi:10.1016/j.addma.2022.103275.
- Zhang, L., S. Zhang, and H. Zhu. 2021. “Effect of Scanning Strategy on Geometric Accuracy of the Circle Structure Fabricated by Selective Laser Melting.” Journal of Manufacturing Processes 64: 907–915. doi:10.1016/j.jmapro.2021.02.015.
- Zheng, H., H. Li, L. Lang, S. Gong, and Y. Ge. 2018. “Effects of Scan Speed on Vapor Plume Behavior and Spatter Generation in Laser Powder Bed Fusion Additive Manufacturing.” Journal of Manufacturing Processes 36: 60–67. doi:10.1016/j.jmapro.2018.09.011.
- Zheng, H., Y. Wang, Y. Xie, S. Yang, R. Hou, Y. Ge, L. Lang, S. Gong, and H. Li. 2021. “Observation of Vapor Plume Behavior and Process Stability at Single-Track and Multi-Track Levels in Laser Powder Bed Fusion Regime.” Metals 11: 937. doi:10.3390/met11060937.
- Zou, J., W. Yang, S. Wu, Y. He, and R. Xiao. 2016. “Effect of Plume on Weld Penetration During High-Power Fiber Laser Welding.” Journal of Laser Applications 28: 022003. doi:10.2351/1.4940148.