
 ?Mathematical formulae have been encoded as MathML and are displayed in this HTML version using MathJax in order to improve their display. Uncheck the box to turn MathJax off. This feature requires Javascript. Click on a formula to zoom.
ABSTRACT
Motivated by the effect of cooling rate on microstructure, standard air cooling (AC) and novel cryogenic cooling (CC) were employed in the wire-arc directed energy deposition process of Mg-alloy. The influences of cooling modes on macrostructure, defects, microstructure, mechanical properties and deformation behaviour were systematically investigated. Compared with AC component, CC component exhibits improved performance with yield strength, ultimate tensile strength and elongation increased by 50%, 58% and 174%, respectively. The improved strength-ductility synergy can be attributed to the decreased porosity, profuse nano-precipitates, finer equiaxed grain within inter-layer and the transformation of columnar to equiaxed grain within intra-layer. The enhancement of strain hardening rate by highly coherent nano-precipitates impeding dislocations glide, dynamic Hall-Petch effect of multiple twins and numerous 3D obstacle networks of dislocations should be responsible for the significant elongation improvement. This study thus introduces new insights into defect alleviation, microstructure modification and performance enhancement of additive manufacturing Mg-alloys.
1. Introduction
Light weight magnesium alloys are known as one of the twenty-first-century green engineering materials, which have been used in many industrial fields such as aviation, aerospace, and automotive due to their excellent properties (Jin et al. Citation2022; Pollock Citation2010; Yang et al. Citation2021). Currently, in order to further promote the rapid development and widespread application of Mg alloys, the manufacture of large-scale Mg alloys components with complex shapes is an urgent requirement (Yang et al. Citation2020). Most of the current Mg components are fabricated in wrought or casting form. The wrought Mg components are usually restricted to simple geometries considering their poor ductility associated to their hexagonal closed packing (HCP) structure of Mg (Proust Citation2019). Complex Mg components can be fabricated by casting, but their mechanical properties are usually inferior than their wrought counterparts due to the coarse solidification grain structure and potential micro-segregation. Consequently, it is worthwhile to explore an alternative advanced manufacturing process to fabricate large-size components of Mg alloys with improved mechanical properties and complex geometries.
Wire and arc additive manufacturing (WAAM), as an emerging directed energy deposition (DED) technology, enables rapid prototyping of large-scale components with complex geometric features and customisable microstructures (Chang et al. Citation2022). WAAM technology has been widely explored over recent years in the aerospace, automotive, and high-speed railway fields owing to its advantages of high deposition efficiency, low cost, and almost no limitation in forming component size (Chang et al. Citation2022). Up to now, although the research on WAAM of Mg alloys is steadily flourishing, the research progress is far behind other alloy systems due to the challenges of preparing raw wires, severe evaporation of elements and the poor oxidation resistance (Takagi et al. Citation2018; Yi, Wang, and Cao Citation2022). Meanwhile, most of efforts have been focused on investigating the effects of process parameters and heat treatment on the macroscopic morphology, microstructure and mechanical properties of Mg alloy components (Yi, Wang, and Cao Citation2022). The AZ-series Mg alloys are promising to be widely utilised in the industry owing to their economic advantages. Among them, the AZ31 Mg-alloys, as one of the AZ-series magnesium alloys with the lowest alloy content, are still suffering to some challenging obstacles to its widespread applications due to their low ductility and poor strength. Additionally, the complicated solidification conditions inherent to WAAM technology usually leads to the growth of columnar grain structure, resulting in poor tensile properties and anisotropic mechanical performances (Wang, Zhang, et al. Citation2021; Yi, Wang, and Cao Citation2022). The AZ31 Mg-alloy prepared by Yang et al. (Citation2020) using the CMT-based WAAM technique was characterised by epitaxial columnar dendrites, thus leading to anisotropic characteristics with the ultimate tensile strength (UTS) of 152 and 211 MPa in the travel and build directions, respectively. Other examples of WAAM-prepared AZ31 Mg-alloy were also featured by heterogeneous microstructure with fine columnar dendrite grains in the deposited layer and coarse equiaxed grains in the interlayers, which also exhibit poor and anisotropic mechanical properties (Wang, Zhang, et al. Citation2021). Moreover, the high temperature of melt pool contributes to the evaporation of the alloying elements (e.g. Mg and Zn), resulting in an increased tendency of nucleation for pores defects (Fang et al. Citation2022; Takagi et al. Citation2018; Ying et al. Citation2022). Previous investigation has shown that the volume fraction of defects is up to 0.569% due to the intense arc heat input during deposition (Ying et al. Citation2022). However, current research is still lacking in the effective implementation of microstructure modification and defect elimination for AZ31 components fabricated by WAAM technology (Yi, Wang, and Cao Citation2022). Therefore, there is an urgent need to explore a methodology for in-situ defect elimination and facilitating the columnar to equiaxed transition (CET) process, aiming to further improve its comprehensive properties and drive its widespread application. The prevalent approach to achieve this goal is to modify the cooling modes and apply external energy field (ultrasound, magnetic field, etc.). In fact, the application of an external energy field has been separately attempted on Mg alloys fabricated by traditional manufacturing method and WAAM of materials other than Mg alloys (Che et al. Citation2022; Du et al. Citation2019; Todaro et al. Citation2020; Yuan, Kou, and Luo Citation2016; Zhao et al. Citation2022). The mechanism of porosity reduction by external energy fields is to facilitate the escape of pores, instead of inhibiting their nucleation. For Mg-alloys, which are susceptible to evaporation, approaches to prevent pore nucleation are more important. Therefore, this study concentrates on the alleviation effect of cooling mode during the stage of pores nucleation. On the one hand, some pioneering investigations have demonstrated that the microstructural characteristics and mechanical properties could be effectively tuned by controlling the cooling conditions during conventional friction stir processing of AZ31 components (Rathinasuriyan et al. Citation2021; Xu and Bao Citation2016). On the other hand, in view of the previous investigation about 2219 Al alloy components prepared by WAAM technology, it was revealed that the morphological characteristics of grains and precipitates were significantly altered by adjusting the cooling conditions (air cooling and water cooling), and the equivalent size and volume fraction of the defects are also remarkably modified (Zhou, Lin, et al. Citation2022). Therefore, in order to extend the application of AZ31 alloy, it is necessary to deeply investigate the effect of the cooling mode on the microstructure, defects, and properties of AZ31 components fabricated by WAAM technology.
In order to solve the above-mentioned problems, AZ31 components were successfully prepared by the WAAM technology under various cooling modes (air cooling and cryogenic cooling by liquid nitrogen) in this study. Moreover, the evolution of defect characteristics, microstructure, and mechanical properties was systematically investigated. Particularly, the underlying mechanisms of defect inhibition, microstructure evolution, deformation behaviour, and improved strength-ductility synergy are comprehensively revealed with the help of extensive characterisation techniques. The present study aims to explore a novel route to modify microstructure and enhance the mechanical properties of WAAM-prepared AZ31 magnesium alloys, shedding new light on the high-efficiency manufacturing of high-performance large-scale components.
2. Materials and experimental details
2.1. Materials and WAAM-CMT procedure
The filler wire used in this work was AZ31 with diameter of 1.2 mm, and its specific chemical composition (wt. %) measured by ICP-AES was 2.54% Al, 0.55% Zn, 0.38% Mn and 96.53% Mg. The rolled AZ31 plate (160 mm *160 mm* 30 mm) was used as substrate. The AZ31 thin wall-shaped components were deposited using the cold metal transfer-based wire arc additive manufacturing (WAAM-CMT) system, which consisted of a Fronius CMT Advanced 4000 R power supply and a KUKA KR20 robot. Except for the difference in cooling modes ((a)), the utilised deposition parameters () of the two components were kept consistent to ensure the comparability of the experimental results. For simplicity, the cooling mode using liquid nitrogen-cooled substrate was defined as cryogenic cooling (CC) component, while the cooling mode using air-cooled environment was defined as air cooling (AC) component. An alternating deposition path was adopted and both components contained 36 layers with height of about ∼100 mm. An interlayer dwell time of 60 s was used to remove the oxide film from the freshly deposited layer.
Figure 1. Schematic diagram of the WAAM process as well as the positions (a) and dimensions (b and c) of the test samples.
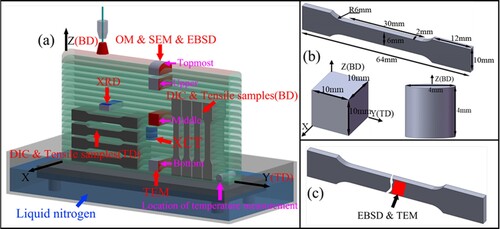
Table 1. The optimised processing parameters used in the CMT-WAAM process.
2.2. Densification and microstructural characterisation
The samples used for metallographic and particle analysis were separated from the bottom, middle, upper, and topmost regions of the thin wall-shaped components using Electrical Discharge Machining (EDM) cutting ((a)). The 3D defects were characterised via X-ray computed tomography (XCT) with maximum resolution of 2 μm. The equivalent diameter Φ and sphericity Ψ of defect characteristics were introduced in Equations (1) and (2).
(1)
(1)
(2)
(2) where V and A are the volume (μm3) and surface area (μm2) of defects, respectively.
The microstructural characterisation specimens after polishing were chemically etched in the mixed etchant (5 g picric acid, 4 mL acetic acid, 2 mL distilled water, 20 mL ethanol) for approximately 15 s, then it was viewed with polarised light plus a sensitive tint filter via an optical microscopy (OM, OLYMPUS BX53MRF-S). To obtain crystallographic information, Electron Back Scatter Diffraction (EBSD) scanning at step size of 4 μm was performed at 15 kV with working distance of 15 mm. AztecCrystal software was used to post-process the crystallographic orientation and kernel average misorientation (KAM). The precipitates and fractography analysis of the specimens were characterised by GEMINI 500 field emission scanning electron microscopy (SEM). The precipitates of as-built specimens and deformation substructures after tensile testing were further explored via a FEI Tecnai G2 F20 and FEI Themis Z Aberration Corrected transmission electron microscope (TEM) at an accelerating voltage of 200 kV. The phase constitution was analysed using an X-ray diffractometer (Bruker D8 ADVANCE, Cu Kα), and the patterns were collected between 25° and 85°, operated at 40 kV and 40 mA with a step size of 0.02°.
2.3. Mechanical testing
The mechanical properties of components were tested using uniaxial tensile tests according to the ASTM E8M-09 standard. The tensile bars (gauge length ∼ 6 * 2 * 25 mm) were separated by EDM cutting from the bottom to middle zone of the thin wall-shaped components (). Room-temperature tensile properties were evaluated on CMT-5105 machine with a constant crosshead displacement speed of 0.6 mm/min. Tensile tests were conducted for samples along the building (BD) and travel direction (TD) (see (a)), and each type of sample was repeated at least three times to ensure reproducibility. During the tensile process, in-situ Digital Image Correlation (DIC) was used to illustrate the strain-fields evolution.
3. Results
3.1. Macrostructure and internal defects
The macrostructure of AC and CC components is shown in Figure S1. The profile flatness of CC components is inferior to that of AC components, the accelerated cooling rate thereby reduces the effective width of the single wall. Interestingly, the melt pool morphology of AC components shows nearly symmetrical band, while that of CC components is asymmetrical crescent appearance. It is understood that the macrostructure of the component was mainly affected by the melt pool morphology. And the morphological evolution of the melt pool can be explained in terms of the role of the contact angle (Jing et al. Citation2022). Under the same arc heat input, cryogenic cooling will reduce the interlayer wettability and contact angle. Since post process machining is almost inevitable for WAAM components, this change in surface morphology (as shown in Figure S1(b, c)) is acceptable. However, it is more important that the CC mode also reduces the porosity and thus improves the properties of the CC component, making it a promising way to fabricate high performance WAAM-prepared AZ31 component.
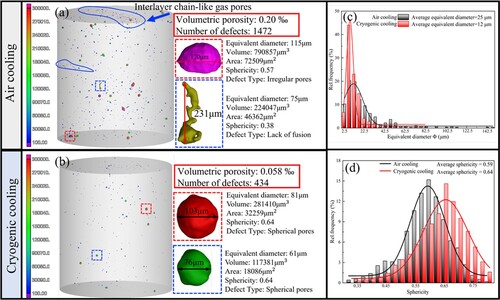
3D reconstructed XCT images were applied to reveal the sizes, appearances and spatial distribution of defects from the middle regions of the samples with different cooling modes, as shown in . The volumetric porosity of AC component is 0.20‰ with many visible large-sized defects ((a)). Interestingly, the volumetric porosity of CC component significantly decreases to 0.058‰ (i.e. reduction of ∼70%), the large-sized defects disappear completely leaving with only small pores ((b)). Meanwhile, the number of defects in the sample of CC mode significantly reduces. Additionally, it can be clearly observed from (a) that massive chain-like gas pores are detected in the interlayer region of the AC component. On the contrary, there is almost no interlayer defect clustering region in the CC component ((b)). Previous studies have demonstrated that a substantial number of defects frequently accumulate in the interlayer region of additively manufactured components, leading to premature failure in the weak interlayer regions (Guo et al. Citation2022; Li, Fang, et al. Citation2022; Zhou, Lin, et al. Citation2022). Typical defects are extracted from XCT images for visual analysis of defect characteristics. On the one hand, the equivalent diameter, volume and area of typical defects under the AC mode are much larger than that of the CC mode. On the other hand, the sphericity of typical defects for AC components is only 0.36–0.57, suggesting the defect types are most likely lack-of-fusion defects and irregular pores, respectively. Conversely, the sphericity of typical defects for CC components is averaged to be 0.64, suggesting the defect types are relatively regular pores. As observable in (c,d), the average equivalent diameter of defects in the CC components is only 12 μm, which is far smaller than that of the AC components (25 μm). Meanwhile, the average sphericity of the defects in the CC components is 0.64, which is higher than that of the AC components (0.59). Additionally, the number of defects with sphericity below 0.6 is reduced from ∼915 in AC components to ∼119 in CC components, suggesting that the CC mode also facilitates the reduction of the number of irregularly shaped defects.
Figure 2. The 3D reconstructed XCT images showing the porosity distribution of AC components (a) and CC components (b). The equivalent diameter (c) and sphericity (d) of defects under AC and CC components.
3.2. Heterogeneous band microstructure
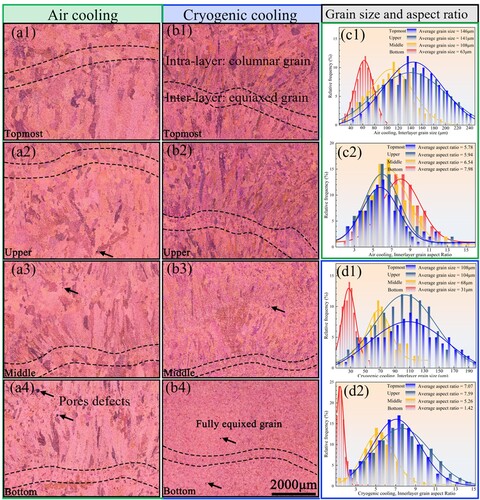
As can be seen in (a1–a4), the microstructure of the AC component is characterised by periodic heterogeneous band with an alternating distribution of the equiaxed grains in the inter-layer zone and columnar grains in the intra-layer zone, regardless of the sampled location in the thin wall-shaped component. Similarly, the middle, upper and topmost region of the CC component also exhibit this typical heterogeneous microstructure ((b1–b3)). It should be noted that the equiaxed grain size in the inter-layer zone of CC component (ranging from 31 to 108 μm) is far smaller than that of AC component (ranging from 63 μm to 146 μm), as shown in (c1, d1). Additionally, the width of intra-layer columnar grains for the CC component is also much smaller than that of the AC components. It is also worth mentioning that the region from bottom to middle of the CC components is characterised by fully equiaxed grain with finer grains (∼31 μm) in the inter-layer zone and coarser grains (∼59 μm) in the intra-layer zone ((b4)). It is well accepted that aspect ratio is an important parameter to quantitatively describe the characteristics of columnar grains (Li, Li, Jiang, et al. Citation2022). As shown in (c2), the aspect ratio in intra-layer columnar grain zone of the AC component decreases from 7.98 at the bottom region to 5.78 at the topmost region. Contrarily, the aspect ratio of the fully equiaxed grain structure in the bottom region of CC component is only 1.42, and the aspect ratio in intra-layer columnar grain zone increases from 5.26 at the middle region to 7.07 at the topmost region ((d2)). In summary, compared to the AC mode, the grain evolution of CC components is mainly demonstrated in the following three aspects: (1) inter-layer equiaxed grain size is significantly decreased; (2) intra-layer columnar grain width is also remarkably decreased; (3) finer fully equiaxed grains were achieved in the bottom to middle region.
Figure 3. Optical micrographs of the cross-sections (XOZ plane) for the AC component (a1–a4) and CC component (b1–b4). The grain size in inter-layer region and aspect ratio in intra-layer columnar grain region of AC component (c1, c2) and CC component (d1, d2), respectively.
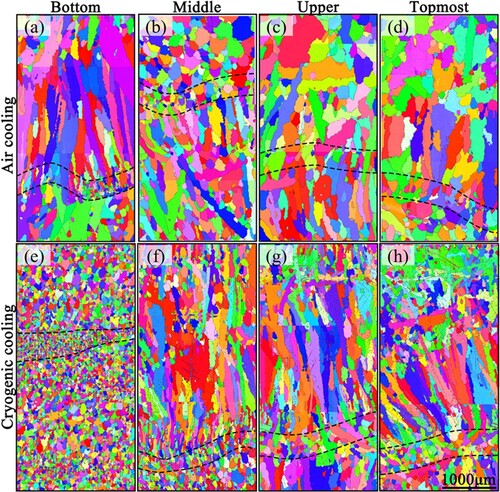
Since crystallographic information cannot be obtained by optical micrographs, we subsequently analysed the crystallographic orientation and crystallographic defects using EBSD technology, also scanned on the cross-sections (XOZ plane). As presented in , the results of grain evolution from EBSD data are consistent with those from optical micrographs. It is worth mentioning that there is almost no twinning in the AC component, while twinning is apparent for the CC component. Those multiple heating and cooling cycling process inherent to WAAM is accompanied by volume expansion and contraction, which in turn accumulates residual stresses within the components (DebRoy et al. Citation2018). There exists an enforced cooling effect of liquid nitrogen in the CC component, thereby causing greater degree of residual stress. AZ31 Mg-alloys with the low stacking fault energy (SFE) of ∼27.8 mJ/m2 generally relieve residual stress via twinning (Li, Huang, et al. Citation2022; Zhang et al. Citation2017).
Figure 4. The EBSD orientation maps of the cross-sections (XOZ plane) for the AC component (a–d) and CC component (e–h).
3.3. Precipitates evolution
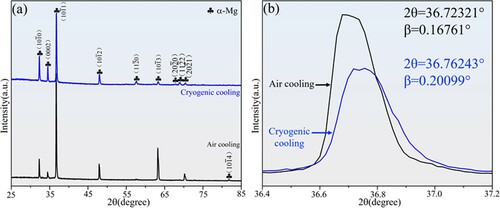
compares the XRD patterns of middle regions of the AC and CC components. It is apparent that only the main phase α-Mg was detected for both components, no peaks referring to the precipitates were evident. This should be ascribed to the low alloying element concentration and fast solidification rate inherent to WAAM. The magnification in 2θ from 36.4° to 37.2° showed that the (101) peak-position for α-Mg shifted slightly right ((b)), indicating that the interplanar crystal spacing shows a slight drop in the CC modes. Since the atomic radius of Al (0.1199 nm) and Zn (0.1187 nm) are smaller than that of Mg (0.1333 nm) (Wei et al. Citation2014), the CC modes facilitate the Al and Zn act as substitutive solutes in the α-Mg matrix according to the solid solution theory. Additionally, compared with AC component, the fitted full width at half maximum values (β) of (10
1) peak for CC component is significantly broader, indicating that there is an increase tendency for refined grain, micro-strain, and dislocation density (Borbély Citation2022).
Figure 5. The full XRD pattern of AC and CC components in the middle region (a), and 2θ magnification from 36.4° to 37.2° (b).
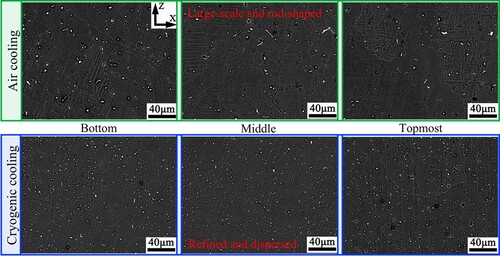
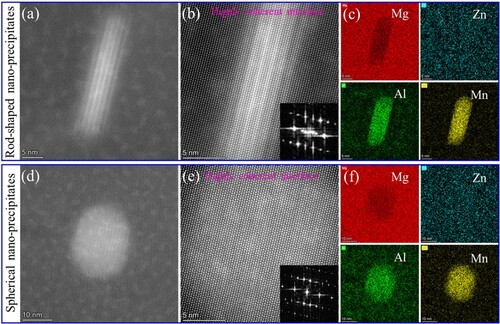
The second-phase particles of the AC and CC components in the bottom, middle and topmost region are shown in . It can be clearly observed that the evolution in the second-phase particles is reflected in both morphological and dimensional aspects. As for morphological features, the AC component is mainly dominated by rod-shaped particles, whereas the CC component is featured by near-spherical ones. Additionally, there are a large number of micro-particles under the AC mode, while the submicron-particles of the CC component are finer and evenly dispersed.
Figure 6. SEM micrographs of AC component and CC component in the cross-sections (XOZ plane).
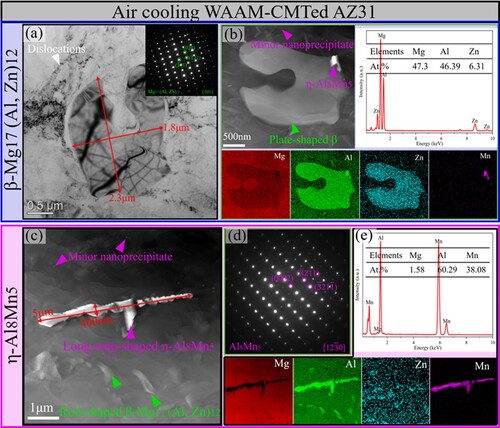
In order to clearly distinguish the evolution in precipitates type, size and morphology, TEM was subsequently used to further characterise these key parameters. presents the TEM results of the AC component. It is clearly observed that the particles are dominated by micro-scale plate-shaped, rod-shaped β-Mg17(Al, Zn)12 and long strip-shaped η-Al8Mn5, as well as minor nano-precipitates. It is noteworthy that some dislocations are clustered around micro-scale plate-shaped β-Mg17(Al, Zn)12 due to the fast cooling rates (102 K/s) inherent in WAAM-CMT (Liu et al. Citation2022). The large difference in the elastic modulus and thermal expansion coefficient between the α-Mg and particles leads to different degrees of thermal expansion near the interface and triggers plastic deformation to form dislocations (DebRoy et al. Citation2018). It is well-known that the particles of as-cast AZ-series Mg alloys are dominated by β-Mg17Al12. As for the formation of β-Mg17(Al, Zn)12 in this study, it is reasonable to deduce that it is because the partial replacement of Al atoms by Zn atoms in the β-Mg17Al12 (Yang et al. Citation2020). Meanwhile, the fast solidification rates inherent to WAAM-CMT will also facilitate the atomic replacement process. As shown in (c), the aspect ratio of micro-scale long strip-shaped η-Al8Mn5 is up to 13. It is well accepted that such long strip-shaped particles are prone to fracture and develop crack source during load bearing, which leads to premature failure of components (Huang et al. Citation2018).
Figure 7. TEM results of AC component: BF image and SAED (a), STEM HAADF image, EDS analysis results, and EDS mapping (b) of β-Mg17(Al, Zn)12. STEM HAADF image (c), SAED (d), EDS analysis results and EDS mapping (e) of η-Al8Mn5.
presents the TEM results of the CC component. It is apparent that the particles are dominated by submicron-scale plate-shaped and nano-scale acicular β-Mg17(Al, Zn)12, and submicron-scale polygonal η-Al8Mn5, as well as profuse nano-precipitates. The width of the nano-scale acicular β-Mg17(Al, Zn)12 is only 7 nm ((b)). Additionally, compared to the AC mode, the higher density of dislocations clustered around the particles in the CC component ((a)), which is attributed to the higher cooling rate developed under CC mode. Previous studies have revealed a small lattice mismatch between the η-Al8Mn5 and β-Mg17(Al, Zn)12, thus the η-Al8Mn5 can potentially provide an effective nucleation site for the β-Mg17(Al, Zn)12 (Pan et al. Citation2012; Yang et al. Citation2020). Therefore, as can be seen in (b) and (d,e), the appearance of the β-Mg17(Al, Zn)12 is generally accompanied by the η-Al8Mn5. Compared with the AC mode, the particles under the CC mode is not only transformed from micro-scale (2∼5μm) to submicron-scale (300∼700 nm) in size, but also changed from irregular to polygonal in morphology. Additionally, there exists profuse nano-precipitates in the CC component ((f)), which are characterised by rod-shaped and spherical.
Figure 8. TEM results of CC component: BF image (a), HRTEM image (b), SAED (c) and EDS mapping (d) of β-Mg17(Al, Zn)12. STEM HAADF image and SAED (e), BF and HRTEM image (f), and EDS mapping of η-Al8Mn5.
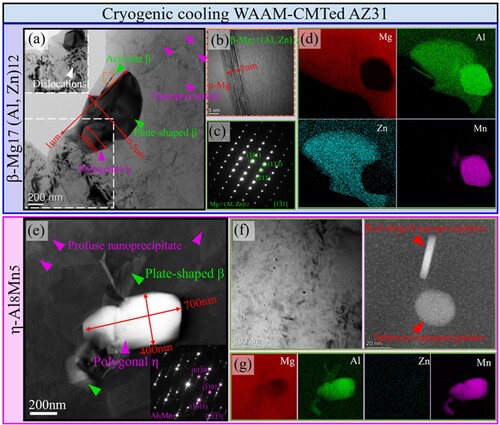
In order to evaluate whether the interface between the nano-precipitates and the matrix is coherent, Aberration Corrected TEM was used for characterisation. These nano-precipitates are enriched with the alloying elements of Al and Mn ((c,f)). Additionally, the HAADF-STEM and HRTEM images in (a,b,d,e) reveal that there exists a highly coherent interface between the α-Mg matrix and the nano-Al8Mn5, either in the rod-shaped or spherical, suggesting that they possess the potential to act as heterogeneous nucleation sites for the α-Mg grains (Cao, Qian, and StJohn Citation2006; Kim, Yim, and You Citation2007).
Figure 9. TEM results of nanoprecipitates in CC component: HAADF-STEM, HRTEM image and FFT (a, b), and EDS mapping (c) of rod-shaped nano-Al8Mn5. HAADF-STEM, HRTEM image and FFT (d, e), and EDS mapping (f) of spherical nano-Al8Mn5.
3.4. Mechanical properties and fracture morphology
presents the mechanical properties of the AC and CC components and the comparison with previously reported mechanical properties of AZ-series Mg alloys manufactured by WAAM and traditional techniques. As can be seen in (a,d), the mechanical properties of the CC component are much higher than those of the AC component, no matter in terms of strength or ductility. Specifically, the CC component exhibits yield strength (YS) of ∼105 MPa, ultimate tensile strength (UTS) of ∼258 MPa and elongation (EL) of ∼23.8%, which represents a remarkable increase of ∼50%, ∼58% and ∼174% in YS, UTS, EL, respectively, as compared to those of its AC counterpart. The strength coefficient (K) and strain-hardening exponent (n) are obtained by linearly fitting the lnσt − lnϵt curves. Apparently, the CC component possesses higher K of ∼914 to ∼917, n of ∼0.503 to ∼0.509, while the AC component shows K of ∼473 to ∼580, n of ∼0.343 to ∼0.453, respectively. The higher K and n of the CC component mean better work-hardening ability, which is more conducive to promoting uniform plastic deformation (Wang, Lin, et al. Citation2021). As displayed in (e,f), the improved strength-ductility synergy of CC component is comparable to or even higher than most WAAM-prepared AZ-series Mg alloys (Cao et al. Citation2022; Fang et al. Citation2022; Guo et al. Citation2019; Guo et al. Citation2022; Guo et al. Citation2021; Takagi et al. Citation2018; Wang, Zhang, et al. Citation2021; Yang et al. Citation2020), and as-cast or as-extruded AZ31(Hao et al. Citation2017; Laser et al. Citation2006; Liu et al. Citation2008; Peng et al. Citation2022; Zhao, Li, and He Citation2012). Specifically, the improved strain-hardening capability achieves a combination of 61.4 MPa UTS*EL.
Figure 10. Mechanical properties of AC and CC component. Representative engineering tensile stress-strain curves (a). lnσt − lnϵt curves and K, n of Holloman equation (b). True strain and strain hardening rate curves (c). Statistics of YS, UTS, and EL (d). UTS versus EL (e), and YS versus the product of UTS and EL (f) of this study compared with previously reported WAAM-prepared AZ-series Mg alloys and as-cast or as-extruded AZ31.
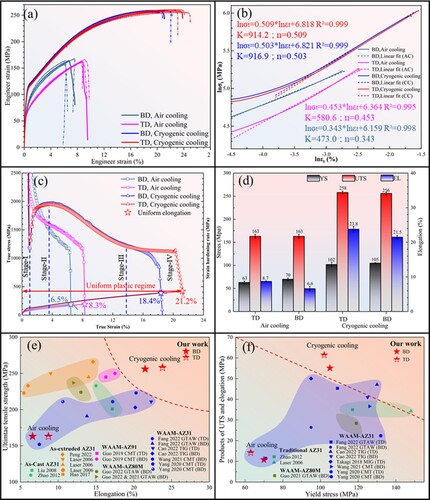
As shown in (c), the strain hardening rate (SHR) curve of the AC component possesses only two characteristic stages, while that of the CC component exhibits four characteristic stages. Generally speaking, the SHR of the AC component is far inferior to that of the CC component at the identical true strain, implying the AC component exhibits poorer uniform plastic deformation capacity. Consequently, the prematurely failed AC component shows low uniform elongation of 6.5% to 8.3%. Contrarily, the SHR of the CC component in stage-II is characterised by an abrupt increase as the true strain increases from 1% to 4%. In stage-III, the SHR exhibits a continuous decrease with increasing deformation level from 4% to 14%. The strain hardening rate in the stage-IV of BD starts to decrease rapidly until fracture, while that of TD starts to reach a plateau region until failure.
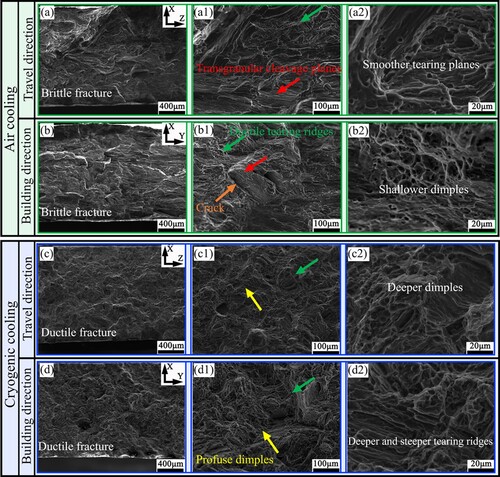
In order to reveal the fracture mode of the samples, the fractography of the AC and CC components was observed via SEM. As shown in , the AC component is characterised by typical ductile-brittle hybrid fracture mode, while the ductile fracture mode is responsible for the CC component. For the AC component, there are a large number of smooth transgranular cleavage planes ((a1,b1)), indicating transgranular cleavage fracture. Additionally, there exist limited ductile tearing ridges with smooth tearing planes, suggesting quasi-cleavage fracture. Moreover, cracks could be observed in the build direction of the AC samples ((b1)). As for the CC component, profuse dimples are visible on the fracture surfaces ((c1,d1)). Furthermore, the fracture morphologies of the CC component exhibit finer and denser dimples, as well as deeper and steeper tearing ridges, thus resulting in improved mechanical properties.
Figure 11. SEM fractographies of tensile samples for AC (a, b) and CC component (c, d).
3.5. Deformation behaviour
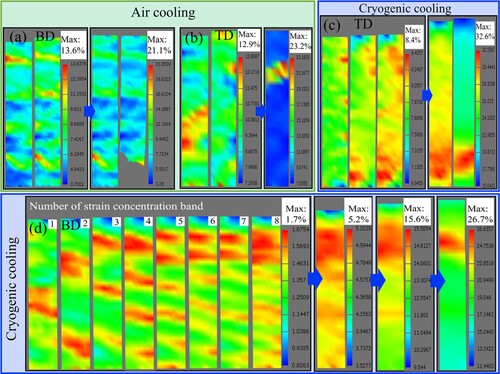
In order to investigate the spatiotemporal characteristics during plastic deformation, DIC was utilised to record the local strain evolution in real-time. It can be clearly observed in that the local strain distribution of the CC component is relatively more uniform before necking-failure stage. Interestingly, regardless of the cooling mode, strain concentration bands developed in BD samples during uniaxial loading ((a,c)). It is noteworthy that there are only four strain concentration bands in the AC component ((a)), and they remain stable until the local strain exceeds the threshold of 21.1%. In contrast, for the CC component ((d)), the number and location of strain concentration bands are continuously evolving, then the strain concentration bands gradually disappear and transform into relatively uniform strain distribution, the inhomogeneous plastic deformation is developed in one of the strain concentration regions in the final necking stage. The formation of strain concentration bands might be attributed to the periodic band microstructure. The strain coordination capacity of the inter-layer finer equiaxed grains is much greater than that of the intra-layer courser equiaxed grains, thus forming the strain concentration bands in the region of intra-layer. As shown in (d), the distance between the eight strain bands is approximately equal to the layer height (∼3 mm). As for the samples tested along TD, it is evident that the strain distribution in the CC component ((c)) is more uniform than that of the AC component ((b)), and the maximum tolerated local strain threshold is also higher.
Figure 12. DIC local strain maps in the travel direction (TD) and build direction (BD) during tensile testing for AC (a, b) and CC component (c, d).
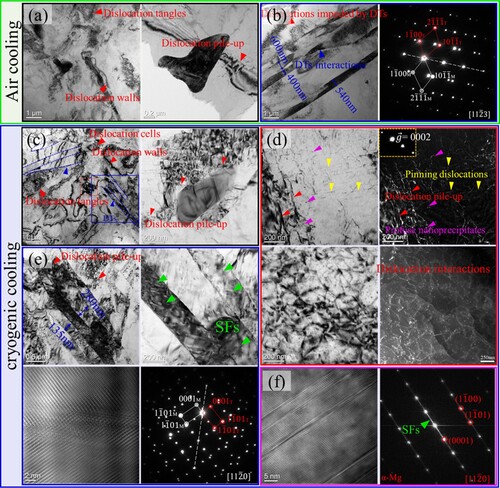
To further understand the deformation behaviour of the AC and CC samples during tensile loading, the microstructure after fracture was characterised by TEM technique. exhibits the deformation microstructures of the samples after tensile testing to fracture. It can be clearly observed that, regardless of the cooling mode, a large number of substructures such as dislocations and deformation twins (DTs) were developed during the deformation process. As shown in (a,c), dislocation motion is effectively impeded by the micro-particles, resulting in the high density of dislocation substructures such as dislocation tangles, dislocation cells, and dislocation walls around the micro-particles by means of pile-up. It is worth noting that a large number of dislocations in the CC component are pinned by profuse nano-precipitates ((d)), indicating that closely dispersed nano-precipitates serve as the obstacle to pin down and store dislocations. Additionally, multiple dislocations (arrows marked by red and yellow in (d)) interacted with each other in the vicinity of nano-precipitates to form dislocations-dislocations and dislocations-nanoprecipitates intersections. Meanwhile, the propagation of high-density dislocations is effectively impeded by the DTs, thus enabling the process of dislocation pile-up around the DTs ((b,e)). It is worth noting that the thickness of DTs developed during the tensile testing for the CC component (100 nm – 300 nm) is narrower than that of AC component (400 nm – 600 nm). Additionally, there exists massive stacking faults (SFs) within both the parent grains and the DTs during tensile deformation ((e,f)).
Figure 13. TEM results of AC (a, b) and CC components (c, d, e, f) after fracture in the tensile testing experiment.
4. Discussion
4.1. Mechanisms of defects evolution
The alloying element Mg and Zn of AZ31 are characterised by the low boiling point and high saturation vapour pressure (Wei, Wang, and Zeng Citation2015). Therefore, it is highly susceptible to the formation of supersaturated vapours due to the evaporation of alloying elements at high temperatures. These supersaturated vapours not only induce melt pool instability, leading to melt pool sputtering, but also serve as a nucleation source for pores defects (Li, Fang, et al. Citation2022). Therefore, it is extremely challenging to completely eliminate the defects developed during the additive manufacturing process of AZ-series Mg alloys. In fact, the CC component with superior mechanical properties in this study still did not achieve full densification. It is commonly believed that the procedure of pores formation is divided into three stages: nucleation, growth, and escaping (Zhou, Lin, et al. Citation2022). Additionally, some recent studies have discovered that the defects in additively manufactured components may also re-emergence or even re-grow during subsequent heat treatment (McLean et al. Citation2022; Tammas-Williams et al. Citation2016; Wang, Yang, et al. Citation2022). Therefore, the following discussion will reveal the mechanisms of defects evolution in the CC component from the four aspects mentioned above.
Nucleation process. Under the CC mode, the temperature of the substrate is always near −196°C, so the heat conduction rate of the melt pool is relatively higher. In other words, the cooling rate of the CC mode is higher than that of the AC mode (Zhou, Lin, et al. Citation2022). Some pioneering studies have demonstrated that the critical volume of supersaturated vapours for initiation of pore nucleation will increase with increased cooling rate (Chen et al. Citation2019; Zhou, Lin, et al. Citation2022). Additionally, as shown in Figure S2, the dwell time during high temperature stage of the CC mode is much less than that of the AC mode, meaning that less supersaturated vapours can be developed. Therefore, the potential risk of defects nucleation under the CC mode is effectively mitigated. As confirmed by the XCT results, the number of defects in the CC component (434) was far lower than that of the AC component (1472).
Growth process. As mentioned above, the higher cooling rate of the CC mode not only promotes the transformation of grain structure from columnar to equiaxed, but also greatly decreases the grain size ( and ). The increasing interface curvature and grain boundary area can effectively hinder the migration and aggregation process of the pores (Zhou, Lin, et al. Citation2022). Consequently, the average equivalent diameter of the defects in the CC component (12 μm) is smaller than that of the AC component (25 μm).
Escaping process. There exists a critical floating velocity for the escaping process of pores. Once the pore upward velocity is greater than the solidification rate of the melt, the pores can escape successfully and the defects in the component are significantly mitigated. According to previous studies (Zhou, Lin, et al. Citation2022), the floating velocity of pores can be quantitatively assessed by the following equation:
(3)
(3) where v is the floating velocity of pores, ρ1 is the density of Mg alloy melt (1.58 g/cm3), ρ2 is the density of the gas (0.84 g/cm3), g is the gravitational constant (9.8 m/s2), r is the average equivalent radius of pores, and µ is the viscosity of the Mg alloy melt (1.25 kg/(m*s)) (WebWISER Citation2022). It is calculated that the floating velocity (0.05–0.2 mm/s) in these two cooling modes is far less than the solidification rate of WAAM technology (10−4–10−3 m/s) (Liu et al. Citation2022). Consequently, the difference in cooling mode has almost no effect on the gas escaping process in this study.
Post in-situ heat treatment. The thermal diffusion of the next deposited layer will affect the previous deposition layer by the in-situ (or intrinsic) heat treatment (Li, Fang, et al. Citation2022). It is generally accepted that the optimised solid solution temperature and aging temperature for AZ31 Mg alloys are ∼420°C and ∼220°C, respectively (Xian et al. Citation2021). It can be clearly observed from Figure S2 that each deposited layer of the AC component has experienced four solid solution treatments, while only one existed for CC component. Additionally, each deposited layer of the AC component has almost been continuously undergoing the ageing process, while the CC component has only undergone six times. Some pioneering studies in recent years have revealed that additively manufactured components are highly susceptible to inducing variations in defect types and volume fractions during the post heat treatment process (McLean et al. Citation2022; Tammas-Williams et al. Citation2016). Therefore, the prolonged heat treatment time in the AC mode may not only make the defects re-grow, but also cause more defects to reappear.
4.2. Mechanisms of microstructure evolution
There exist differences in microstructure between the AC and CC components, which is mainly reflected in grain structure and precipitates state. As for grain structure in the CC component, the size of the equiaxed grains within inter-layer is significantly reduced, and the large-sized columnar grains within intra-layer are also transformed into refined equiaxed grains (from bottom to middle region). In terms of precipitates state, the large-sized particles changed from micron-scale of the AC mode to submicron-scale of the CC mode, and abundant nano-precipitates are achieved.
Grain structure. The solidified grain growth is closely related to the total undercooling. It is generally accepted that columnar to equiaxed transition (CET) of additive manufacturing grain structures is mainly involved in curvature, thermal and constitutional undercoolings (Li, Cheng, et al. Citation2022; Liu et al. Citation2019; Prasad et al. Citation2020; Song et al. Citation2022). Only if the curvature radius of the dendrite tip is less than 10μm, the curvature undercooling will have an influence on the solid–liquid interface state (Liu et al. Citation2019), thus its effect is not considered in this study. Previous studies have reported that increasing the cooling rate can develop more significant thermal undercooling due to the lagging of the dendrite growth rate behind the pull velocity ((a,c)), thus substantially reducing the size of the nucleation free zone (Prasad et al. Citation2020; Song et al. Citation2022). As shown in Figure S3, the α-Mg phase first nucleates and grows in the initial stage of solidification (∼635°C) until the final stage at 584°C (Laser et al. Citation2006; Yang et al. Citation2020). As the temperature continues to decrease, the Al8Mn5 phase begins to nucleate once it reaches ∼628°C (Laser et al. Citation2006; Yang et al. Citation2020). The highly coherent interface between the nanoprecipitates and matrix offers the potential to act as nucleation site (), thus enhancing the constitutional undercooling (Li, Cheng, et al. Citation2022). According to the statistics of nano-precipitates spacing and number in (f), the number density of η-Al8Mn5 nucleation sites is about ∼2.3*1020/m3. As shown in Figure S4(b), the fully equiaxed grains can be obtained once the number density of nucleation sites is greater than ∼1*1018/m3. Therefore, the higher cooling rate and those profuse nanoprecipitates under CC mode facilitates the achievement of CET. It is worth mentioning that achieving the CET of the entire component by full-time cryogenic cooling along deposition direction is promising.
Figure 14. Schematic illustrations of the grain and precipitates evolution in the AC (a, b) and CC (c, d) components during solidification process and in-situ heat treatment.
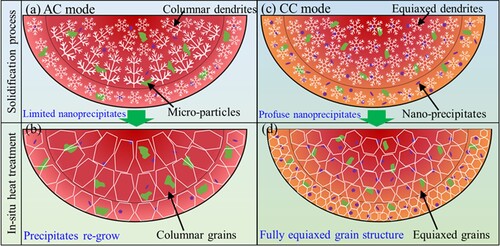
Precipitate state. The refined grains of the CC components signify more grain boundaries per unit area, which is conducive to promoting the refinement and dispersion distribution of the large-sized particles ((d)). Additionally, the AC component undergoes the aging treatment almost continuously until the entire component was deposited (Figure S2), thus there exists the possibility of precipitates coarsening ((b)). As for the formation of abundant nanoprecipitates in the CC mode, this phenomenon can be attributed to its faster cooling rate. On the one hand, the faster cooling rate advances the nucleation timing of Al8Mn5 phase (Li, Cheng, et al. Citation2022; Song et al. Citation2022), thus facilitating the formation of Al8Mn5. On the other hand, the faster cooling rate inhibits the diffusion and aggregation process of the alloying elements Al and Mn atoms (Li, Cheng, et al. Citation2022), thus promoting the formation of rod-shaped and spherical nano-Al8Mn5 rather than long strip-shaped micro-Al8Mn5.
4.3. Strengthening mechanisms
It is generally accepted that there exist four principle strengthening mechanisms account for the yield strength improvement of metallic alloys, including solid-solution strengthening, Hall-Petch strengthening, dislocation strengthening, dispersion strengthening via well-dispersed nanoprecipitate (Cui, Liaw, and Zhang Citation2022; Fu et al. Citation2023; Kang et al. Citation2021; Li, Wilde, and Zhang Citation2021; Wang, Zha, et al. Citation2022).
Solid-solution strengthening. The CC mode is characterised by the higher cooling rate, which undoubtedly promotes the solid solution process of the alloying elements. The solid solution strengthening arising from the different solute atoms in the alloy can be considered as the superimposed value of the strengthening contribution of a single primary solute (Fu et al. Citation2023). And the contribution of solid-solution strengthening is generally estimated by (Toda-Caraballo, Galindo-Nava, and Rivera-Díaz-del-Castillo Citation2014):
(4)
(4) where BAl is the strengthening coefficient for solute Al (120 MPa (at.%)2/3) and XAl is the atomic solute content of Al element (∼3 at.%). Thus, the maximum attainable contribution owing to solid solution strengthening is only 2.5 MPa.
Hall-Petch strengthening. As shown in and , although the microstructure of these two cooling modes exhibited the heterogeneous periodic band distribution, the grain size of the CC component was significantly smaller than that of AC component. And the grain boundary strengthening is usually evaluated by Hall-Petch relationship (Zhou, Le, et al. Citation2022):
(5)
(5) where k is the Hall-Petch slope (158 MPa*μm1/2) and d is the average grain size. According to the static statistics, the average grain size of the AC component is ∼150 μm, while that of CC component is ∼60 μm. Thus, the contribution of refined grains to the yield strength is estimated as ∼7.5 MPa.
Dislocation strengthening. As is well-known, the dislocation density can be roughly estimated through the Williamson–Hall method (Williamson and Hall Citation1953). The crystal size (D), micro-strain (ϵ), and dislocation density (ρ) can be calculated by the following equation (Li, Huang, et al. Citation2022):
(6)
(6)
(7)
(7)
(8)
(8)
(9)
(9) where β represents the fitted full width at half maximum (FWHM) values of (10
1) peak, K is a constant (∼0.9), λ is the radiation wavelength of CuKα (0.15405 nm), D is the crystallite size, ϵ is the micro-strain and θ is the Bragg angle of the (10
1) peak, b is the burger vector (0.32 nm for Mg). According to the fitted data in , the calculated dislocations density of the AC and CC component are 6.36*1011 m−2 and 4.76*1012 m−2, respectively. The contribution of dislocation strengthening is generally estimated by (Zhou, Le, et al. Citation2022):
(10)
(10) where M is the Taylor factor ∼2.5 for Mg alloy, α is a coefficient of 0.3, G is the shear modulus (∼16.5 GPa) of Mg matrix. Therefore, the contribution of dislocations to the yield strength increment is estimated as ∼5.5 MPa.
Dispersion strengthening. As shown in (f), and (d), the abundant nano-precipitates within the α-Mg grains effectively impede the movement of dislocations. According to the interaction of dislocations-nanoprecipitates, the contribution value of dispersion strengthening can be estimated by the following equation (Li, Li, Lin, et al. Citation2022):
(11)
(11) where r and f are the average radius and volume fraction of nano-precipitates, respectively. v is the Poisson’s ratio of the Mg matrix (0.35). According to the statistics of the TEM results, the radius of the nano-precipitates is ∼8 nm, and the volume fraction of the nano-precipitates within AC components is ∼0.4%, while that of CC component is ∼1% (supplementary material 5). Hence, the estimated contribution of dispersion strengthening to the yield strength increment is about 24.4 MPa.
Based on the above strengthening mechanisms, the total theoretical calculated maximum value of yield strength increment is ∼39.9 MPa, which is quite close to the experimental value from 35 to 39 MPa. It is noteworthy that the most prominent contribution (∼61%) originates from the highly coherent nano-precipitates distributed within the α-Mg matrix.
4.4. Mechanisms of strength-ductility synergy
There exists significant difference concerning defects and microstructure between the AC and CC components, thus the corresponding mechanical properties and deformation mechanisms are substantially different. According to the characterisation results of porosity (), microstructure (Section 3.2 and 3.3), and deformation substructure (Figure S6), the schematic illustrations of each deformation stage were drawn to reveal the mechanisms of strength-ductility synergy more visually ().
Figure 15. Schematic illustrations of the mechanisms of strength-ductility synergy in the AC (e, f) and CC (a, b, c, d) components during each deformation stage.
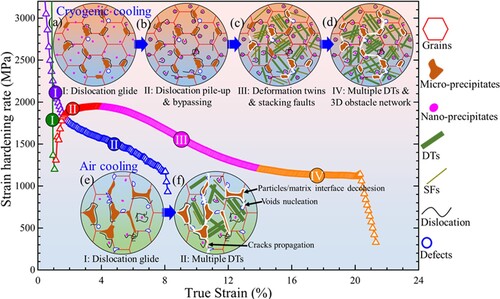
Stage I: The strain hardening rate (SHR) showed a sharp downward trend for both the AC and CC components, suggesting the nonequilibrium relationship between dislocation proliferation and annihilation (Lu et al. Citation2022). This common phenomenon can be attributed to the low amount of substructure in the initiating microstructure, as schematically shown in (a,e) and Figure S6(a,e), thus making it difficult to hinder the dislocation glide (Karthik et al. Citation2022).
The differences of Stage I are detailed in the value and the decrease rate of SHR. On the one hand, the SHR of the CC component was consistently higher than that of the AC components until the true strain of ∼0.94% (intersection point of SHR curve), contributing to the higher YS for the former than that for the latter. On the other hand, the decrease rate of SHR for the AC component is lower than that of the CC component, which could be attributed to the relatively greater hindering effect of massive micro-particles on dislocation glide during initial tensile stage (Figure S6(a,e)).
Stage II: With the true strain of AC component increasing from 2% to 8%, its SHR continues to decrease linearly with a gentler slope. This can be attributed to the appearance of multiple DTs (Figure S6(f)) (Karthik et al. Citation2022). Conversely, the SHR of CC components was characterised by a surprisingly increasing trend as the true strain increased from 1% to 4%. This interesting phenomenon can be attributed to the profuse nano-precipitates develop massive dislocation substructures by pile-up and bypassing (Figure S6(b)) (Lu et al. Citation2022), thus increasing the SHR in time and establishing the foundation for dislocations sources.
High porosity, columnar grain structure and irregular micro-particles should be responsible for the premature failure of AC component. There exist massive interlayer chain-like gas pores and irregular large-size defects, leading to the voids nucleation and cracks propagation around these defects ((f)). Meanwhile, these large-size columnar grains are difficult to coordinate macroscopic strains, leading to local stress concentration and formation of microcracks (Wang, Zhang, et al. Citation2021). Additionally, the probability of decohesion between the irregular micro-particles and matrix interfaces is significantly increased (Wu et al. Citation2022; Xi et al. Citation2023).
Stage III: With the true strain of the CC component increasing from 4% to 14%, the SHR decreases linearly with a gentler slope. And the slope is almost identical to that of the Stage II of the AC component, except that the duration of the CC component is longer. The prolonged duration can be attributed to the established dislocation source during Stage II (Karthik et al. Citation2022; Li, Liu, et al. Citation2022). As shown in (c) and Figure S6(c), the dominant deformation mechanism is the formation of SFs and the activation of DTs.
Stage IV: With further increasing true strain from 14% to 20%, the SHR of CC component starts to enter the plateau region, which can be attributed to the formation of new multiple DTs and SFs ((d) and Figure S6(d)). These new substructure divides the grains to achieve so-called dynamic Hall-Petch effect, which can significantly reduce the average free path of dislocation motion (Karthik et al. Citation2022; Lu et al. Citation2022). Additionally, the interactions of massive deformation substructure create 3D obstacle network to hinder dislocation migration.
Decreased porosity, refined equiaxed grains, regular submicron-particles, and profuse nano-precipitates should be responsible for the strength-ductility synergy of CC component. The decreased porosity reduces the risk of void’s nucleation. And the nearly full equiaxed grains makes it easier to relieve stress concentration (Fang et al. Citation2022; Zhou, Le, et al. Citation2022). As shown in (c,d), these regular submicron-particles also mitigates the risk of interfacial decohesion.
5. Conclusion
In this study, a novel cryogenic cooling (CC) mode was successfully employed to WAAM-prepare AZ31 Mg-alloys. Specifically, its influence on defect characteristics, microstructure evolution, mechanical properties and deformation mechanisms were systematically analysed. The following conclusions can be drawn:
The modification of defect characteristics and the decreased porosity under CC mode can be attributed to reduced supersaturated vapours by shortening high temperature dwell time, suppressed pores aggregation process by increasing grain boundary area, and restrained defects re-growth by cutting down the in-situ heat treatment periods.
The bottom to middle region of CC component exhibits finer equiaxed grain within inter-layer and achieves the CET within intra-layer, which can be attributed to its higher thermal undercooling and abundant nano-precipitates as nucleation sites to enhance constitutional undercooling. Additionally, the evolution of micro-particle state can be attributed to the shortened post-aging period and increased cooling rate, while the abundant nano-precipitates in CC component is a result of sluggish alloying element diffusion by faster cooling rate.
Compared with AC mode, the WAAM-prepared AZ31 components under CC mode exhibited excellent strength-ductility synergy with UTS of ∼258 MPa, YS of ∼102 MPa and EL of ∼23.8%, which were comparable to or even higher than those of previously reported most WAAM-prepared Mg-alloys and as-cast or as-extruded AZ31 Mg-alloys.
The increased solid solution, finer grains, higher dislocation density and abundant nano-precipitates should be responsible for the yield strength enhancement of CC component, while dispersion strengthening makes the most significant contribution (∼61%).
The dominant deformation mechanisms of AC component are dislocation glide and twinning activity, while those of CC component are the effectively hinder dislocations propagation by abundant nano-precipitates, massive 3D obstacle network, as well as dynamic Hall-Petch effect of multiple twins.
Acknowledgements
The authors would like to gratefully thank Yanan Chen from Instrumental Analysis Center of Xi'an Jiaotong University.
Additional information
Funding
References
- Borbély, András. 2022. “The Modified Williamson-Hall Plot and Dislocation Density Evaluation from Diffraction Peaks.” Scripta Materialia 217: 114768. doi:10.1016/j.scriptamat.2022.114768.
- Cao, Qianhui, Bojin Qi, Caiyou Zeng, Ruize Zhang, Bochang He, Zewu Qi, Fude Wang, Haibo Wang, and Baoqiang Cong. 2022. “Achieving Equiaxed Microstructure and Isotropic Mechanical Properties of Additively Manufactured Az31 Magnesium Alloy Via Ultrasonic Frequency Pulsed Arc.” Journal of Alloys and Compounds 909. doi:10.1016/j.jallcom.2022.164742.
- Cao, Peng, Ma Qian, and David H. StJohn. 2006. “Effect of Manganese on Grain Refinement of Mg–Al Based Alloys.” Scripta Materialia 54 (11): 1853–1858. doi:10.1016/j.scriptamat.2006.02.020.
- Chang, Tianxing, Xuewei Fang, Gang Liu, Hongkai Zhang, and Ke Huang. 2022. “Wire and Arc Additive Manufacturing of Dissimilar 2319 and 5b06 Aluminum Alloys.” Journal of Materials Science & Technology 124: 65–75. doi:10.1016/j.jmst.2022.02.024.
- Che, Bo, Liwei Lu, Jialong Zhang, Jinghuai Zhang, Min Ma, Lifei Wang, and Fugang Qi. 2022. “Effects of Cryogenic Treatment on Microstructure and Mechanical Properties of Az31 Magnesium Alloy Rolled at Different Paths.” Materials Science and Engineering: A 832. doi:10.1016/j.msea.2021.142475.
- Chen, Cong, Ming Gao, Hongyu Mu, and Xiaoyan Zeng. 2019. “Effect of Kerf Characteristics on Weld Porosity of Laser Cutting-Welding of Aa2219 Aluminum Alloy.” Applied Surface Science 494: 1036–1043. doi:10.1016/j.apsusc.2019.07.259.
- Cui, Kaixuan, Peter K. Liaw, and Yong Zhang. 2022. “Cryogenic-Mechanical Properties and Applications of Multiple-Basis-Element Alloys.” Metals 12 (12). doi:10.3390/met12122075.
- DebRoy, T., H. L. Wei, J. S. Zuback, T. Mukherjee, J. W. Elmer, J. O. Milewski, A. M. Beese, A. Wilson-Heid, A. De, and W. Zhang. 2018. “Additive Manufacturing of Metallic Components – Process,: Structure and Properties.” Progress in Materials Science 92: 112–224. doi:10.1016/j.pmatsci.2017.10.001.
- Du, Dafan, James C. Haley, Anping Dong, Da Shu Yves Fautrelle, Guoliang Zhu, Xi Li, Baode Sun, and Enrique J. Lavernia. 2019. “Influence of Static Magnetic Field on Microstructure and Mechanical Behavior of Selective Laser Melted Alsi10mg Alloy.” Materials & Design 181. doi:10.1016/j.matdes.2019.107923.
- Fang, Xuewei, Jiannan Yang, Shuaipeng Wang, Chuanbin Wang, Ke Huang, Haonan Li, and Bingheng Lu. 2022. “Additive Manufacturing of High Performance Az31 Magnesium Alloy with Full Equiaxed Grains: Microstructure, Mechanical Property, and Electromechanical Corrosion Performance.” Journal of Materials Processing Technology 300: 117430. doi:10.1016/j.jmatprotec.2021.117430.
- Fu, Wei, Pengfei Dang, Shengwu Guo, Zijun Ren, Daqing Fang, Xiangdong Ding, and Jun Sun. 2023. “Heterogeneous Fiberous Structured Mg-Zn-Zr Alloy with Superior Strength-Ductility Synergy.” Journal of Materials Science & Technology 134: 67–80. doi:10.1016/j.jmst.2022.06.021.
- Guo, Yangyang, Houhong Pan, Lingbao Ren, and Gaofeng Quan. 2019. “Microstructure and Mechanical Properties of Wire Arc Additively Manufactured Az80m Magnesium Alloy.” Materials Letters 247: 4–6. doi:10.1016/j.matlet.2019.03.063.
- Guo, Yangyang, Gaofeng Quan, Mert Celikin, Lingbao Ren, Yuhang Zhan, Lingling Fan, and Houhong Pan. 2022. “Effect of Heat Treatment on the Microstructure and Mechanical Properties of Az80m Magnesium Alloy Fabricated by Wire Arc Additive Manufacturing.” Journal of Magnesium and Alloys 10 (7): 1930–1940. doi:10.1016/j.jma.2021.04.006.
- Guo, Yangyang, Gaofeng Quan, Yinglong Jiang, Lingbao Ren, Lingling Fan, and Houhong Pan. 2021. “Formability, Microstructure Evolution and Mechanical Properties of Wire Arc Additively Manufactured Az80m Magnesium Alloy Using Gas Tungsten Arc Welding.” Journal of Magnesium and Alloys 9 (1): 192–201. doi:10.1016/j.jma.2020.01.003.
- Hao, Hai, Xiaoteng Liu, Canfeng Fang, and Xingguo Zhang. 2017. “Effect of in-Situ Al 2 Y Particles on the as-Cast/as-Rolled Microstructure and Mechanical Properties of Az31 Alloy.” Materials Science and Engineering: A 698: 27–35. doi:10.1016/j.msea.2017.04.114.
- Huang, Ke, Knut Marthinsen, Qinglong Zhao, and Roland E. Logé. 2018. “The Double-Edge Effect of Second-Phase Particles on the Recrystallization Behaviour and Associated Mechanical Properties of Metallic Materials.” Progress in Materials Science 92: 284–359. doi:10.1016/j.pmatsci.2017.10.004.
- Jin, Zhong-Zheng, Min Zha, Si-Qing Wang, Shi-Chao Wang, Cheng Wang, Hai-Long Jia, and Hui-Yuan Wang. 2022. “Alloying Design and Microstructural Control Strategies Towards Developing Mg Alloys with Enhanced Ductility.” Journal of Magnesium and Alloys 10 (5): 1191–1206. doi:10.1016/j.jma.2022.04.002.
- Jing, Chenchen, Zhuo Chen, Bin Liu, Tianqiu Xu, Jie Wang, Tao Lu, Jiping Lu, Yueling Guo, and Changmeng Liu. 2022. “Improving Mechanical Strength and Isotropy for Wire-Arc Additive Manufactured 304l Stainless Steels Via Controlling Arc Heat Input.” Materials Science and Engineering: A 845. doi:10.1016/j.msea.2022.143223.
- Kang, Wei, Liwei Lu, Longbiao Feng, Fengchi Lu, Chunlei Gan, and Xiaohui Li. 2021. “Effects of Pre-Aging on Microstructure Evolution and Deformation Mechanisms of Hot Extruded Mg–6Zn–1Gd–1Er Mg Alloys.” Journal of Magnesium and Alloys. doi:10.1016/j.jma.2021.05.019.
- Karthik, G. M., Eun Seong Kim, Alireza Zargaran, Praveen Sathiyamoorthi, Sang Guk Jeong, and Hyoung Seop Kim. 2022. “Role of Cellular Structure on Deformation Twinning and Hetero-Deformation Induced Strengthening of Laser Powder-Bed Fusion Processed Cusn Alloy.” Additive Manufacturing 54. doi:10.1016/j.addma.2022.102744.
- Kim, Young Min, Chang Dong Yim, and Bong Sun You. 2007. “Grain Refining Mechanism in Mg–Al Base Alloys with Carbon Addition.” Scripta Materialia 57 (8): 691–694. doi:10.1016/j.scriptamat.2007.06.044.
- Laser, T., M. R. Nürnberg, A. Janz, Ch Hartig, D. Letzig, R. Schmid-Fetzer, and R. Bormann. 2006. “The Influence of Manganese on the Microstructure and Mechanical Properties of Az31 Gravity Die Cast Alloys.” Acta Materialia 54 (11): 3033–3041. doi:10.1016/j.actamat.2006.02.039.
- Li, Jikang, Tan Cheng, Yanbing Liu, Yuanqi Yang, Wei Li, and Qingsong Wei. 2022. “Simultaneously Enhanced Strength and Ductility of Cu-15ni-8sn Alloy with Periodic Heterogeneous Microstructures Fabricated by Laser Powder Bed Fusion.” Additive Manufacturing 54. doi:10.1016/j.addma.2022.102726.
- Li, Xinzhi, Xuewei Fang, Shuaipeng Wang, Siqing Wang, Min Zha, and Ke Huang. 2022. “Selective Laser Melted Az91d Magnesium Alloy with Superior Balance of Strength and Ductility.” Journal of Magnesium and Alloys. doi:10.1016/j.jma.2022.06.004.
- Li, H. G., Y. J. Huang, W. J. Zhao, T. Chen, J. F. Sun, D. Q. Wei, Q. Du, et al. 2022. “Overcoming the Strength-Ductility Trade-Off in an Additively Manufactured Cocrfemnni High Entropy Alloy Via Deep Cryogenic Treatment.” Additive Manufacturing 50. doi:10.1016/j.addma.2021.102546.
- Li, S., J. Y. Li, Z. W. Jiang, Y. Cheng, Y. Z. Li, S. Tang, J. Z. Leng, et al. 2022. “Controlling the Columnar-to-Equiaxed Transition During Directed Energy Deposition of Inconel 625.” Additive Manufacturing 57. doi:10.1016/j.addma.2022.102958.
- Li, Qiuge, Guichuan Li, Xin Lin, Daiman Zhu, Jinhang Jiang, Shuoqing Shi, Fenggang Liu, Weidong Huang, and Kim Vanmeensel. 2022. “Development of a High Strength Zr/Sc/Hf-Modified Al-Mn-Mg Alloy Using Laser Powder Bed Fusion: Design of a Heterogeneous Microstructure Incorporating Synergistic Multiple Strengthening Mechanisms.” Additive Manufacturing 57. doi:10.1016/j.addma.2022.102967.
- Li, Lianhui, Wenhong Liu, Fugang Qi, Di Wu, and Zhiqiang Zhang. 2022. “Effects of Deformation Twins on Microstructure Evolution, Mechanical Properties and Corrosion Behaviors in Magnesium Alloys – a Review.” Journal of Magnesium and Alloys 10 (9): 2334–2353. doi:10.1016/j.jma.2022.09.003.
- Li, Ruixuan, Gerhard Wilde, and Yong Zhang. 2021. “Synergizing Mechanical Properties and Damping Capacities in a Lightweight Al-Zn-Li-Mg-Cu Alloy.” Journal of Alloys and Compounds 886. doi:10.1016/j.jallcom.2021.161285.
- Liu, HongBin, NingNing Gong, Lei Pang, and XingGuo Zhang. 2008. “Microstructure and Mechanical Properties of as-Cast Az31 with the Addition of Sb.” Materials Science and Engineering: A 497 (1–2): 254–259. doi:10.1016/j.msea.2008.07.010.
- Liu, Pengwei, Zhuo Wang, Yaohong Xiao, Mark F. Horstemeyer, Xiangyang Cui, and Lei Chen. 2019. “Insight into the Mechanisms of Columnar to Equiaxed Grain Transition During Metallic Additive Manufacturing.” Additive Manufacturing 26: 22–29. doi:10.1016/j.addma.2018.12.019.
- Liu, Zhiyuan, Dandan Zhao, Pei Wang, Ming Yan, Can Yang, Zhangwei Chen, Jian Lu, and Zhaoping Lu. 2022. “Additive Manufacturing of Metals: Microstructure Evolution and Multistage Control.” Journal of Materials Science & Technology 100: 224–236. doi:10.1016/j.jmst.2021.06.011.
- Lu, Tiwen, Ning Yao, Hongyu Chen, Binhan Sun, XiYu Chen, Sergio Scudino, Konrad Kosiba, and Xiancheng Zhang. 2022. “Exceptional Strength-Ductility Combination of Additively Manufactured High-Entropy Alloy Matrix Composites Reinforced with Tic Nanoparticles at Room and Cryogenic Temperatures.” Additive Manufacturing 56. doi:10.1016/j.addma.2022.102918.
- McLean, N., M. J. Bermingham, P. Colegrove, A. Sales, N. Soro, C. H. Ng, and M. S. Dargusch. 2022. “Effect of Hot Isostatic Pressing and Heat Treatments on Porosity of Wire Arc Additive Manufactured Al 2319.” Journal of Materials Processing Technology 310. doi:10.1016/j.jmatprotec.2022.117769.
- Pan, Fusheng, Zhongxue Feng, Xiyan Zhang, and Aitao Tang. 2012. “The Types and Distribution Characterization of Al-Mn Phases in the Az61 Magnesium Alloy.” Procedia Engineering 27: 833–839. doi:10.1016/j.proeng.2011.12.528.
- Peng, Peng, Bo Wang, Shibo Zhou, Jia She, Aitao Tang, Jianyue Zhang, and Fusheng Pan. 2022. “Effects of Optimizing Continuous Forging Extrusion Process on the Microstructure and Mechanical Properties of Az31 Magnesium Alloy.” Materials Science and Engineering: A 840. doi:10.1016/j.msea.2022.142892.
- Pollock, Tresa M. 2010. “Weight Loss with Magnesium Alloys.” Science 328 (5981): 986–987. doi:10.1126/science.1182848.
- Prasad, Arvind, Lang Yuan, Peter Lee, Mitesh Patel, Dong Qiu, Mark Easton, and David StJohn. 2020. “Towards Understanding Grain Nucleation Under Additive Manufacturing Solidification Conditions.” Acta Materialia 195: 392–403. doi:10.1016/j.actamat.2020.05.012.
- Proust, Gwénaëlle. 2019. “Processing Magnesium at Room Temperature.” Science 365 (6448): 30–31. doi:10.1126/science.aax9732.
- Rathinasuriyan, C., A. Mystica, R. Sankar, and V. S. Senthil Kumar. 2021. “Experimental Investigation of Cooling Medium on Submerged Friction Stir Processed Az31 Magnesium Alloy.” Materials Today: Proceedings 46: 3386–3391. doi:10.1016/j.matpr.2020.11.575.
- Song, Boxue, Tianbiao Yu, Xingyu Jiang, Wenchao Xi, Xiaoli Lin, Zhelun Ma, and Zhao Wang. 2022. “Development of the Molten Pool and Solidification Characterization in Single Bead Multilayer Direct Energy Deposition.” Additive Manufacturing 49. doi:10.1016/j.addma.2021.102479.
- Takagi, Hisataka, Hiroyuki Sasahara, Takeyuki Abe, Hiroki Sannomiya, Shinichiro Nishiyama, Shuichiro Ohta, and Kunimitsu Nakamura. 2018. “Material-Property Evaluation of Magnesium Alloys Fabricated Using Wire-and-Arc-Based Additive Manufacturing.” Additive Manufacturing 24: 498–507. doi:10.1016/j.addma.2018.10.026.
- Tammas-Williams, S., P. J. Withers, I. Todd, and P. B. Prangnell. 2016. “Porosity Regrowth During Heat Treatment of Hot Isostatically Pressed Additively Manufactured Titanium Components.” Scripta Materialia 122: 72–76. doi:10.1016/j.scriptamat.2016.05.002.
- Toda-Caraballo, Isaac, Enrique I. Galindo-Nava, and Pedro E. J. Rivera-Díaz-del-Castillo. 2014. “Understanding the Factors Influencing Yield Strength on Mg Alloys.” Acta Materialia 75: 287–296. doi:10.1016/j.actamat.2014.04.064.
- Todaro, C. J., M. A. Easton, D. Qiu, D. Zhang, M. J. Bermingham, E. W. Lui, M. Brandt, D. H. StJohn, and M. Qian. 2020. “Grain Structure Control During Metal 3D Printing by High-Intensity Ultrasound.” Nature Communications 11 (1): 142. doi:10.1038/s41467-019-13874-z.
- Wang, Zihong, Xin Lin, Nan Kang, Jing Chen, Hua Tan, Zhe Feng, Zehao Qin, Haiou Yang, and Weidong Huang. 2021. “Laser Powder Bed Fusion of High-Strength Sc/Zr-Modified Al–Mg Alloy: Phase Selection, Microstructural/Mechanical Heterogeneity, and Tensile Deformation Behavior.” Journal of Materials Science & Technology 95: 40–56. doi:10.1016/j.jmst.2021.03.069.
- Wang, Zhentao, Shanglei Yang, Zeng Peng, and Zihao Gao. 2022. “Effect of Defects in Laser Selective Melting of Ti-6al-4v Alloy on Microstructure and Mechanical Properties After Heat Treatment.” Optics & Laser Technology 156. doi:10.1016/j.optlastec.2022.108522.
- Wang, Tong, Min Zha, Chunfeng Du, Hai-Long Jia, Cheng Wang, Kai Guan, Yipeng Gao, and Hui-Yuan Wang. 2022. “High Strength and High Ductility Achieved in a Heterogeneous Lamella-Structured Magnesium Alloy.” Materials Research Letters 11 (3): 187–195. doi:10.1080/21663831.2022.2133976.
- Wang, Peng, Hanzheng Zhang, Hao Zhu, Qingzhuang Li, and Mengnan Feng. 2021. “Wire-Arc Additive Manufacturing of Az31 Magnesium Alloy Fabricated by Cold Metal Transfer Heat Source: Processing, Microstructure, and Mechanical Behavior.” Journal of Materials Processing Technology 288. doi:10.1016/j.jmatprotec.2020.116895.
- WebWISER. 2022. Accessed October 13, 2022. https://webwiser.nlm.nih.gov/webwiser/knownsubstancesearch.
- Wei, Kaiwen, Ming Gao, Zemin Wang, and Xiaoyan Zeng. 2014. “Effect of Energy Input on Formability, Microstructure and Mechanical Properties of Selective Laser Melted Az91d Magnesium Alloy.” Materials Science and Engineering: A 611: 212–222. doi:10.1016/j.msea.2014.05.092.
- Wei, Kaiwen, Zemin Wang, and Xiaoyan Zeng. 2015. “Influence of Element Vaporization on Formability, Composition, Microstructure, and Mechanical Performance of the Selective Laser Melted Mg–Zn–Zr Components.” Materials Letters 156: 187–190. doi:10.1016/j.matlet.2015.05.074.
- Williamson, G. K., and W. H. Hall. 1953. “X-Ray Line Broadening from Filed Aluminium and Wolfram.” Acta Metallurgica 1 (1): 22–31. doi:10.1016/0001-6160(53)90006-6.
- Wu, Yaowen, Xinyi Zhao, Qiang Chen, Can Yang, Mingguang Jiang, Changyong Liu, Zhe Jia, Zhangwei Chen, Tao Yang, and Zhiyuan Liu. 2022. “Strengthening and Fracture Mechanisms of a Precipitation Hardening High-Entropy Alloy Fabricated by Selective Laser Melting.” Virtual and Physical Prototyping 17 (3): 451–467. doi:10.1080/17452759.2022.2037055.
- Xi, Naiyuan, Kexin Tang, Xuewei Fang, Yan Li, Yusong Duan, and Ke Huang. 2023. “Enhanced Comprehensive Properties of Directed Energy Deposited Inconel 718 by a Novel Integrated Deposition Strategy.” Journal of Materials Science & Technology 141: 42–55. doi:10.1016/j.jmst.2022.09.026.
- Xian, J. W., L. Peng, G. Zeng, D. Wang, and C. M. Gourlay. 2021. “Al11mn4 Formation on Al8mn5 During the Solidification and Heat Treatment of Az-Series Magnesium Alloys.” Materialia 19. doi:10.1016/j.mtla.2021.101192.
- Xu, Nan, and Yefeng Bao. 2016. “Enhanced Mechanical Properties of Tungsten Inert Gas Welded Az31 Magnesium Alloy Joint Using Two-Pass Friction Stir Processing with Rapid Cooling.” Materials Science and Engineering: A 655: 292–299. doi:10.1016/j.msea.2016.01.009.
- Yang, Xu, Jianrui Liu, Zhennan Wang, Xin Lin, Fencheng Liu, Weidong Huang, and Enquan Liang. 2020. “Microstructure and Mechanical Properties of Wire and Arc Additive Manufactured Az31 Magnesium Alloy Using Cold Metal Transfer Process.” Materials Science and Engineering: A 774. doi:10.1016/j.msea.2020.138942.
- Yang, Yan, Xiao Ming Xiong, Jing Chen, Xiao Dong Peng, Dao Lun Chen, and Fu Sheng Pan. 2021. “Research Advances in Magnesium and Magnesium Alloys Worldwide in 2020.” Journal of Magnesium and Alloys 9 (3): 705–747. doi:10.1016/j.jma.2021.04.001.
- Yi, Hao, Qiao Wang, and Huajun Cao. 2022. “Wire-Arc Directed Energy Deposition of Magnesium Alloys: Microstructure, Properties and Quality Optimization Strategies.” Journal of Materials Research and Technology 20: 627–649. doi:10.1016/j.jmrt.2022.07.083.
- Ying, Tao, Zhixian Zhao, Pengfei Yan, Jingya Wang, and Xiaoqin Zeng. 2022. “Effect of Fabrication Parameters on the Microstructure and Mechanical Properties of Wire Arc Additive Manufactured Az61 Alloy.” Materials Letters 307. doi:10.1016/j.matlet.2021.131014.
- Yuan, Tao, Sindo Kou, and Zhen Luo. 2016. “Grain Refining by Ultrasonic Stirring of the Weld Pool.” Acta Materialia 106: 144–154. doi:10.1016/j.actamat.2016.01.016.
- Zhang, W., Q. Wei, W. T. Huo, J. W. Lu, J. J. Hu, and Y. S. Zhang. 2017. “Dynamic Recrystallization in Nanocrystalline Az31 Mg-Alloy.” Vacuum 143: 236–240. doi:10.1016/j.vacuum.2017.06.023.
- Zhao, Ruixin, Chaoyue Chen, Sansan Shuai, Tao Hu, Yves Fautrelle, Hanlin Liao, Jian Lu, Jiang Wang, and Zhongming Ren. 2022. “Enhanced Mechanical Properties of Ti6al4v Alloy Fabricated by Laser Additive Manufacturing Under Static Magnetic Field.” Materials Research Letters 10 (8): 530–538. doi:10.1080/21663831.2022.2064195.
- Zhao, Hu, Peijie Li, and Liangju He. 2012. “Microstructure and Mechanical Properties of an Asymmetric Twin-Roll Cast Az31 Magnesium Alloy Strip.” Journal of Materials Processing Technology 212 (8): 1670–1675. doi:10.1016/j.jmatprotec.2012.03.011.
- Zhou, Xiong, Qichi Le, Liang Ren, Chenglu Hu, Tong Wang, Qiyu Liao, Dandan Li, Xiaoqiang Li, and Chunming Liu. 2022. “High-Performance Magnesium Alloy with Multi-Element Synergistic Strengthening: Design, Microstructure, and Tensile Properties.” Journal of Alloys and Compounds 918: 165746. doi:10.1016/j.jallcom.2022.165746.
- Zhou, Yinghui, Xin Lin, Nan Kang, Yao Tang, Weidong Huang, and Zhennan Wang. 2022. “The Heterogeneous Band Microstructure and Mechanical Performance in a Wire + Arc Additively Manufactured 2219 Al Alloy.” Additive Manufacturing 49: 102486. doi:10.1016/j.addma.2021.102486.