
 ?Mathematical formulae have been encoded as MathML and are displayed in this HTML version using MathJax in order to improve their display. Uncheck the box to turn MathJax off. This feature requires Javascript. Click on a formula to zoom.
ABSTRACT
Experiments on Laser powder bed fusion (LPBF) of powdered Ti on Al2O3 substrate were conducted and the interface formation was studied using a multi-material fluid dynamics model. Results show that the melt pool is relatively shallow, with relatively flat interlayer interface under LPBF’s conduction mode. In this condition, a thin sheath of molten Al2O3 forms and acts as a lubricating film for the molten Ti, leading to Rayleigh instability due to high flow inertia. Keyhole formation penetrates the Al2O3 substrate, resulting in a wavy interlayer interface. The recoil pressure from the keyhole and overall melt inertia are suppressed by the highly viscous molten Al2O3, thereby improving single-track melt pool stability. However, the thermal expansion coefficient difference between Ti and Al2O3 led to the formation of transverse cracks. Achieving a defect-free metal-on-ceramic single track remains a challenge, despite this study serving as a guide for melt track and interface control.
1. Introduction
Joining metal to ceramic, or vice versa, allows benefits from those different classes of materials with distinct mechanical and functional properties to be leveraged (Exner et al. Citation2008; Lu et al. Citation2019; Zhang et al. Citation2017). Ceramics, in general, have high hardness, wear, and corrosion resistance, as well as superior biocompatibility. On the other hand, metals are good conductors of heat and electricity, possess superior toughness, and can deform plastically. Layers of oxide-ceramics can be applied on metallic components as coatings, to function as thermal barriers, electrical insulators, wear-resistant layers, and biocompatible interfaces, etc. (Gai et al. Citation2017; Wei and Li Citation2021; Wang et al. Citation2022b). However, the metal/ceramic interface bonding can be compromised by the development of residual stresses due to their differences in thermo-mechanical properties (Jianxin, Zhenxing, and Dongling Citation2010; Kliauga and Ferrante Citation2000; Pelz et al. Citation2021), and/or the formation of brittle compounds at the interface (Fan, Lu, and Huang Citation2018; Nguyen et al. Citation2017; Rajabi, Ghazali M, and Daud A Citation2015). To circumvent these problems, vast variety of joining techniques were developed, with each forming its own unique interface characteristic. In the recent past, laser powder bed fusion (LPBF) has emerged as an important technique for additive manufacturing of metallic alloys (Huang et al. Citation2021; Citation2022; Kumar and Ramamurty Citation2019; Radhakrishnan et al. Citation2022a; Citation2022b; Wei, Hutchinson, and Ramamurty Citation2023; Wei et al. Citation2022b). Given the unique thermal history and melt pool geometry associated with it, a unique opportunity is presented to control the metal/ceramic interface morphology, in addition to the possibility to achieve freeform fabrication of metal/ceramic components (Aramian et al. Citation2020; Koopmann, Voigt, and Niendorf Citation2019; Tan et al. Citation2021).
Nevertheless, joining metal and ceramic via laser additive manufacturing is challenging (Gheisari et al. Citation2020; Li et al. Citation2020), as it involves the melting of the two distinct materials and requires the consideration of their differences in thermal/mechanical properties and mutual wettability (Cui et al. Citation2021; Wang et al. Citation2020). One of the studies involves the LPBF of the Cu90Sn10 (bronze) powder on Al2O3 substrate, which investigates the influence of laser power, scan speed, and scan strategy on the bronze’s current carrying capability and the metal/ceramic interface characteristic (Syed-Khaja and Franke Citation2016). However, the interface is highly porous and does not constitute a reliable build. Koopmann et al. found that re-melting of ZrO2-Al2O3 ceramic on a tool steel substrate using relatively high laser power (∼422 W) helps in improving the metal/ceramic bonding and achieving an interlocked sawtooth interface (Koopmann, Voigt, and Niendorf Citation2019). Mishra found that a low input laser power of ∼225 W will lead to the peeling off of a Al2O3 single track from the Ti6Al4V substrate, while sufficient laser input power of ∼300 W will resolve the issue (Mishra et al. Citation2021). Using the directed energy deposition approach, Zhang et al. managed to build a bulk Ti/Al2O3 component with graded interface (Zhang and Bandyopadhyay Citation2018). Wang et al. successfully designed and constructed laminated TiB2/Ti6Al4V structure using LPBF (Wang et al. Citation2022a). As crack propagation occurred across the layered structure, crack deflection and branching were observed, which is beneficial in reducing the crack driving force. The benefits of TiB2 in inducing crack deflection have also been reported in non-additively manufactured TMCs (Li et al. Citation2023; Sen et al. Citation2007; Singh and Ramamurty Citation2020). Additionally, the thermal conduction characteristics of LPBF fabricated Ti6Al4V/(TiB2 + Ti6Al4V) laminations were found to be strongly influenced by the mesostructure characteristic and TiB2 grain size (Wang et al. Citation2023). Furthermore, Wu et al. focused on the fabrication of Al2O3-ZrO2 functionally graded ceramics using directed energy deposition (Wu et al. Citation2022). By incorporating transition layers with gradual changes in composition, cracking along and perpendicular to the interface between Al2O3-ZrO2 can be eliminated. Despite these notable findings, research on metal/ceramic multi-materials remains limited, leaving a substantial knowledge gap that needs to be addressed before additive manufacturing technology can be reliably used to manufacture metal/ceramic components with the desired structural integrity and reliability.
To understand the LPBF process from a fundamental viewpoint, simulations of physical phenomena such as melting and solidification, evaporation and condensation, and multiphase flow that occurs during LPBF had been performed with computational fluid dynamics (CFD) models (Chen et al. Citation2021; Gu et al. Citation2017; Khairallah et al. Citation2020). Single-track simulations of dissimilar alloys under the LPBF process conditions were performed by Gu et al. and Sun et al. to investigate the melt flow associated with SS316L/Cu10Sn and IN718/Cu10Sn systems, respectively (Gu et al. Citation2020; Sun, Chueh, and Li Citation2020). It was found that the mixing of two dissimilar alloys is predominantly induced by the convective melt flow. Our previous work closely examined the single track formation during the LPBF of SS316L/ IN718 alloy under keyhole melting mode, and found that the dissimilar material interface can be optimised to achieve staggered and interlocked shape (Yao et al. Citation2021). Tang et al. then established a proprietary dissimilar-alloy single-track model by implementing diffusion, enabling high level of accuracy for the melt pool description (Tang, Yao, and Du Citation2022).
While the amount of simulation works on dissimilar alloys single track is sparse, studies involving the melting of metal on ceramic in the melt pool of LPBF was not performed hitherto. Hence, a multi-physics model is developed to simulate the melt flow behaviour associated with the laser melting of powdered Ti on a ceramic (Al2O3), with the aim of developing a detailed understanding of the evolution of dissimilar interface morphology and pinpoint the challenges associated with the metal-on-ceramic printing.
2. Simulation and experimental testing procedure
2.1 Multi-material melt pool modelling
A multi-physics model was employed in this study to accurately capture the thermal/microfluidic interactions between the ambient gases (argon gas), the Ti metal, and the Al2O3 ceramic by combining micron-scale fluid dynamics with nanosecond-level thermal diffusion processes. To simplify the model, the following features were implemented:
The fluid was assumed to be Newtonian and incompressible with laminar flow.
The study utilised the enthalpy-porosity technique developed by Voller, Brent, and Prakash (Citation1989) to simulate the molten Ti/Al2O3 and solidification process.
Loss of mass caused by the vaporisation of Ti and Al2O3 was not included in the model. Homogeneous and isotropic properties were assumed for all the phases.
The model did not take chemical diffusion into account (if any), which is reasonable given the lack of interdiffusion between molten Ti and Al2O3 (Hu, Luo, and Huang Citation2021). Therefore, the effect of intermetallic formation on the fluid dynamics is neglected, given their negligible volume (if formed) compared to the melt pool volume.
The effects of small disturbances (e.g. dispersion fluxes, supercooling of the liquid) in the fields were neglected (Voller, Brent, and Prakash Citation1989).
The method of constituent weighted average was used to estimate the thermophysical parameters of the interface cells.
The laser absorption coefficient in this study was obtained through a thorough literature review. The influence of powder shape and the phenomena of multiple laser reflections was not considered. Nevertheless, a good agreement with experimental observation was obtained, signifying a good approximation of the laser absorption coefficient within the range of modelled parameters.
The mass, momentum and energy conservation equations are respectively expressed as:
(1)
(1)
(2)
(2)
(3)
(3) where
is the volume average density,
is the flow velocity, P is the fluid pressure,
is the gravitational acceleration, μ is the fluid viscosity,
is the momentum sink term used to account for the pressure drop resulting from the solidification of the molten alloy within the liquid–solid mushy zone,
is the surface tension force,
is the Marangoni force,
is the recoil pressure,
is the specific heat capacity, Hm is the latent heat of melting, k is the thermal conductivity, qv is the heat loss caused by the vaporisation of the alloy, qrad is the radiation heat released into the ambient environment, and qL is a simplified ray-trace Gaussian heat source (Gu et al. Citation2020; Sun, Chueh, and Li Citation2020).
The calculations of and
were based on:
(4)
(4)
(5)
(5) where σ is the surface tension coefficient,
is the temperature coefficient of surface tension,
is the unit normal vector of the interface, κ is the curvature of the interface, and
is the volume fraction of the corresponding component in the interfacial cell of the alloy. The subscript i can take the values of either one or two to indicate the powder and substrate, respectively. |∇
| was used to convert the interfacial force into a volumetric force, while
was employed to redistribute the interfacial force towards the heavier phase, which is the alloy phase. As the Marangoni force is incorporated in the model, estimated values of the Marangoni number,
, are provided in some of the single-track analyses. Here,
is the thermal diffusivity of the alloy,
is the characteristic length of the melt pool (taken as the width of the melt pool), and ΔT represents the temperature difference between the maximum temperature inside the pool and the solidus temperature of the alloy.
The energy transfer across the interface and the interface force were accounted for using interface cells (Paradis, Ishikawa, and Yoda Citation2002; Rhee Citation1972). To capture the interfaces between gas/powder, gas/substrate, and powder/substrate, the volume of fluid (VOF) method was employed (Tang, Yao, and Du Citation2022). The interface cell was defined with volume fractions (α) of different phases, which should satisfy the following relationship:
(6)
(6) where the subscripts ‘g’, ‘p’ and ‘s’ refer to argon gas, Ti powder, and Al2O3 substrate, respectively. The properties of the interface cell (
) were suitably estimated based on the weighted average values from the constituents:
(7)
(7)
For instance, the solidus and liquidus temperature of the Ti/Al2O3 interface cells can be respectively calculated as and
, based on Equation (7). One exception to this is the estimation of interface cell surface tension (
), which is based on the values of the Ti/air (
) and the Al2O3/air (
) interfacial surface tensions. The variation of
and
with
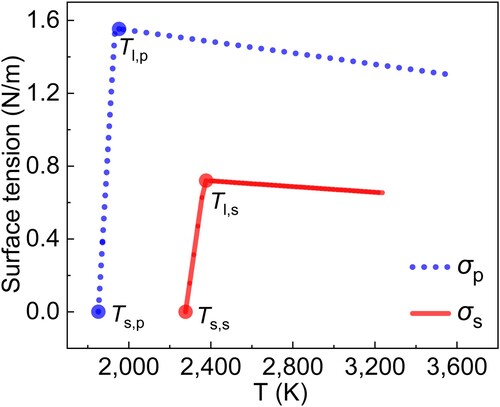
were derived from past studies and respectively listed in Equations (8) and (9) (Brillo et al. Citation2019).
(8)
(8)
(9)
(9) where
,
and
are the solidus temperature, liquidus temperature and surface tension, respectively, of the interface cells.
and
are the surface tensions of Ti and Al2O3, respectively.
It should be noted that the prior studies only provide information for
≥
(Amore et al. Citation2011; Ye et al. Citation2021), hence necessitating the deduction for those with
<
. Logically speaking, the
value corresponding to
and
should be respectively nil and maximum. Therefore, first-order approximations were performed accordingly for
values between
and
, and were included in Equations (8) and (9). The resulting variations of
and
with
are illustrated in . Based on the constituent weighted average of the interfacial cell,
can be resolved for different
.
Figure 1. Variation of Ti/air () and Al2O3/air (
) interfacial surface tension with temperature.
Furthermore, the temperature-dependent variable, , was proposed to define the liquid fraction of a cell. This enabled the estimation of properties in the mushy zone using the following equation:
(10)
(10) where
,
,
and
are the properties of the solid Ti powder, molten Ti powder, solid Al2O3 substrate, and molten Al2O3 substrate, respectively. The subscript j can be replaced by p, s, and m to respectively represent the powder, substrate, and Ti/Al2O3 interface cell. Further details of Equation (10) can be found in (Yao et al. Citation2021).
While the model described in this section has primarily been employed in a previous study focused on metal-on-metal interfaces (Yao et al. Citation2021), its adaptation for metal-ceramic interfaces is justified due to the lower interdiffusion between ceramics and metals, given the stronger metal–oxygen bonds compared to metal–metal bonds. The consideration of diffusion is a main complication in multi-material simulations. However, the absence of diffusion consideration in the previous study, which still yielded good agreement with experimental results, suggests its applicability for studying metal-ceramic interfaces.
Single-track simulations were conducted using the ANSYS FLUENT computational fluid dynamics software, considering various combinations of laser power (L) and laser scan velocity (V). To enable multi-material LPBF simulation, a user-defined function was compiled to incorporate the necessary source items. Upon mesh convergence procedure, the grid size and maximum time step were set as 1.6 × 10⁻⁶ m and 1.4 × 10⁻⁷ s, respectively. The thermophysical properties of Ti and Al2O3 used are listed in .
Table 1. The thermophysical properties of Ti and Al2O3.
64 single-track simulations were conducted to cover a sufficiently wide process parameter window. Each simulation had unique laser power and velocity combinations, with the power ranging from 50 to 400 W, with intervals of 50 W, and the velocity varied from 200 to 1,600 mm/s, with intervals of 200 mm/s. 12 LPBF single tracks were fabricated for experimental validation. The parameter combinations used were as follows: for 100 W power, the velocity range was from 200 mm/s to 800 mm/s, with intervals of 200 mm/s. For 250 W power, the velocity range was from 400 mm/s to 1,000 mm/s, with intervals of 200 mm/s. Lastly, for 400 W power, the velocity range was from 400 mm/s to 1,600 mm/s, with intervals of 400 mm/s.
2.2 Materials and experiments
Metal-on-ceramic single tracks were fabricated using a commercially available LPBF machine (SLM 280 HL, SLM Solutions Group AG), equipped with fibre lasers of the following specifications: (1) 80 μm focus diameter, (2) 400 W maximum laser power, (3) 1,064 nm wavelength, and (4) Gaussian beam profile. The powder re-coater blade was moved 50 μm above the Al2O3 substrate prior to an even spreading of Ti powder with particle size distribution range of 20–45 μm. To minimise oxidation and contamination during the laser scan, the build chamber was purged with high purity argon gas to achieve < 500 ppm oxygen level in the chamber. Thereafter, single-track laser scans were performed to fuse the Ti onto the Al2O3 substrate. The laser power (L) and scan velocity (V) of the experiment are the same as the simulation.
The surface morphology of the fabricated single tracks was characterised with laser confocal microscopy for the validation of simulated results. Thereafter, the single-track cross-sections were examined by sectioning them using a diamond blade. A Grit #320 SiC-paper was used to grind the cross-sections, followed by fine grinding with MD-Largo (DiaPro Largo 9 μm suspension, Struers) to enable measurement of the melt pool width and depth.
3. Results and discussion
3.1. Model validation
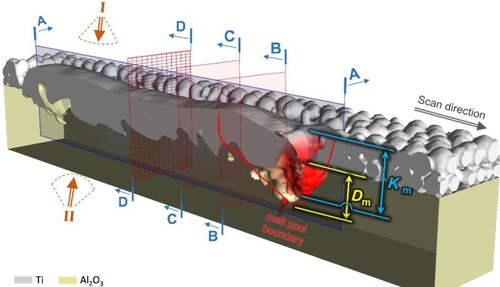
The movement and distribution of Ti and Al2O3 in space were analysed based on cross-sections A-A to D-D, as shown in . Among them, the cross-section A-A is parallel to the scan direction whereas the cross-sections B-B to D-D are perpendicular to the scan direction. Cross-section A-A cuts across the middle of the melt pool width, while cross-sections B-B to D-D are obtained at different locations along the scan direction. The melt pool depth, Dm, keyhole depth, Km, and melt pool width, Wm, are respectively defined as the distance from melt pool bottom to the top of the substrate layer, the distance from the keyhole bottom to the top of powder layer (∼50 µm thick), and the melt track width measured along the top of substrate layer. To facilitate visualisation, viewing angle I, which constitutes the plan view of the scan track, and viewing angle II, which is at an angle beneath the track, are utilised.
Figure 2. A schematic diagram of the cross-sections and viewing angles of the single track.
Single-track experiments were conducted to validate the simulated results, with Wm and Dm values measured and compared in , which shows a deviation of no more than 11.2%. The melt pool boundary of ceramic is not readily visible, hence most of the experimental Dm values were omitted. The simulation was further verified via observations on single-track surface topology. The plan view of single tracks built using 100 W laser power and 200–800 mm/s scan velocities are illustrated in , showing single-track evolution from stable [(a)] to discontinuous [(b)], and further to balling or lack-of-melting [(c) and (d)].
Figure 3. Simulation (left column) and experimental (right column) results of a single track surface shape formed after the solidification of Ti powder on Al2O3 substrate from viewing angle Ⅰ in with L = 100 W. (a) V = 200 mm/s, (b) V = 400 mm/s, (c) V = 600 mm/s, and (d) V = 800 mm/s.
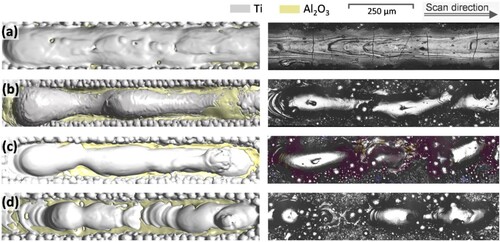
Table 2. Comparison of depth and width of the melt pool between simulation and experiment.
The metal blobs/balls observed adhered to the surface of the single tracks in can be attributed to two origins. Firstly, the recoil pressure causes liquid metal to splash as tiny droplets onto the solidified single-track surface, resulting in the formation of small metal particles (Khairallah et al. Citation2020). Secondly, the high-speed plume generated by the recoil pressure can cause metal powder to fly onto the unsolidified single-track surface, forming relatively larger and round particles (Cunningham et al. Citation2019). However, our simulation did not account for the second scenario as it did not include the physics of solid powder particle movement. While this omission may affect the accuracy of the fluid dynamics simulation, we observed that the general trend of the melt characteristics remained consistent with the experimental results, indicating that our simulated description of the flow trend of the melt pool and the interlayer interface shape is reasonably accurate.
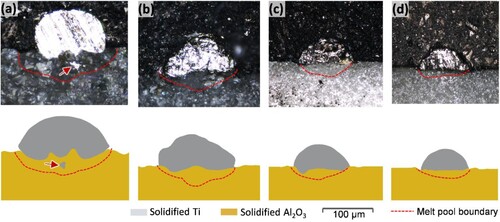
The interfacial morphology of simulated and experimentally fabricated Ti/Al2O3 single tracks are illustrated in . For brevity, the metal and ceramic interface will be referred to as the interlayer interface herein. At a constant laser power of 100 W, an increment of scanning velocity from 200 to 800 mm/s led to evolution of interlayer interface from an inverted ‘W’ [(b)] to a flat shape [(e)]. In fact, the ‘W’ interface increases the surface area for bonding and corresponds to the stable continuous melt pool as shown in (a). Despite the seemingly superior characteristic, the high coefficient of thermal expansion mismatch led to the formation of transverse cracks. The general tendency of metal-on-ceramic printing to ball and crack depicts the difficulty of the task at hand. Regardless, the simulation results are similar to the experimentally observed single-track characteristics for different laser parameters, hence validating the suitability of the numerical model in describing the fluid dynamics of Ti/Al2O3 laser scanning procedure []. One notable feature that strengthens the validation of the simulation with the experiment is the observation of Ti within the Al2O3 matrix, highlighted by the red arrow in (a), which is a result of the keyhole pushing the Ti into the substrate.
Figure 4. Experimental (top row) and simulation (bottom row) results of a single-track interlayer interface shape formed after the solidification of Ti powder on Al2O3 substrate from the cross-section B-B (see ) with L = 100 W. (a) V = 200 mm/s, (b) V = 400 mm/s, (c) V = 600 mm/s, and (d) V = 800 mm/s. The position of the red arrow in (a) shows the migration of Ti into the Al2O3 substrate.
3.2 Dependence of melt pool flow on temperature field
The metal-on-ceramic melt flow characteristic dictates the formation of interlayer interface morphology. Such characteristic is different from those observed in a metal melt pool, given the dissimilar thermofluidic behaviour of the two material types, with the ceramic possessing high viscosity and melting point. Hence, this section will highlight the salient features of a metal/ceramic melt pool. The different melt flow drivers will be discussed in conjunction with the temperature field information, The key takeaways should be applicable to metal/ceramic melt pool formed by other laser parameter combinations. For this purpose, a relatively complex keyhole mode melt pool (L = 250 W and V = 400 mm/s) is chosen due to its involvement of all dominant melt pool drivers, as seen in .
Figure 5. Representative simulation result showing (a) plan view of the single track, (b) the melt flow, (c) the temperature and temperature gradient distribution along the cross-section A-A obtained from the single track with L = 250 W and V = 400 mm/s. The data in (c) is taken from the data extraction line shown in (a) and (b). Colour shape code: melt velocity direction – green arrow; Ti isotherm (1,933 K) – red line; Al2O3 isotherm (2,369 K) – blue line; temperature and temperature gradient data extraction line – purple dotted line; molten Ti – light grey area; solidified Ti – dark grey area; molten Al2O3 – light yellow area; solidified Al2O3 – dark yellow area; marangoni force Fm – white arrow; surface tension Fs – yellow arrow; recoil pressure Fp – red arrow; + Δσ / ΔT – the melt to the left of the isotherm; – Δσ / ΔT – the melt to the right of the isotherm.
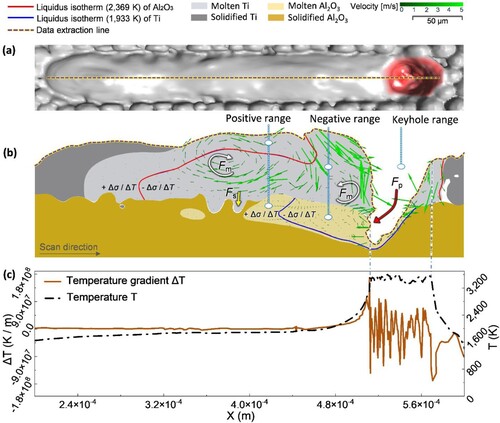
The surface temperature gradient induces the Marangoni flow from the low to the high surface tension region (Wei et al. Citation2022a). The melt flow characteristics are further influenced by the difference in the melting points of Ti and Al2O3, which is ∼381 K. As seen in (b), the metal-on-ceramic melt pool can be divided into three regions along the scanning direction, based on the melt pool's thermal history and the varying surface tension [(c)], namely the keyhole, negative (-dσ/dT) and positive (+dσ/dT) surface tension gradient regions. Change in the sign of surface tension gradient from negative to positive, or vice versa, is related to the liquidus point of the material, which is shown previously in .
In the keyhole region, the surface temperature ranges from 1,852 to 3,565 K, which is above the boiling point of Al2O3 ∼3,245 K and Ti ∼3,560 K. The vaporisation of material generates hydrostatic recoil pressure around the depth of keyhole, which pushes the melt in the direction opposite to the scan direction [(b)]. In a typical metallic melt pool, of single or multiple material composition with similar thermofluidic properties, the recoil pressure plays a major role in inducing surface flow away from the keyhole, towards the trailing edge of the melt pool (Yao et al. Citation2021). However, as the keyhole penetrates the Al2O3 substrate with high viscosity, that is twice as much as Ti, the momentum of ceramic flow is quickly dampened by the drag force. Therefore, there is a general lack of material flow away from the keyhole of a metal-on-ceramic melt pool, as compared to conventional metallic melt pool. Occasionally, Ti melt pool that protrudes into the keyhole will be pushed by the vapour pressure into the molten Al2O3 (shown in next section), perturbating the interlayer interface to form a wavy ‘W’ shape. The material evaporation in the keyhole region leads to intense but varying heat and mass transfer, resulting in large surface temperature and temperature gradient fluctuation [(c)].
The – dσ/dT region that is adjacent to the keyhole is made up of liquid Ti and Al2O3. Its temperature ranges between the liquidus (Ti ∼1,933 K, Al2O3 ∼2,369 K) and the boiling points (Ti ∼3,560 K, Al2O3 ∼3,245 K). For liquid Ti in this region, the surface tension increases as the surface temperature decreases with distance from the keyhole region. This results in a Marangoni-driven surface flow away from the laser-heated region. Hence, it induces a counterclockwise liquid swirl that is, however in this case, overshadowed by the substantial molten Ti flow from the + dσ/dT region. As explained previously, there is a lack of momentum transfer from the recoil pressure, which leads to an insufficient driving force for the counterclockwise swirl. Moreover, keyhole melting mode typically induces strong Marangoni convection in contrast to conduction melting mode in a metallic melt pool. However, the molten Al2O3 is too viscous to exhibit meaningful momentum transport in the – dσ/dT region.
The melt pool trailing edge constitute the + dσ/dT region, made up of Ti and Al2O3 in the mushy state, within the solidus (Ti ∼1,852 K, Al2O3 ∼2,277 K) and liquidus (Ti ∼1,933 K, Al2O3 ∼2,369 K) region. Here, the surface temperature and surface tension of Ti melt pool decreases with distance away from the heat source (keyhole region), resulting in Marangoni force that drives the liquid near the melt pool surface towards the direction of keyhole region, thereby inducing a clockwise swirl. Similar to the – dσ/dT region, the Al2O3 melt pool in + dσ/dT region exhibits negligible motion due to the substantial drag force.
It is worth noting that the temperature range of Ti in the – dσ/dT region (3,560 K–1,933 K = 1,627 K) is almost 20 times that of the + dσ/dT region (1,933 K–1,852 K = 81 K), but the – dσ/dT region occupies more than half of the melt pool area to form significant clockwise swirl. The consideration of mushy zone for fluid dynamics simulation is indispensable, as the dσ/dT in the mushy zone is two orders of magnitude higher than the liquid zone in absolute terms, for both Ti and Al2O3. The clockwise and counter-clockwise swirls lead to a net flow of Ti towards the interlayer interface, which also contributes to the irregular ‘W’ interlayer interface formation (aside from recoil pressure). To a lesser extent, the surface tension difference between molten Ti and Al2O3 disrupts the interlayer interface to induce waviness, analogous to the humping effect seen in a LPBF melt pool (Tang, Le, and Wong Citation2020).
Prior studies of the LPBF single tracks of Inconel 718 alloy on 316L stainless steel demonstrate the formation of dissimilar material interface with substantial interpenetration for mechanical interlocking (Yao et al. Citation2021). Such feat is, however, difficult to be achieved in the current context due to the properties of Al2O3, specifically its high viscosity and solidus temperature. The melt pool length of Al2O3 is significantly shorter than that of Ti, given the large difference in solidus temperature between the two, ∼381 K. The early solidification of Al2O3 results in a lesser opportunity for Ti to penetrate the substrate. Besides, the high viscosity of Al2O3 limited mass transport to and from the molten Ti. These reinforce the need to study the interlayer interface evolution and provide a roadmap for metal/ceramic interface optimisation.
3.3 The mechanism of interlayer interface formation in single track LPBF
The interlayer interface formation for Ti on Al2O3 single track depends on the complex interplay between the different melt pool driving forces. In general, interface perturbators include the recoil pressure, Marangoni force, and to a smaller extent, the surface tension. On the other hand, the viscous drag force of Al2O3 inhibits mass transfer between the dissimilar materials. Based on the flow kinetics observed in the simulations, we found that the interlayer interface shape is highly dependent on the Km value. When Km exceeds the powder layer thickness, ∼ 50 μm, the interlayer interface undergoes significant changes. Its evolution is illustrated through melt pools with Km = 0 μm, Km = 50 μm, and Km = 100 μm, respectively shown in .
Figure 6. Representative simulation result showing the flow characteristics within the melt pool in the single track (L = 100 W, V = 800 mm/s and Ma = 1,314). (a) is taken from the cross-section A-A, and (b), (c), and (d) are respectively taken from the cross-sections B-B, C-C, and D-D, illustrated in . (b), (c), and (d) show the melt pool results taken from the position of the double arrow illustrated in (a).
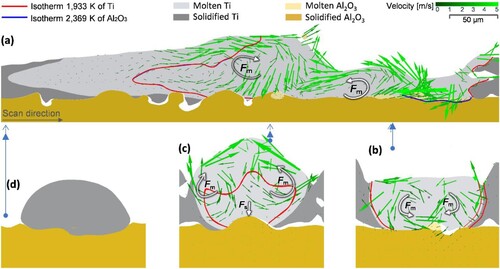
Figure 7. Interlayer interface shape and surface shape after solidification of a single track (L = 100 W, V = 800 mm/s and Ma = 1,314). (a) is taken from the cross-section A-A in (b) and (c) are observations from viewing angle II and viewing angle Ⅰ, respectively.
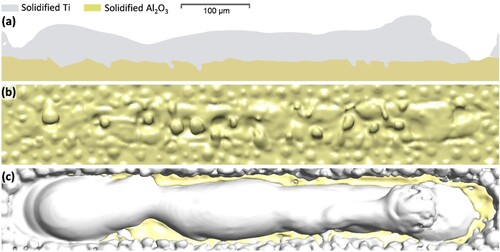
Figure 8. Representative simulation result showing the flow characteristics within the melt pool in the single track (L = 100 W, V = 400 mm/s and Ma = 1,913). (a) is taken from the cross-section A-A, and (b), (c), and (d) are respectively taken from the cross-sections B-B, C-C, and D-D, illustrated in . (b), (c), and (d) show the melt pool results taken from the position of the double arrow illustrated in (a).
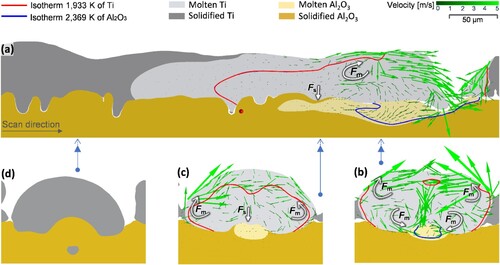
Figure 9. Interlayer interface shape and surface shape after solidification of a single track (L = 100 W, V = 400 mm/s and Ma = 1,913) (a) is taken from the cross-section A-A in . (b) and (c) are observations from viewing angle II and viewing angle Ⅰ, respectively.
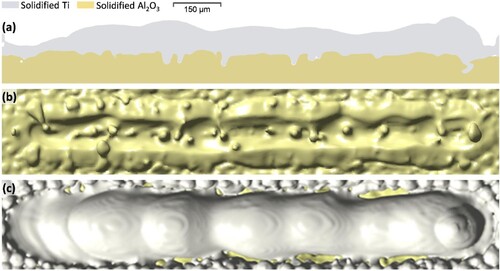
Figure 10. Representative simulation results which show the flow characteristics within the melt pool in the single track (L = 400 W, V = 400 mm/s and Ma = 4,096). (a) is taken from the cross-section A-A, and (b), (c) and (d) are respectively taken from the cross-sections B-B, C-C, and D-D, illustrated in . (b), (c), and (d) show the melt pool results taken from the position of the double arrow illustrated in (a).
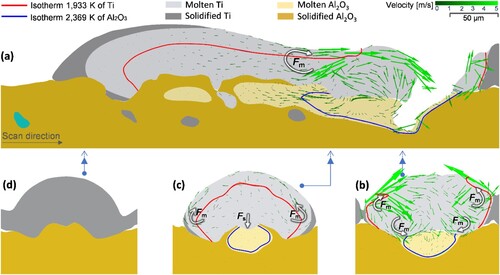
Figure 11. Interlayer interface shape and surface shape after solidification of a single track (L = 400 W, V = 400 mm/s and Ma = 4,096). (a) is taken from the cross-section A-A in . (b) and (c) are observations from viewing angle II and viewing angle Ⅰ, respectively.
When Km = 0 μm, the vaporisation of Ti is negligible and the melting of Al2O3 substrate is accomplished via heat conduction. This is also known as conduction mode melting and is applicable to all melt pools with Km < 50 μm. Consequently, the melting of Al2O3 substrate is marginal and manifests as a thin layer of liquid [(a)]. The cross-section A-A, as shown in (a), has Ti liquidus isotherm dividing the melt pool into – dσ/dT and + dσ/dT regions, respectively inducing counterclockwise and clockwise swirl.
Cross-section B-B reveals the Ti liquidus isotherm that conforms to the solidification boundary [(b)]. Since a laser with a Gaussian profile is used, temperature of the molten Ti decreases from the melt centreline to the solidification boundaries. Despite the underwhelming size of + dσ/dT regions, they induce a net flow from the sides of Ti melt pool towards the centreline, near the upper Ti/air and Ti/ceramic interfaces, respectively, located at the upper and lower Ti melt region. The upward flow along the melt centreline due to the counterclockwise swirl in cross-section A-A led to the Marangoni convection seen in cross section B-B, which is a counterclockwise and clockwise swirl corresponding to the left and right sides of the melt pool [(b)] (Zhang et al. Citation2018a).
Further away from the heat source in cross-section C–C, the size of + dσ/dT region increases, predominantly near the top melt pool surface, as shown in (c). Therefore, the Marangoni force on the top surface drives the Ti melt flow violently towards the centreline. With a downward flow along the centreline, induced by the clockwise swirl as seen in cross section A-A, the swirling pattern in cross-section C–C is the opposite of cross section B-B, with clockwise and counterclockwise swirl corresponding to the left and right sides of the melt pool. The resultant single-track cross section is shown in cross section D-D, with minimal perturbance of the interlayer interface due to the lack of molten Al2O3.
Similarly, the longitudinal cross section of the solidified melt pool shows relatively undisturbed interlayer interface, when Km = 0 μm [(a)]. Nevertheless, the melt convection and the large difference in surface tension between Ti and Al2O3 lead to slight waviness across the interlayer interface [(b)]. The minute amount of molten ceramic suppresses complex interlayer interface formation, which is akin to a lubrication layer that leads to an overwhelming liquid flow inertia, competing against surface tension to form an unstable single track [(c)]. This phenomenon is widely known as the Rayleigh-instability, and was reported in many LPBF single-track studies (Aramian et al. Citation2020).
When Km = 50 μm, the recoil pressure ‘drills’ the molten Ti and make way for direct laser irradiation onto the Al2O3 substrate, effectively increasing the volume of molten Al2O3 [(a)]. Still, its amount is relatively small, as the combination of high melting point and specific heat capacity of Al2O3 makes it difficult to melt it, in addition to the high viscosity that suppresses convective heat transfer. The flow mechanism of the keyhole melt pool across the cross-section A-A is similar to that in (b), showing clockwise dominated flow. This induces downward flow along the middle line of the cross-section B-B [(b)], resulting in clockwise and counterclockwise swirls on the melt upper half, respectively associated with the left – and right-hand sides of the melt pool. In contrast, the swirling direction reverses near the interlayer interface region, but with significantly lesser flow rate owing to the highly viscous Al2O3. Most of the interlayer interface perturbation takes place near the keyhole, as the movement of molten Al2O3 gets quickly dampened as it moves away from the heat source, as seen in the cross-section C–C [(c)]. Nevertheless, the overall increase in volume and length of molten Al2O3 allows significantly more mass transport as a result of Marangoni force and surface tension, thereby enhancing the ‘W’ shaped interlayer interface formation, illustrated in the frozen cross-section D-D [(c)].
Similarly, observation on the cross-section of solidified single track, along the scan direction, reveals strong anchoring of Ti into the Al2O3 substrate [(a)]. It is worth noting that the differences in the surface tensions of molten Ti into Al2O3 lead to obvious intrusion of Ti into Al2O3, which manifest as a depression line along the scan direction of the single track [(b)]. Aside from the viscous molten Al2O3 that dampens the overall melt flow, the tortuous interlayer interface reduces the flow inertia of molten Ti and helps in the suppression of melt pool instability [(c)].
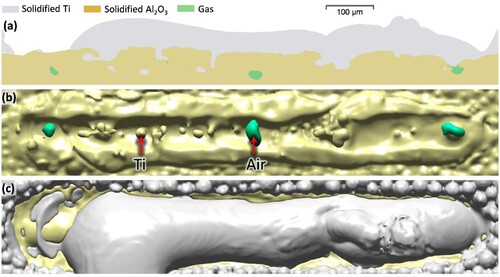
The keyhole penetrates the substrate when Km = 100 μm and allows the recoil pressure to act directly onto the molten Al2O3 []. For a dissimilar material system with only metals and/or alloys, the intense recoil pressure would push the substrate material and contribute to the overall inertia and swirling of the melt pool, thereby promoting significant interpenetration between the dissimilar materials (Yao et al. Citation2021). In this case however, the contribution of inertia by the recoil pressure was quickly suppressed by the viscous molten Al2O3. As a result, the overall melt pool velocity for Km = 100 μm is slower. Without additional contribution of melt driving force, the melt pool motion and the interlayer interface morphology are similar to the case where Km = 50 μm []. With increased keyhole and melt pool depth, the molten Ti can be pushed further into the Al2O3 substrate. This also means that the Argon gas or vapours can be introduced and trapped within the viscous Al2O3 to form keyhole-induced porosities [(a) and (b)]. With an overall suppression of convective motion, the Km = 100 μm melt pool surface is less disturbed and exhibits less waviness and humping phenomena (Tang, Le, and Wong Citation2020), as observed from the plan view of the melt pool [(c)].
3.4 Process parameter map for metal-on-ceramic single tracks
As seen from the results presented thus far, the laser scanning parameters, L and V, strongly affects the single-track attributes, i.e. the surface topology, interlayer interface morphology, and porosity level. Mapping the effect of process parameters enables the identification of optimal process window, which constitutes single tracks with stable melt pool, tortuous interlayer interface, and minimal porosity. Based mainly on the CFD simulations, the process parameter map associated with single-track attributes is shown in . Seven distinct regions, namely A to E, with defined linear energy density (ED = L / V, kJ/m) range were marked, which correlate well with the types of single-track surface topology. They are the continuous region A (ED ≥ 0.75), hump region B (0.50 ≤ ED < 0.75), discontinuous region C (0.25 ≤ ED < 0.50), balling region D (0.15 ≤ ED < 0.25), balling/lack-of-melting region E (0.10 ≤ ED < 0.15), and lack-of-melting region F (ED < 0.10).
Figure 12. Influence of process parameters on the surface shape of a single track. The solid symbol indicates that the interlayer interface is W-shaped, the hollow symbol indicates that the interlayer interface is a flat shape, and the semi-solid symbol indicates that there are pores in a single track. Representative micrographs of single tracks from each region are shown, serving as experimental validation of the process map.
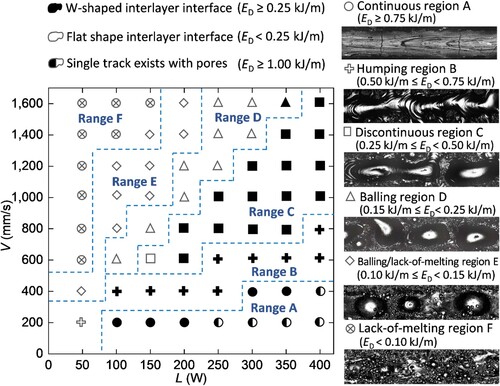
Single-track morphology is closely related to the tendency to form a ‘hump’, which is caused by large melt inertia that disturbs the stability of melt surface (Tang, Le, and Wong Citation2020). The longer the melt pool is, the easier it is for such instability to occur. In region A (ED ≥ 0.75), the slow scan velocity led to a relatively short melt pool, which renders the surface tension effective in stabilising the melt surface and suppresses the ‘hump’ formation. Moreover, the formation of keyhole down to the viscous Al2O3, as opposed to only the Ti layer, led to heavy suppression of inertia transfer from the recoil pressure. The combined effect of these two results in the formation of a stable and continuous single track. At the same time, a strong ‘W’ shaped interlayer interface can be promoted with the deep keyhole melting mode. While this is a desirable trait for multi-material bonding, transverse cracks can be observed on the solidified Ti track (), due to restriction of Ti contraction upon solidification and cooling. The cracking issue is further exacerbated by the relatively large thermal coefficient of expansion of Ti (8.5 × 10⁻⁶/K), in contrast to that of Al2O3 (4.5 × 10⁻⁶/K). As the ED further increases to ≥ 1.00, keyhole induced porosity will be introduced, which can deteriorate the part’s structural integrity in a substantial manner.
In the region B (0.5 ≤ ED < 0.75), there is a general increment in laser scanning velocity and therefore, the formation of longer melt pool. This means more opportunity for melt surface disturbance by the flow inertia of the molten Ti, prompting the formation of ‘humps’. At this stage, the interlayer interface remains in the desirable ‘W’ shape owing to the relatively deep keyhole formation. Moving on to the region C (0.25 ≤ ED < 0.50), the Ti melt pool length increases further with the scanning velocity, leading to discontinuous single track. The W-shaped interlayer interface becomes less apparent as a result of the reduced molten Al2O3 depth.
In the region D (0.15 ≤ ED < 0.25), the keyhole melting is limited only to the Ti layer. As a result, there is a significant reduction in molten Al2O3 volume, during the laser scanning procedure. Coupled with a limited keyhole penetration, the interlayer interface lacks perturbation and exhibits a relatively flat characteristic. The lack of viscous molten Al2O3 results in a higher flow inertia that promotes ‘hump’ formation, or ‘balling’ in this case. The thin sheath of molten Al2O3 is akin to a lubrication layer that promotes flow of molten Ti.
In the region E (0.10 ≤ ED < 0.15), the lack of sufficient ED leads to insufficient melting of Ti. The inability of molten Ti to sufficiently wet the Al2O3 substrate is evident from the formation of small Ti beads. Some of the powder Ti does not fully melt under the conduction mode and falls off. The single track thus resembles a balling/lack-of-melting characteristic. Further reducing ED results in a complete lack-of-melting of Ti in the region F (ED < 0.10).
A W-shaped interlayer interface has more surface area than a flat one, which could result in better bond strength and thermal conductivity between dissimilar materials. To allow cross comparison between melt tracks of different dimensions, the normalised interfacial area (NIA) is used (Yao et al. Citation2021), where
is the actual interlayer interface area, and
is the area of a perfectly flat interlayer interface. As illustrated in (a), NIA essentially quantifies the effectiveness of a certain interlayer interface morphology to increase the bonding area.
Figure 13. Schematic diagram of (a) the normalised interface area (NIA) for LPBF single track and analysis of (b) the influence of process parameters.
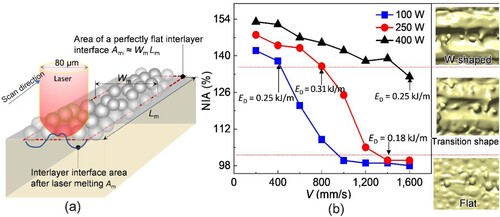
The graph in (b) depicts the NIA values associated with different L and V combinations. With increasing ED, the interlayer interface morphology transitioned from flat (ED < 0.18) to W-shape (ED ≥ 0.25), as discussed in the previous section. The NIA value of Ti on Al2O3 single track saturates at around ∼150%. In contrast, the NIA value for IN718 on SS316L single track, or dissimilar alloy printing, saturates in the order of ∼1,000%. The comparison reveals a general challenge associated with metal-on-ceramic printing to achieve a highly interlocked interface. The viscosity of ceramic substrate suppresses its interpenetration with the metal/alloy above it. Even with a sufficiently strong bond and a stable single track formation, the solidified metal/alloy will experience large tensile residual stress and induce transverse cracks. The challenges associated with metal-on-ceramic printing via LPBF can possibly be overcome through future improvements, such as the implementation of a preheating stage to facilitate the melting and flow of the ceramic substrate. Another direction is through the modification of molten ceramic’s viscosity and thermal expansion coefficient (Wang et al. Citation2022a). Future studies on ceramic-on-metal printing, or other configurations will certainly be of interest too.
It is important to note that in practical applications, LPBF is commonly used with multi-track, multi-layer scanning. Consequently, variations in heat transfer efficiency and temperature distribution can occur between adjacent tracks and layers. These variations can lead to changes in the temperature and temperature gradient within each pass, thereby influencing the flow dynamics of the melt pool and potentially resulting in different interface shapes compared to single-track scans under the same parameters.
The focus of this paper is to investigate the fluid dynamics of the multi-material single track in order to establish a fundamental understanding of the metal-on-ceramic printing process. While it is not appropriate to draw direct conclusions on interface quality of a bulk material from a single-track melt pool when the same laser combination is employed, the insights gained from the single-track studies can be adopted to some extent for multi-track and multi-layer scenarios. For example, the formation of desirable wavy interfaces and the challenges posed by highly viscous ceramic materials.
We acknowledge that a comprehensive investigation of bonding interface morphology and its evolution in multi-track scanning is crucial for a thorough understanding of the metal-on-ceramic printing process. Key aspects that require further research efforts include the retention of interface features after multiple laser passes, the effect of adjacent scan tracks on interface morphology, and the potential impact of remelting between adjacent passes. Such analysis would provide valuable insights into the complex interplay between melt flow, temperature distribution, and interface formation in multi-track scanning scenarios. Moreover, a better representative parameter index, other than linear energy density, that encompasses laser scanning parameters and material properties when multi-track scanning is involved, should be explored. Normalised enthalpy can be considered as a potential candidate for fulfilling this purpose (Ghasemi-Tabasi et al. Citation2020). The insights gained from these investigations will facilitate the development of better optimised printing strategies for improving metal-on-ceramic bonding interfaces.
4. Conclusions
The Al2O3 ceramic has high melt viscosity (32 mPa·s) and low coefficient of thermal expansion (4.5 × 10⁻⁶/K), in comparison to metals/alloys, making single-track laser melting of Ti powder on Al2O3 substrate a challenging task. The extend of keyhole formation affects the Marangoni force, surface tension, and recoil pressure, whose combination, in turn, dictates the perturbation of Ti/Al2O3 interface in the molten state. Interface perturbation scales with increasing keyhole depth. In conduction mode melting, keyhole does not form, resulting in a relatively flat interface formation. Increasing the keyhole depth leads to wavy ‘W-shaped’ interlayer interface but induces porosity when the depth is excessive. Compared with the flat interface, the normalised interfacial area (NIA) of the ‘W-shaped’ interface increased by about 0.5 times.
The overall characteristic of Ti on Al2O3 single track can be grouped based on the input linear energy density, ED, which is a function of laser scanning parameters, L and V. The single track is stable, free of keyhole pores and forms ‘W-shaped’ interlayer interface when 1 < ED < 0.75. However, transverse cracking forms on the single track due to coefficient of thermal expansion disparity between Ti and Al2O3. As ED reduces, ‘humping’ occurs and forms unstable melt pool. Achieving defect-free Ti-on-Al2O3 single tracks is challenging, highlighting the need for further studies to address and resolve this issue.
Disclosure statement
No potential conflict of interest was reported by the author(s).
Additional information
Funding
References
- Amore, S., J. Brillo, I. Egry, and R. Novakovic. 2011. “Surface Tension of Liquid Cu-Ti Binary Alloys Measured by Electromagnetic Levitation and Thermodynamic Modelling.” Applied Surface Science 257 (17): 7739–7745. https://doi.org/10.1016/j.apsusc.2011.04.019
- Aramian, A., S. M. J. Razavi, Z. Sadeghian, and F. Berto. 2020. “A Review of Additive Manufacturing of Cermets.” Addit Manuf 33: 101130. https://doi.org/10.1016/j.addma.2020.101130
- Brillo, J., J. Wessing, H. Kobatake, and H. Fukuyama. 2019. “Surface Tension of Liquid Ti with Adsorbed Oxygen and its Prediction.” Journal of Molecular Liquids 290: 111226. https://doi.org/10.1016/j.molliq.2019.111226
- Chen, Q., Y. Zhao, S. Strayer, Y. Zhao, K. Aoyagi, Y. Koizumi, and A. C. To. 2021. “Elucidating the Effect of Preheating Temperature on Melt Pool Morphology Variation in Inconel 718 Laser Powder bed Fusion via Simulation and Experiment.” Addit Manuf 37: 101642. https://doi.org/10.1016/j.addma.2020.101642
- Cui, M., L. Lu, Z. Zhang, and Y. Guan. 2021. “A Laser Scanner-Stage Synchronized System Supporting the Large-Area Precision Polishing of Additive-Manufactured Metallic Surfaces.” Engineering 7 (12): 1732–1740. https://doi.org/10.1016/j.eng.2020.06.028
- Cunningham, R., C. Zhao, N. Parab, C. Kantzos, J. Pauza, K. Fezzaa, and A. D. Rollett. 2019. “Keyhole Threshold and Morphology in Laser Melting Revealed by Ultrahigh-Speed x-ray Imaging.” Science 363 (6429): 849–852. https://doi.org/10.1126/science.aav4687
- Exner, H., M. Horn, A. Streek, F. Ullmann, L. Hartwig, P. Regenfuß, and R. Ebert. 2008. “Laser Micro Sintering: A new Method to Generate Metal and Ceramic Parts of High Resolution with sub-Micrometer Powder.” Virtual and Physical Prototyping 3 (1): 3–11. https://doi.org/10.1080/17452750801907970
- Fan, Z., M. Lu, and H. Huang. 2018. “Selective Laser Melting of Alumina: A Single Track Study.” Ceramics International 44 (8): 9484–9493. https://doi.org/10.1016/j.ceramint.2018.02.166
- Gai, L., Y. Liu, X. Xin, Z. Zeng, Q. Qi, J. Huang, and X. Liu. 2017. “Promising Cermets of TiN-Ni for Intermediate Temperature Solid Oxide Fuel Cell Interconnects Application.” Journal of Power Sources 359: 166–172. https://doi.org/10.1016/j.jpowsour.2017.05.062
- Ghasemi-Tabasi, H., J. Jhabvala, E. Boillat, T. Ivas, R. Drissi-Daoudi, and R. E. Logé. 2020. “An Effective Rule for Translating Optimal Selective Laser Melting Processing Parameters from one Material to Another.” Addit Manuf 36: 101496. https://doi.org/10.1016/j.addma.2020.101496
- Gheisari, R., H. Chamberlain, G. Chi-Tangyie, S. Zhang, A. Goulas, C. K. Lee, and D. S. Engstrøm. 2020. “Multi-material Additive Manufacturing of low Sintering Temperature Bi2Mo2O9 Ceramics with Ag Floating Electrodes by Selective Laser Burnout.” Virtual and Physical Prototyping 15 (2): 133–147. https://doi.org/10.1080/17452759.2019.1708026
- Gu, D., C. Ma, M. Xia, D. Dai, and Q. Shi. 2017. “A Multiscale Understanding of the Thermodynamic and Kinetic Mechanisms of Laser Additive Manufacturing.” Engineering 3 (5): 675–684. https://doi.org/10.1016/J.ENG.2017.05.011
- Gu, H., C. Wei, L. Li, Q. Q. Han, R. Setchi, M. Ryan, and Q. Li. 2020. “Multi-physics Modelling of Molten Pool Development and Track Formation in Multi-Track,: Multi-Layer and Multi-Material Selective Laser Melting.” International Journal of Heat and Mass Transfer 151: 119458. https://doi.org/10.1016/j.ijheatmasstransfer.2020.119458
- Hu, R., M. Luo, and A. Huang. 2021. “Selective Laser Melting Under Variable Ambient Pressure: A Mesoscopic Model and Transport Phenomena.” Engineering 7 (8): 1157–1164. https://doi.org/10.1016/j.eng.2021.07.003
- Huang, S., P. Kumar, Y. Yeong W, L. Narayan R, and U. Ramamurty. 2022. “Fracture Behavior of Laser Powder bed Fusion Fabricated Ti41Nb via in-Situ Alloying.” Acta Materialia 225: 117593. https://doi.org/10.1016/j.actamat.2021.117593
- Huang, S., R. L. Narayan, J. H. K. Tan, S. L. Sing, and W. Y. Yeong. 2021. “Resolving the Porosity-Unmelted Inclusion Dilemma During in-Situ Alloying of Ti34Nb via Laser Powder bed Fusion.” Acta Materialia 204: 116522. https://doi.org/10.1016/j.actamat.2020.116522
- Jianxin, D., D. Zhenxing, and Y. Dongling. 2010. “Fabrication and Performance of Al2O3/(W, Ti) C+ Al2O3/TiC Multilayered Ceramic Cutting Tools.” Materials Science and Engineering: A 527 (4-5): 1039–1047. https://doi.org/10.1016/j.msea.2009.09.020
- Khairallah, S. A., A. A. Martin, R. I. Lee J, G. Guss, N. P. Calta, J. A. Hammons, G. Nielsen, M. H. K. Chaput, E. Schwalbach, and M. N. Shah. 2020. “Controlling Interdependent Meso-Nanosecond Dynamics and Defect Generation in Metal 3D Printing.” Science 368 (6491): 660–665. https://doi.org/10.1126/science.aay7830
- Kliauga, A. M., and M. Ferrante. 2000. “Interface Compounds Formed During the Diffusion Bonding of Al2O3 to Ti.” Journal of Materials Science 35 (17): 4243–4249. https://doi.org/10.1023/A:1004815830980
- Koopmann, J., J. Voigt, and T. Niendorf. 2019. “Additive Manufacturing of a Steel–Ceramic Multi-Material by Selective Laser Melting.” Metallurgical and Materials Transactions B 50 (2): 1042–1051. https://doi.org/10.1007/s11663-019-01523-1
- Kumar, P., and U. Ramamurty. 2019. “Microstructural Optimization Through Heat Treatment for Enhancing the Fracture Toughness and Fatigue Crack Growth Resistance of Selective Laser Melted Ti6Al4V Alloy.” Acta Materialia 169: 45–59. https://doi.org/10.1016/j.actamat.2019.03.003
- Li, Q., S. Huang, Y. Zhao, Y. Gao, and U. Ramamurty. 2023. “Simultaneous Enhancements of Strength,: Ductility, and Toughness in a TiB Reinforced Titanium Matrix Composite.” Acta Materialia 254: 118995. https://doi.org/10.1016/j.actamat.2023.118995
- Li, C., D. Pisignano, Y. Zhao, and J. Xue. 2020. “Advances in Medical Applications of Additive Manufacturing.” Engineering 6 (11): 1222–1231. https://doi.org/10.1016/j.eng.2020.02.018
- Lu, Z., J. Cao, Z. Song, D. Li, and B. Lu. 2019. “Research Progress of Ceramic Matrix Composite Parts Based on Additive Manufacturing Technology.” Virtual and Physical Prototyping 14 (4): 333–348. https://doi.org/10.1080/17452759.2019.1607759
- Mishra, G. K., C. P. Paul, A. K. Rai, A. K. Agrawal, S. K. Rai, and K. S. Bindra. 2021. “Experimental Investigation on Laser Directed Energy Deposition Based Additive Manufacturing of Al2O3 Bulk Structures.” Ceramics International 47 (4): 5708–5720. https://doi.org/10.1016/j.ceramint.2020.10.157
- Nguyen, Q. B., M. L. S. Nai, Z. Zhu, C. N. Sun, J. Wei, and W. Zhou. 2017. “Characteristics of Inconel Powders for Powder-bed Additive Manufacturing.” Engineering 3 (5): 695–700. https://doi.org/10.1016/J.ENG.2017.05.012
- Paradis, P. F., and T. Ishikawa. 2005. “Surface Tension and Viscosity Measurements of Liquid and Undercooled Alumina by Containerless Techniques.” Japanese Journal of Applied Physics 44 (7R): 5082. https://doi.org/10.1143/JJAP.44.5082
- Paradis, P. F., T. Ishikawa, and S. Yoda. 2002. “Non-contact Measurements of Surface Tension and Viscosity of Niobium,: Zirconium, and Titanium Using an Electrostatic Levitation Furnace.” International Journal of Thermophysics 23 (3): 825–842. https://doi.org/10.1023/A:1015459222027
- Pelz, J. S., N. Ku, W. T. Shoulders, M. A. Meyers, and L. R. Vargas-Gonzalez. 2021. “Multi-material Additive Manufacturing of Functionally Graded Carbide Ceramics via Active,: In-Line Mixing.” Addit Manuf 37: 101647. https://doi.org/10.1016/j.addma.2020.101647
- Radhakrishnan, J., P. Kumar, S. Li, Y. Zhao, and U. Ramamurty. 2022a. “Unnotched Fatigue of Inconel 718 Produced by Laser Beam-Powder bed Fusion at 25 and 600° C.” Acta Materialia 225: 117565. https://doi.org/10.1016/j.actamat.2021.117565
- Radhakrishnan, R. J., P. Kumar, H. L. Seet, S. M. Nai, P. Wang, and U. Ramamurty. 2022b. “Cascading of the as-Built Microstructure Through Heat Treatment and its Role on the Tensile Properties of Laser Powder bed Fused Inconel 718.” Mater 21: 101272. https://doi.org/10.1016/j.mtla.2021.101272
- Rajabi, A., J. Ghazali M, and R. Daud A. 2015. “Chemical Composition,: Microstructure and Sintering Temperature Modifications on Mechanical Properties of TiC-Based Cermet-A Review.” Materials & Design 67: 95–106. https://doi.org/10.1016/j.matdes.2014.10.081
- Rhee, S. K. 1972. “Critical Surface Energies of Al2O3 and Graphite.” Journal of the American Ceramic Society 55 (6): 300–303. https://doi.org/10.1111/j.1151-2916.1972.tb11289.x
- Sen, I., S. Tamirisakandala, D. B. Miracle, and U. Ramamurty. 2007. “Microstructural Effects on the Mechanical Behavior of B-Modified Ti-6Al-4V Alloys.” Acta Materialia 55 (15): 4983–4993. https://doi.org/10.1016/j.actamat.2007.05.009
- Singh, G., and U. Ramamurty. 2020. “Boron Modified Titanium Alloys.” Progress in Materials Science 111: 100653. https://doi.org/10.1016/j.pmatsci.2020.100653
- Sun, Z., Y. H. Chueh, and L. Li. 2020. “Multiphase Mesoscopic Simulation of Multiple and Functionally Gradient Materials Laser Powder bed Fusion Additive Manufacturing Processes.” Addit Manuf 35: 101448. https://doi.org/10.1016/j.addma.2020.101448
- Syed-Khaja, A., and J. Franke. 2016. Selective laser melting for additive manufacturing of high-temperature ceramic circuit carriers, In 2016 IEEE 66th Electronic Components and Technology Conference, 2016:837-842.
- Tan, C., D. Wang, W. Ma, and K. Zhou. 2021. “Ultra-strong Bond Interface in Additively Manufactured Iron-Based Multi-Materials.” Materials Science and Engineering: A 802: 140642. https://doi.org/10.1016/j.msea.2020.140642
- Tang, C., K. Q. Le, and C. H. Wong. 2020. “Physics of Humping Formation in Laser Powder Bed Fusion.” International Journal of Heat and Mass Transfer 149: 119172. https://doi.org/10.1016/j.ijheatmasstransfer.2019.119172
- Tang, C., L. M. Yao, and H. J. Du. 2022. “Computational Framework for the Simulation of Multi Material Laser Powder bed Fusion.” International Journal of Heat and Mass Transfer 191: 122855. https://doi.org/10.1016/j.ijheatmasstransfer.2022.122855
- Tolochko, N. K., V. Khlopkov Y, E. Mozzharov S, M. B. Ignatiev, T. Laoui, and V. I. Titov. 2000. “Absorptance of Powder Materials Suitable for Laser Sintering.” Rapid Prototyping Journal 6 (3): 155–161. https://doi.org/10.1108/13552540010337029
- Voller, V. R., A. D. Brent, and C. Prakash. 1989. “The Modelling of Heat,: Mass and Solute Transport in Solidification Systems.” International Journal of Heat and Mass Transfer 32 (9): 1719–1731. https://doi.org/10.1016/0017-9310(89)90054-9
- Wang, Y., P. Fu, N. Wang, L. Peng, B. Kang, and H. Zeng. 2020. “Challenges and Solutions for the Additive Manufacturing of Biodegradable Magnesium Implants.” Engineering 6 (11): 1267–1275. https://doi.org/10.1016/j.eng.2020.02.015
- Wang, R., D. Gu, G. Huang, K. Shi, L. Yuan, and H. Zhang. 2023. “Multilayered Gradient Titanium-Matrix Composites Fabricated by Multi-Material Laser Powder bed Fusion Using Metallized Ceramic: Forming Characteristics,: Microstructure Evolution, and Multifunctional Properties.” Addit Manuf, 62: 103407. https://doi.org/10.1016/j.addma.2023.103407
- Wang, R., D. Gu, K. Lin, C. Chen, Q. Ge, and D. Li. 2022a. “Multi-material Additive Manufacturing of a bio-Inspired Layered Ceramic/Metal Structure: Formation Mechanisms and Mechanical Properties.” International Journal of Machine Tools and Manufacture 175: 103872. https://doi.org/10.1016/j.ijmachtools.2022.103872
- Wang, D., L. Liu, G. Deng, C. Deng, Y. Bai, Y. Yang, and C. Han. 2022b. “Recent Progress on Additive Manufacturing of Multi-Material Structures with Laser Powder bed Fusion.” Virtual and Physical Prototyping 17 (2): 329–365. https://doi.org/10.1080/17452759.2022.2028343
- Wei, M., W. J. Ding, G. Vastola, and Y. W. Zhang. 2022a. “Quantitative Study on the Dynamics of Melt Pool and Keyhole and Their Controlling Factors in Metal Laser Melting.” Addit Manuf 54: 102779. https://doi.org/10.1016/j.addma.2022.102779
- Wei, S., C. Hutchinson, and U. Ramamurty. 2023. “Mesostructure Engineering in Additive Manufacturing of Alloys.” Scripta Materialia 230: 115429. https://doi.org/10.1016/j.scriptamat.2023.115429
- Wei, S., P. Kumar, K. B. Lau, D. Wuu, L. L. Liew, F. Wei, and U. Ramamurty. 2022b. “Effect of Heat Treatment on the Microstructure and Mechanical Properties of 2.4 GPa Grade Maraging Steel Fabricated by Laser Powder bed Fusion.” Addit Manuf 59: 103190. https://doi.org/10.1016/j.addma.2022.103190
- Wei, C., and L. Li. 2021. “Recent Progress and Scientific Challenges in Multi-Material Additive Manufacturing via Laser-Based Powder bed Fusion.” Virtual and Physical Prototyping 16 (3): 347–371. https://doi.org/10.1080/17452759.2021.1928520
- Wu, D., J. Shi, F. Niu, Guangyi Ma, Cong Zhou, and Bi Zhang. 2022. “Direct Additive Manufacturing of Melt Growth Al2O3-ZrO2 Functionally Graded Ceramics by Laser Directed Energy Deposition.” Journal of the European Ceramic Society 42 (6): 2957–2973. https://doi.org/10.1016/j.jeurceramsoc.2022.01.034
- Yao, L. M., S. Huang, U. Ramamurty, and Z. M. Xiao. 2021. “On the Formation of “Fish-Scale” Morphology with Curved Grain Interfacial Microstructures During Selective Laser Melting of Dissimilar Alloys.” Acta Materialia 220: 117331. https://doi.org/10.1016/j.actamat.2021.117331
- Ye, W., Y. Tian, D. Zhou, P. Li, J. Lei, and Y. Zhang. 2021. “Thermal Model and Numerical Simulation of Selective Laser Alloying Process of Elemental Ti and B.” Metals and Materials International 27 (8): 2791–2808. https://doi.org/10.1007/s12540-020-00955-8
- Zhang, Y., and A. Bandyopadhyay. 2018. “Direct Fabrication of Compositionally Graded Ti-Al2O3 Multi-Material Structures Using Laser Engineered Net Shaping.” Addit Manuf 21: 104–111. https://doi.org/10.1016/j.addma.2018.03.001
- Zhang, Y., Q. Chen, G. Guillemot, C.-A. Gandin, and M. Bellet. 2018a. “Numerical Modelling of Fluid and Solid Thermomechanics in Additive Manufacturing by Powder-bed Fusion: Continuum and Level set Formulation Applied to Track-and Part-Scale Simulations.” Comptes Rendus Mécanique 346 (11): 1055–1071. https://doi.org/10.1016/j.crme.2018.08.008
- Zhang, K., T. Liu, W. Liao, C. Zhang, D. Du, and Y. Zheng. 2018b. “Photodiode Data Collection and Processing of Molten Pool of Alumina Parts Produced Through Selective Laser Melting.” Optik 156: 487–497. https://doi.org/10.1016/j.ijleo.2017.11.143
- Zhang, X., B. Zhang, Y. Mu, S. Shao, C. D. Wick, B. R. Ramachandran, and W. J. Meng. 2017. “Mechanical Failure of Metal/Ceramic Interfacial Regions Under Shear Loading.” Acta Materialia 138: 224–236. https://doi.org/10.1016/j.actamat.2017.07.053