
 ?Mathematical formulae have been encoded as MathML and are displayed in this HTML version using MathJax in order to improve their display. Uncheck the box to turn MathJax off. This feature requires Javascript. Click on a formula to zoom.
ABSTRACT
Additive manufacturing (AM) has revolutionised the manufacturing world due to its unique advantages, such as the ability to create complex geometries, work with dissimilar metallic materials, eliminate the need for molds or fixed tooling, and provide economic benefits. However, due to the high complexity and dynamics of AM processes, AM parts are prone to various defects that may affect their mechanical properties and safety. Therefore, the as-built quality cannot meet some strict functional requirements in nuclear, energy and aerospace applications. Non-destructive testing (NDT) techniques have proven to be very effective in inspecting damage, aiding in process optimisation and quality control, which can contribute to enhancing the mechanical properties of AM parts. This work presents a comprehensive and up-to-date review and analysis of NDT techniques for damage detection and in-situ process monitoring in metal-based AM. The major characteristics of NDT techniques are analysed, and the most relevant works and primary challenges that every technique faces are highlighted. Moreover, this paper presents the detection and characterisation of defects based on machine learning combined with different NDT techniques.
1. Introduction
Additive manufacturing (AM) is developing and upgrading with a variety of applications. In particular, the aerospace, nuclear, energy and automotive fields have greatly promoted AM for metals. An example in aerospace includes the fabrication of complex fuel injector nozzles using AM, which previously required the assembly of multiple components [Citation1–3]. Additional advantages of AM include rapid response to customer demand, the potential to utilise new materials, on-demand customisation, and more.
Due to the variability and complexity of the AM processes and 3D printers for metals, various internal defects can occur in as-built parts. These defects can have a noticeable impact on the internal microstructure, mechanical properties, and quality of these parts [Citation4]. A major factor limiting the broad adoption of AM by industries is the complexity associated with the inspection, characterisation, and evaluation of damage in AM parts. Non-destructive testing (NDT) techniques have been applied to effectively detect various flaws in AM products. The AM processes and parameters vary for each process, making the NDT of AM products more complicated than that of traditionally manufactured products [Citation2, Citation5]. The complex geometries of many AM parts require the proper selection and use of the NDT technique to be optimal for defect inspection. In some cases, combinations of NDT techniques have been used to inspect defects in critical parts more efficiently [Citation6]. It is worth noting that there are some innovative designs aimed at producing crack-free parts by using modified raw materials under specific manufacturing processes [Citation7, Citation8]. However, even when produced under the same process, parts can exhibit significant differences. Once these parts are utilised in real-world environments, the emergence of defects might be inevitable. NDT techniques can be employed not only to verify and monitor the effectiveness of these crack-free designs but also for in-service monitoring. This allows for a quantitative assessment of structural integrity and material properties.
There are many research reviews on NDT and in-situ monitoring of AM processes and final products. The NDT techniques such as X-ray computed tomography (CT), acoustic emission (AE) testing, ultrasonic testing (UT), thermography, computer vision, structured light system, and laser line scanner have been used during and after the AM processes [Citation9–11]. Taheri et al. [Citation12] conducted a survey for defect types, defect generation mechanisms, and NDT techniques for the assessment of mechanical properties and quality control of AM parts. Then, Mandache [Citation13] reviewed different NDT techniques for detecting metal-based AM anomalies and service-induced defects. The author proposed reference blocks and standard procedures to ensure that the same NDT method, used by different operators on the same metal material and obtained by similar AM processes, can produce comparable detection results. Koester et al. [Citation5] presented the challenges of achieving reliable detection and characterisation in metal powder-based AM processes, including problems arising from microstructural and geometric features, limitations of existing NDT technologies, and remaining technology gaps, with a main focus on monitoring and detection during the AM build process. Further advancing the discourse, Sreeraj et al. [Citation14] provided an overview of common defects in AM parts, various NDT techniques applicable to AM parts, and their ability to inspect and control flaws formed during part manufacturing and service. Ramírez et al. [Citation15] analysed the major characteristics of state-of-the-art NDT techniques and introduced the main related work and challenges for each NDT technique. The authors showed the smallest defect size detected by the NDT method, obtained from academic studies or tests conducted by companies.
In addition, the literature showed some more targeted surveys and reviews on NDT techniques. For example, some researchers have provided a comprehensive overview of different NDT techniques specifically for wire and arc AM (WAAM) [Citation16–18]. Focusing on X-ray technology, Du et al. [Citation19] conducted a study on X-ray microcomputed tomography used for dimensional measurements, porosity analysis, and defect detection of AM parts. Li et al. [Citation20] also provided a focused exploration of high-speed synchrotron X-ray technology for real-time, in situ observation and analysis of defect formation processes in AM over the past five years. Furthermore, Honarvar and Varvani-Farahani [Citation21] provided an exhaustive overview of in-situ and offline UT methods applied to AM, discussing in detail the UT used for defect detection in AM parts. Lu and Wong [Citation22] summarised the principles of in-process AE testing and thermography in AM processes. The application of these two NDT techniques in AM, along with their applicability to defect inspection of AM parts, is reviewed in this work, and the benefits and shortcomings of both techniques are evaluated.
This work presents a new study based on a comprehensive and updated review of different NDT techniques used in the AM processes for metals and finished products, which was not considered in existing literature reviews. An exhaustive analysis of the main NDT techniques and these techniques combined with machine learning (ML) techniques is provided. The remainder of this paper is organised as follows. Section 2 presents an overview of the AM processes and common defects that may occur in metal-based AM. In Section 3, the primary NDT techniques applied in AM processes and products are introduced. The discussion and further research directions are described in Section 4 and the conclusions are provided in Section 5.
2. Overview
2.1. Additive manufacturing technology
The ISO/ASTM 52900: 2021 (Additive manufacturing -- General principles -- Fundamentals and vocabulary) defines AM as follows: a process of joining materials to make objects from 3D model data, usually layer upon layer, as opposed to subtractive manufacturing methodologies [Citation14, Citation23]. Overall, AM techniques involve several similar stages to transform the CAD model into the actual physical part. These stages include pre-processing steps such as creating a 3D model using CAD software, or obtaining geometrical information through reverse engineering, file preparation and machine setup [Citation14]. Following the pre-processing steps, the AM process takes place, and finally, the post-processing occurs, which may include cleaning and other surface modifications [Citation24, Citation25]. Additional post-processing can include heat treatment such as hot isostatic processing for metals [Citation26–28]. The details of the AM process have been described in previous literature [Citation29–36].
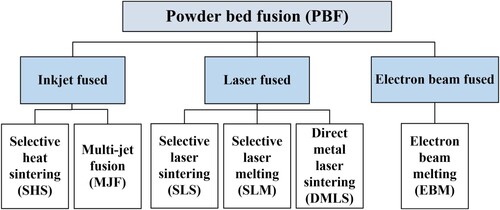
AM techniques are divided into seven categories: directed energy deposition (DED), material extrusion (MEX), powder bed fusion (PBF), sheet lamination (SHL), material jetting (MJT), binder jetting (BJT), and vat photopolymerization (VPP). The advantages and disadvantages of these techniques are shown in . In the interest of this review, the techniques of all groups have been used to process metal, which is the focus [Citation37]. Among these, DED and PBF are the most established in the industry.
Table 1. Advantages and disadvantages of different AM technologies [Citation38].
DED employs an energy source along with one or multiple feedstock feeding nozzles. The energy source used can be a laser, an electron beam, plasma, or an electric arc. The wire or powder used as raw material is melted at a defined location by an energy source, such as an electron beam or a laser, and then deposited on top of the substrate in incremental layers. shows a typical powder-fed DED system that uses a laser as its energy source. Note that a more detailed classification of the main DED technologies is shown in . Usually, powder-based DEDs are more prevalent, and while the raw material cost of the wire is lower, a stronger laser is required to melt the wire, which raises the equipment cost. The flexible powder-feeding system from DED is appropriate for processing several materials and creating functionally graded parts with distinct functionalities. The preparation of large parts, the repair of damaged parts, and coating are all appropriate uses for DED technology because the advanced DED equipment uses a 5-axis system, the processing range is greater than that of a 3-axis system, and the deposition rate is faster (2.5 kg/h) [Citation39]. Multiple robots have also been used for large format metal AM based on the DED techniques [Citation40, Citation41]. However, there are challenges with DEDs. During the layer-by-layer deposition, the material undergoes specific temperature cycles, potentially causing complex phase transitions and dangerous residual stresses [Citation42, Citation43]. Additionally, the DED-deposited layers tend to be thicker than the PBF-deposited layers, resulting in shallower inter-lapped fusion at the layer interfaces, and the sections have more anisotropy [Citation44].
Figure 1. Schematic diagram of the processing principle of DED.
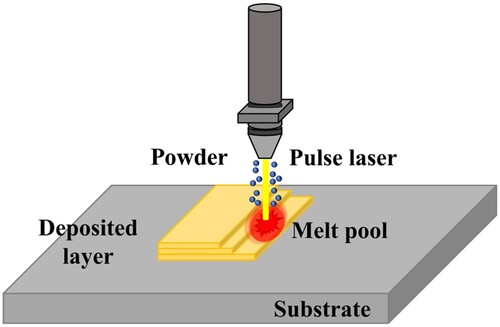
Figure 2. Classification of the major DED technologies. Adapted from Dass and Moridi [Citation45].
![Figure 2. Classification of the major DED technologies. Adapted from Dass and Moridi [Citation45].](/cms/asset/b4329c81-9bb2-43ed-b97d-8b6cc6869797/nvpp_a_2266658_f0002_oc.jpg)
PBF employs a high-energy electron beam or a high-intensity laser to selectively melt or sinter metal particles on a powder bed, which can be generally categorized into selective laser melting (SLM) (see ) and electron beam melting (EBM) (see ) depending on the energy source. Note that a more detailed classification of PBF technologies is shown in . The key distinction between SLM and EBM, in addition to the different energy sources used, is how the control energy flows along the predetermined path: SLM controls the laser beam movement through the lens while EBM focuses and deflects the electron beam through the use of a magnetic field. After the powder layer has been selectively melted, the platform slides down and recoats a new layer of powder on the molten surface, repeating the prior steps. To avoid oxidisation of metal powders at high temperatures, the SLM build chamber is usually filled with inert gas, while EBM requires a vacuum environment. PBF components typically have higher dimensional accuracy and lower surface roughness. In comparison to DED, the support in the powder bed is more conducive to the development of intricate internal structures, but this comes at the expense of fabrication efficiency, material consumption rate, and build size. Fabricating functionally graded materials using PBF also presents additional challenges compared to DED [Citation46, Citation47]. Note that PBF components include a broad variety of material flaws, including porosities and unfused defects [Citation34], which are often caused by poor interlayer bonding and complex thermal history [Citation48]. Moreover, the layer-to-layer bonding in PBF components may be poor if insufficient thermal energy is provided, making the build direction weaker than the scan direction. Residual stresses and processing flaws can significantly impact the mechanical properties of the build, thereby severely limiting the range of applications for AM constructs [Citation48].
Figure 3. Schematic diagram of SLM processing principle.
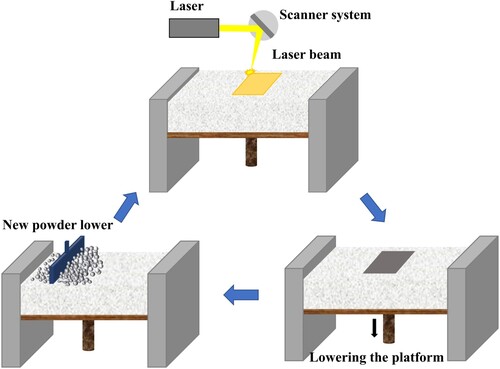
Figure 4. Schematic diagram of EBM processing principle.
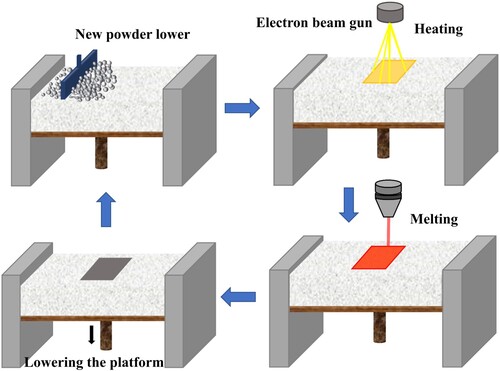
Figure 5. Classification of the major PBF technologies.
2.2. Common defects
The final microstructural features and defect generation in metal-based AM components are basically caused by the initial material properties as well as the variation of manufacturing parameters, such as laser power, layer development speed, powder morphology and injection parameters. Some common defects that may exist in metal powder-based DED and PBF include porosity, void, lack of fusion, inclusions, residual stresses, delamination, and cracks, as shown in [Citation12, Citation15, Citation21].
Figure 6. Some typical defects in a metal AM part [Citation15].
![Figure 6. Some typical defects in a metal AM part [Citation15].](/cms/asset/f865076d-666d-407e-b2d1-a7463c5ebfe7/nvpp_a_2266658_f0006_ob.jpg)
Porosity can be caused by contamination in the feedstock material, improper selection of manufacturing parameters which can lead to lack of fusion, the generation of vapours from the feedstock material constituents, incomplete melting and entrapped gas [Citation49]. Porosity is the most important defect that needs to be detected. Acting as a stress raiser, porosity in AM products can lead to the initiation of cracks and a decrease in the ability of materials to carry loads [Citation12, Citation21, Citation50]. Note that hot isostatic pressing can partially eliminate minor porosity but cannot handle large pores. In the DED process, a high powder flow rate can diminish the specific energy in the melt pool, thereby leading to increased gas entrapment [Citation5, Citation13, Citation51, Citation52]. In the PBF process, the interaction of the laser beam with the powders may trap gas pores and cause the lack of fusion during SLM [Citation53, Citation54]. The keyhole is the non-spherical porosity in the PBF process. These features may be more abundant and smaller than those encountered in the wrought or cast components [Citation55].
Void formation is mainly due to changes in the energy level of the laser or the electron beam. Interruptions in the powder supply can also result in in-layer voids. Once the formed voids are surrounded by successive passes in the same layer or subsequent layers, this makes the NDT very challenging [Citation14, Citation56]. Note that voids are often detected in the powder deposition AM processes [Citation4].
Lack of fusion is a common defect in AM parts caused by insufficient heating. The heat absorbed by powder particles is dependent on different parameters such as density, thermophysical properties, gas velocity, and shape, size distribution [Citation57]. If the newly deposited powder layer is not sufficiently heated and melted, it causes partial fusion with the previously deposited layer. Also, the lack of fusion defects can be caused by a high deposition rate or the selection of inappropriate manufacturing processes or process parameters [Citation58]. Note that once such a defect is identified, it can be eliminated during the manufacturing phase itself.
Inclusions are debris particles presenting in the feedstock or the building environment. They may also include partially melted particles and splashed constituents during the manufacturing process. These splashed constituents can hinder the movement of the laser beam at different positions, thereby affecting the quality of the surface, and they may also serve as defect-prone areas [Citation59]. If the inclusion size is larger than the thickness of the build layer, it can lead to improper adhesion between consecutive layers. The shape, size and distribution of the inclusions can affect the final properties of the parts.
Residual stresses can be understood through the temperature gradient mechanism. During heating, the power source creates local elastoplastic deformations and further induces tensile stresses in the irradiated area. During the cool-down phase of the molten top layers, thermal contraction gives rise to shrinkage and results in creating tensile and compressive residual stress zones [Citation60]. Residual stresses can cause severe geometric distortion and significantly alter mechanical properties [Citation61].
Delamination within the deposited layers is primarily caused by changes in melting temperature [Citation62]. This leads to the creation of residual stresses inside the parts, resulting in warpage formation and separation of the component from the build plate. In some cases, when manufacturing a large-scale component, bulking and fracture may also occur.
Cracks are considered discontinuous or disconnected regions in AM products due to residual stresses in the range of the yield strength. Cracks can be created by the presence of temperature gradients, especially when the thermal properties of the baseplate differ significantly from those of the building layers [Citation5]. In addition, large cooling rates can cause cracks and distortion. Note that the orientation of the crack with a higher aspect ratio leads to higher stress concentrations [Citation63].
Like powder-based DED and PBF, wire-based DED processes, mainly including WAAM and wire laser metal deposition, may suffer from some similar defects, such as porosity, lack of fusion, inclusions, and cracks. However, wire-based DED processes also exhibit typical defects more unique to them, such as spatter, undercutting, and burn-through. Spatter refers to the tiny metal droplets that are ejected from the welding torch during the WAAM process [Citation64]. These droplets can adhere to the surface of the component being fabricated, leading to unsightly defects. Undercutting defect arises when the molten metal fails to fully bond with the previous layer, resulting in a gap or hole [Citation17]. Another common defect, burn-through, occurs when the wire electrode melts through the bottom of the part being constructed, leaving a hole in the finished product [Citation65]. Typically happening during the deposition of the first layers, burn-through mainly affects the base metal [Citation17].
3. Non-destructive testing and in-situ process monitoring
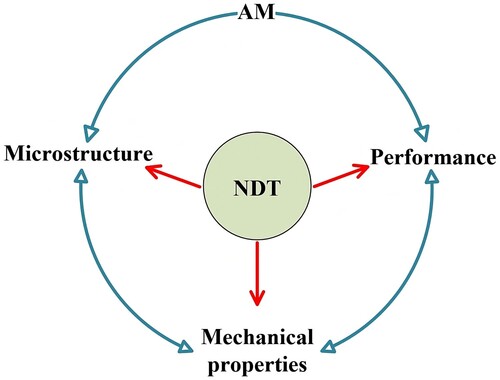
NDT techniques play an important role in AM, encompassing aspects from materials, process optimisation, and quality assurance to in-service inspection. AM components exhibit characteristics like fine microstructure and high anisotropy, which distinguish them from conventionally manufactured products. Different microstructures can influence both static and dynamic strengths. Microstructural analysis can connect NDT results, by identifying specific discontinuity signatures within the signals, to mechanical properties, thereby providing insights into the overall performance of the component [Citation13], as shown in .
Figure 7. Establishing the correlation between microstructure, mechanical properties and the performance of the component through NDT in AM.
The NDT techniques used for AM processes for metals and final parts primarily rely on properties like light, sound, heat, electricity and magnetism. This section highlights the most frequently used techniques, such as the image-based optical method, X-ray CT, AE testing, and UT, as discussed in the literature. These techniques are applied to damage detection and characterisation, as well as quality assurance. The main advantages and limitations of these NDT techniques are shown in .
Table 2. Analysis of state-of-the-art NDT techniques [Citation22, Citation66].
3.1. Image-based optical method
In image-based optical methods, images are taken at a high-speed rate using different types of detectors during the AM process [Citation4]. These captured images are processed by different algorithms to detect any abnormal features, which may indicate defects. Zhang et al. [Citation67] proposed an off-axis vision monitoring based on the high-speed camera with a waveband cut-off optical filter for the in-situ PBF process [Citation19], as shown in . A metal powder layer is deposited on a built platform by a roller, and then the metal powder is melted by the laser beam based on the predefined scan path to fill the 2D layer outline obtained from the CAD model. After one layer is finished, the built platform is lowered by one layer thickness and repeats these steps until the entire section is done. The CMOS camera is placed outside the SLM machine chamber. The collected image sequences are then processed by a novel image processing method that takes into account specific conditions of the PBF process and allows the melt pool, plume, and spatter to be segmented from each other. This showed a promising means to monitor and control the PBF process in situ.
Figure 8. Schematic of selective laser melting (SLM) process monitoring system [Citation67].
![Figure 8. Schematic of selective laser melting (SLM) process monitoring system [Citation67].](/cms/asset/22eaceef-9af2-4a4b-be25-1aeaf2f65086/nvpp_a_2266658_f0008_oc.jpg)
There is extensive research on image algorithms. For example, a low-coherence interferometric imaging technique has been integrated into an SLM system, enabling the inspection of process defects resulting from poor parameter regimes and the identification of characteristic fault signatures [Citation68, Citation69]. Abdelrahman et al. [Citation70] presented a technique for layerwise monitoring of the PBF process using optical imaging and 3D indexing. Lack of fusion in the size range of 0.05 mm and 0.75 mm can be inspected in each layer using the developed algorithm, which utilises the detection of changes in the current layer image due to varying light directions, as well as by comparing the current layer image with the previous one. Lu et al. [Citation71] developed image processing techniques that can identify and quantify features obtained from optical images during printing. This work validated the relationship between features present in optical images of 316L stainless steel specimens taken in situ and the mechanical properties of this printed SLM part. Building on this work, the authors further refined the algorithms associated with features and defect detection as well as specific correlations between features and local point damage in fabricated parts [Citation72].
The advantages of image-based optical methods include their non-contact nature, rapid image acquisition, and ease of implementation. However, these methods are primarily suitable for detecting surface defects, so integration with other techniques is necessary to detect deeper structural defects [Citation73]. To gather better image data, algorithms and tools require to be upgraded to enable automatic reception of information [Citation4].
3.2. X-ray computed tomography
X-ray computed tomography (CT) is one of the most widely used NDT techniques in different industrial applications. The elements of the X-ray CT system are the X-ray source, an array of detectors to measure the attenuation of X-ray intensity along a series of linear paths, and a rotational geometry relative to the object being imaged, as shown in [Citation15, Citation74]. Reconstruction algorithms are used to combine the 2D scanned images into a 3D model [Citation5, Citation75]. The obtained 3D model provides information about surface and internal characteristics as well as mechanical parameters.
Figure 9. The elements of X-ray CT system, including X-ray source, detectors, test object, and reconstruction algorithms. Adapted from Biswal et al. [Citation74] and Ramírez et al. [Citation15].
![Figure 9. The elements of X-ray CT system, including X-ray source, detectors, test object, and reconstruction algorithms. Adapted from Biswal et al. [Citation74] and Ramírez et al. [Citation15].](/cms/asset/f558ff06-f3d7-4184-8e53-60ebc973c98a/nvpp_a_2266658_f0009_oc.jpg)
The fundamental principle of the X-ray CT technique is based on X-ray attenuation as it passes through a test object. In reality, the interaction of X-rays with the test object involves several complex phenomena, including the photoelectric effect, Compton scattering, Rayleigh scattering, pair-production, and triplet-production [Citation76]. These interactions lead to X-ray attenuation, and the relationship between the material property of the test object and this attenuation is described by the Beer–Lambert law [Citation77]. The X-ray CT technique used for defect detection, density measurement, dimensional analysis, surface roughness analysis, and determination of pore distribution and morphology is a well-established practice, especially in AM for various applications [Citation78–86]. In this section, we focus on the investigation of damage detection and quality assessment of metal printed parts using conventional X-ray CT and synchrotron X-ray CT, as the obtained information can be used for failure simulations to improve future AM processes.
In conventional X-ray CT, Slotwinski et al. [Citation87] demonstrated that this technique is useful for determining porosity morphology and distribution. They found that the pores in CoCr disks manufactured by PBF are generally not spherical in shape. The results also showed the presence of cracks, usually found in samples with a large amount of porosity. Kim et al. [Citation88] used this technique to reveal pores and cracks ( μm) in a cobalt-chrome alloy fabricated by laser PBF (L-PBF) processes. The main difference in this work is the quantitative analysis, which relies on accurately segmenting X-ray CT images. Thus, methods for segmentation and image analysis should be established from the aspects of the image itself. Zhang et al. [Citation89] studied the characteristics of micro-cracks and porosity in L-PBF 316L stainless steel samples by changing the laser power (
). For 0.5
, the largest pore-equivalent spherical diameter detected by X-ray CT is 340 μm and for
and 1.3
, the largest pores are around 40 μm. At low input laser energies, areas of inconsistent density are characterised by the initial lack of fusion. At high input laser energies, regions of inconsistent density are induced by the turbulent melt pool. The porosity formed here is smaller than that of lack of fusion. However, the L-PBF part is more prone to causing thermal cracks in this region.
In synchrotron X-ray CT, Choo et al. [Citation90] further studied the impact of laser power on defect characteristics and the microstructure of L-PBF 316L stainless steel samples. Compared with conventional X-ray CT, synchrotron X-ray CT has shown significant advantages, such as improved contrast, fewer artifacts, spatial resolution below 1 μm, a higher signal-to-noise ratio (SNR), and faster capture rates, all of which are attributable to high beam brilliance, partial coherence and adjustability of the experimental setup [Citation20, Citation91–93]. It can be seen from that when the laser power is reduced from 380 W to 200 W, the defects increase significantly. Larger pores are preferentially distributed around the edges of the cylinder's circumference, while smaller ones are located throughout the volume [Citation24]. Additionally, synchrotron radiation micro-tomography has been utilised to inspect pore distribution, volume and morphology in L-PBF 316L stainless steel parts at the micron-scale under in-situ tensile loading [Citation94]. The results showed that porosity increases in the AM part built at a higher speed and the porosity distribution has a more substantial influence on the fracture mechanisms than the measured bulk density. Furthermore, in-situ synchrotron X-ray CT was employed to quantify the dynamics of defects and the molten pool in the laser AM process [Citation3]. This work elucidated the mechanisms of spatter and porosity form during the laser AM process, including pore migration, dissolution, dispersion and bursting [Citation94, Citation95]. The presented method can improve the understanding of AM processing technologies, addressing common issues such as porosity and spatter.
Figure 10. Synchrotron X-ray CT of the L-PBF 316L stainless steel cylinders (grey) and defects (red) using different laser power: (a) 380 W, (b) 320 W, (c) 260 W, and (d) 200 W [Citation90].
![Figure 10. Synchrotron X-ray CT of the L-PBF 316L stainless steel cylinders (grey) and defects (red) using different laser power: (a) 380 W, (b) 320 W, (c) 260 W, and (d) 200 W [Citation90].](/cms/asset/e1fffb15-a15f-4d6e-907e-9b8979906370/nvpp_a_2266658_f0010_oc.jpg)
The reliability of the X-ray CT technique relies on image quality, specifically, image contrast and resolution, which are determined by the penetration capacity of the X-rays, at least a minimum of 10 transmission [Citation5]. The X-ray energy, density and the presence of local discontinuities affect this penetration capacity. When X-rays enter a test object, they are attenuated due to the different absorption densities within the materials and scattering effects. These constraints have been observed in large objects and dense materials, where defect detection using X-ray CT may become less sensitive. Specifically, increasing the test object size can reduce the image resolution by limiting the maximum possible magnification of the scan [Citation23]. Lowering the magnification thus increases the scanned voxel size, which adversely affects the quality of the image. Additionally, the inspection of high-density materials proves more challenging than that of low-density materials due to reduced X-ray penetration. As a result, the size of the test object that can be inspected is further constrained by material density, often necessitating longer exposure times to achieve more reliable image contrast [Citation86].
Despite these limitations, the reliable and well-implemented X-ray CT technique is widely used for the inspection of the distribution and shape of porosity and cracks, as well as the determination of internal and surface parameters. Many researchers have compared X-ray CT with other NDT techniques like UT to determine the strength and scope of this technique. In the X-ray CT technique, it is important to reduce artifacts in images, improve low contrast-to-noise ratio images and feature extraction algorithms as well as develop new equipment. In particular, robust image analysis procedures (e.g. thresholding and segmentation), pattern recognition and object identification algorithms need to be developed to ensure reliable and quantitative measurements in the future.
3.3. Acoustic emission testing
Acoustic emission (AE) refers to the elastic waves generated by the energy released from sudden localised changes subjected to crack formation and propagation, plastic deformation, phase transformations, and stress generation mechanisms [Citation22, Citation84]. AE testing is a passive NDT technique, primarily consisting of two integrated components: the defect, which acts as the energy release source, and the sensors, which measure information from the generating sources [Citation69, Citation73]. This technology mainly includes signal generation, data acquisition, data processing, and decision-making like defect detection, as shown in . AE signals can be characterised by main features including rising time, energy, amplitude, duration, and ring counts. The values and intensity of each characteristic can differ owing to different defect types. Consequently, defect detection and characterisation of this technique rely on the acquisition and analysis of AE signals. The AE technique has been explored in numerous studies related to AM process and part monitoring, see . An acoustic sensor (marked blue in ) is fixed with a bolt below the build platform (marked yellow in ) [Citation56, Citation96]. This sensor is a massless piezoceramic sensor, and glycerol is used as a coupling agent to ensure reproducible coupling.
Figure 11. Schematic illustration of acoustic emission (AE) testing procedure for internal defect detection.
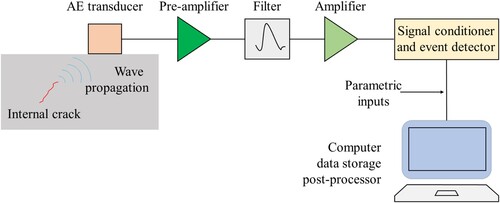
Figure 12. Test bench setup for AE during L-PBF [Citation96].
![Figure 12. Test bench setup for AE during L-PBF [Citation96].](/cms/asset/ae6e9231-3b04-4d8b-ac85-c61c35055eea/nvpp_a_2266658_f0012_oc.jpg)
AE signal acquisition can be carried out using piezoelectric transducers, fiber optic AE sensors and micro-electro-mechanical system AE sensors. The measurement performance of different AE sensors can be reflected by the quality factor. Noted that the mathematical expression of the quality factor of different AE sensors is different. A high-quality factor usually indicates high resolution and sensitivity. However, it cannot be too high, as this may restrict the sensor bandwidth and result in long decay for the input signals [Citation51]. Piezoelectric transducers are the most widely used and commercialised AE sensors. Traditional piezoelectric transducers are wired and lack independent power, making them unsuitable for online monitoring in harsh conditions. Therefore, wireless piezoelectric AE sensors with small battery-powered measuring equipment or energy harvesting have been developed [Citation97, Citation98]. For example, the single layer processing by the SLM has been monitored using a battery-powered proprietary measurement device, which can transmit acoustic waveforms via high-speed Wi-Fi [Citation39, Citation99]. The results demonstrated that the occurrence time and location of micro-defects within the SLM process can be inspected. Note that the limitation of this contact AE sensor is that it can only be used to monitor small printed parts due to the limited acoustic wave propagation distance.
In addition, many external factors can introduce noise to the AE signals due to the inherent characteristics of this technique and its associated instrumentation, such as frictional noise, environmental conditions and impact sources. Especially at lower frequencies, the environmental background noise can seriously interfere with the measured AE signals [Citation4]. Noise removal is therefore very important for AE testing, which consists of three main steps: (1) identifying the noise sources; (2) characterising the signals produced by the noise; (3) developing a method to separate or eliminate the noise [Citation73]. For example, the AE technique has been utilised to examine the corrosion behaviour of AlSi10Mg samples manufactured by the PBF process [Citation100]. In this work, a waveform entropy-based method was developed to denoise the signals, effectively addressing the issue where some low-amplitude signals might be misidentified as noise. Then the correction was made by analysing the characteristics of the peak frequency, peak amplitude and frequency centroid of the noise.
On this basis, other signal processing methods are utilised to further extract features and mine the information from the acquired signals to provide defect formation. Note that features include not only rising time, energy, amplitude, duration and ring counts, but also peak amplitude frequency, energy density, kurtosis and probability distribution. Conventional AE processing methods contain frequency-domain analysis, time-domain analysis, time-frequency domain analysis, wavelet packet transform, and continuous wavelet transform [Citation101]. For example, features in the frequency, time and time-frequency domain have been used to characterise the mechanisms of pores, lack of fusion and keyhole that occurred during the L-PBF process [Citation95]. Ramalho et al. [Citation102] investigated the influence of different material contaminants on the acoustic spectrum of the WAAM process and then analysed acoustic signals using the short-time Fourier transform and power spectral density. The obtained signatures were then utilised to characterise defect locations. Van Hemelrijck et al. [Citation103] first investigated the correlation of AE characteristics with fatigue crack defection under four-point bending tests of Ti6Al4V samples. These key characteristics indicate sensitivity to crack propagation monitoring, serving as a warning for potential fracture occurrence. Barile et al. [Citation104] proposed a new parameter called for characterising material properties under load by correlating cumulative acoustic counts and cumulative energy. This value is very effective for characterising the progression of defect propagation in AlSi10Mg specimens built by the SLM technique. In this work, the Hilbert spectrum and empirical mode decomposition were employed for signal analysis.
The main advantages of the AE technique include the capacity to inspect various active defects in a timely manner and to achieve global simultaneous detection without stopping the operation. The major limitation, however, is the sensitivity to weak signals and background noise, which can interfere with the measured signals. Therefore, it is necessary to develop novel transducers, such as ice encapsulation and air-coupled transducers, to enhance data acquisition. Additionally, there is a need to further advance the development of various signal processing methods and to integrate them with other monitoring techniques, such as optical imaging.
3.4. Ultrasonic testing
The above sections focus on image-based and AE NDT techniques, so now the discussion turns to the ultrasonic testing (UT) technique. UT is an effective tool for detecting and evaluating surface, subsurface and internal defects in different materials and structures [Citation21]. The sensitivity and resolution of UT for detecting defects increase with the increase of test frequency, but the signal attenuation also increases, resulting in a decrease in the detectable depth. Broadly, UT can be categorised into conventional UT and advanced UT (e.g. phased array, laser ultrasonics, and air-coupled ultrasonics). Depending on the detection scenario, UT testing can be conducted using either contact or immersion mode. Ultrasonic waves can be either bulk waves or guided waves, with piezoelectric transducers being the most commonly used method for both excitation and reception. Other means of exciting ultrasonic waves include laser ultrasound [Citation101, Citation105–107], electromagnetic acoustic transducers (EMATs) [Citation108], magnetostrictive transducers [Citation109, Citation110] and capacitive micromachined ultrasonic transducers (CMUT) [Citation1]. Unlike conventional UT, which uses a single piezoelectric crystal to excite and receive ultrasonic waves, ultrasonic phased array probes consist of multiple elements arranged in a specific pattern, such as a linear, square, or circular pattern [Citation6]. Laser ultrasonics works by projecting a laser beam onto the object's surface, thereby generating thermal shock or ablation [Citation111], which results in the rapid expansion of the test surface and excitation of ultrasonic waves. Another non-contact form is air-coupled ultrasonics, which eliminates the inherent limitations of contact ultrasound by using air as the coupling medium [Citation107, Citation112]. Note that air-coupled ultrasonics has not been widely used in the detection of AM parts due to the large acoustic impedance mismatch between the solid test object and air, leading to substantial energy loss [Citation112, Citation113].
In conventional UT, Nadimpalli et al. [Citation62] used UT in immersion mode to understand the evolution mechanism of inter-layer defects (e.g. delamination or kissing bonds) and inter-track defects in Aluminum printed samples. Ultrasonic A-scan measurements were conducted during the AM manufacturing process. A two-parameter wave propagation model proposed in Nadimpalli et al. [Citation114] was utilised to investigate the interaction between AM components and the measured ultrasound data. UT proves to be a versatile tool for assessing the quality of AM parts, both in situ during the fabrication process and after completion. Rieder et al. [Citation115] presented a reconstructed B-scan image based on the synthetic aperture focusing technique (SAFT). The results clearly showed the marks in the vertical direction, however, from the tilted markers, only the signal diffracted at the edges can be detected.
In ultrasonic phased array testing, Lopez et al. [Citation116] evaluated its effectiveness for detecting defects in aluminium arc-DED parts with various degrees of surface finish. Phased array probes can overcome limitations caused by sample surface roughness with a maximum mean waviness profile of 89.6 μm. Moreover, artificial defects ranging from 2 mm to 5 mm, created by drilling flat bottom holes, were detected, with their size, shape, and location accurately determined. Due to a lack of specifications and standards for phased array inspection of arc-DED specimens, a calibration method and step-by-step inspection strategy combined with the total focusing method (TFM) were introduced [Citation59], which are then used to evaluate the shape and size of intentionally embedded defects (i.e. Φ 1 mm-3 mm tungsten-carbide balls) [Citation117], as shown in . Note that the TFM can be performed in real-time, during the scanning, or offline using the full matrix capture data. Chabot et al. [Citation118] focused on the multi-sensor monitoring method specific to DED processes to track damage formation during manufacturing. Subsequently, ultrasonic phased array testing was cross-checked by X-ray CT, which demonstrated that the phased array inspection can detect side-drilled holes ranging from 0.6 mm to 1 mm in aluminum alloy parts fabricated by the DED process. This work showed that real-time monitoring of DED processes is feasible since the phased array testing can be integrated into the manufacturing environment, providing field data and operating at a computational time compatible with real-time applications. Rao et al. [Citation119] proposed an ultrasonic imaging technique based on the elastic least-squares reverse time migration (RTM) with the consideration of density and longitudinal- and shear-wave velocity variations to image defects in heterogeneous structures. In this work, a multi-material part consisting of Ti6Al4V and 316L stainless steel with the interlayer of K220 copper alloy fabricated by L-PBF was used to validate the performance of this method. Note that the artificial interface defect with the sizes of 2 mm × 1 mm is located between Ti6Al4V and K220 copper alloy (see ). Furthermore, Rao et al. [Citation120] proposed a two-stage ultrasonic phased array method to detect the internal structure to better understand the effect of AM process parameters on material defects in multi-material parts. In the first stage, the velocity model is reconstructed using a gradient sampling full waveform inversion (GSFWI) algorithm at the low frequency, which is then used as an initial model for high-frequency RTM, aimed at small defect detection. Experimental results demonstrated the accurate reconstruction of interfaces and flaws induced by reducing laser power in multi-material DED parts.
Figure 13. (a) Arc-DED manufacturing process and (b) ultrasonic phased array inspection using (c) the total focusing method (TFM). Adapted from Javadi et al. [Citation117].
![Figure 13. (a) Arc-DED manufacturing process and (b) ultrasonic phased array inspection using (c) the total focusing method (TFM). Adapted from Javadi et al. [Citation117].](/cms/asset/79da4c25-3d1e-4b7f-ad63-575cef854e40/nvpp_a_2266658_f0013_oc.jpg)
Figure 14. (a) Experimental setup for ultrasonic phased array testing. Elastic least-squares RTM images of (b) longitudinal wave velocity, (c) shear wave velocity, and (d) density in the multi-material part of the experiment. Adapted from Rao et al. [Citation119].
![Figure 14. (a) Experimental setup for ultrasonic phased array testing. Elastic least-squares RTM images of (b) longitudinal wave velocity, (c) shear wave velocity, and (d) density in the multi-material part of the experiment. Adapted from Rao et al. [Citation119].](/cms/asset/acd16c1a-189b-4b40-bac5-2da85ea74574/nvpp_a_2266658_f0014_oc.jpg)
In laser ultrasonics, Lv et al. [Citation121] presented a laser ultrasonic-based defect detection method to accurately detect and quantify subsurface damage in fabricated AlSi10Mg and 316L stainless steel parts, as shown in . A new strategy for rapid damage localisation using Rayleigh waves and circular scanning was proposed and then a 3D SAFT using raster scanning was used to focus localised damage regions to detect subsurface damage with varying types and sizes. Chen et al. [Citation122] showed a laser ultrasound imaging method to provide online monitoring of AM processes. In this work, a rapid screening inspection was used to improve detection efficiency but has limited resolution compared with conventional point-by-point C-scan. Additionally, a surface wave focusing algorithm was proposed to address the low SNR issue induced by rough surface signals [Citation2]. Note that surface roughness is a vital consideration in laser ultrasonic measurement, so remelting (i.e. utilising a printing laser) is often employed to smooth the surface before taking measurements. In another study, Liu et al. [Citation123] detected defects in 3D printed Nickel and Titanium-based alloy samples using an optical interferometer to measure the excited ultrasonic waves. Experimental results showed that the diameter of defects larger than 300 μm can be inspected, which was verified by the X-ray CT. Meanwhile, Zhang et al. [Citation124] established a laser ultrasonic C-scan imaging system that was utilised to inspect surface flaws on SLM samples with different surface roughness. To accurately measure the defect length, an autosizing approach using the maximum correlation coefficient and lag time method was proposed. Furthermore, the influence of surface roughness on the distribution of laser ultrasonic SNR and the measurement accuracy of defect size were investigated. The results demonstrated that this system can inspect holes with a diameter of 50 μm and notches with a depth of 50 μm. Note that laser ultrasonics offers a distinct advantage for online monitoring of high temperatures in the AM process due to its non-contact nature.
Figure 15. (a) Laser ultrasonic imaging system and (b) schematics of 3D imaging of subsurface defects [Citation121]. Note that DAQ and LDV stand for the high-speed data acquisition and laser Doppler vibrometer, respectively.
![Figure 15. (a) Laser ultrasonic imaging system and (b) schematics of 3D imaging of subsurface defects [Citation121]. Note that DAQ and LDV stand for the high-speed data acquisition and laser Doppler vibrometer, respectively.](/cms/asset/d3e8a23f-9ae1-4bac-ae4e-a1098732ad1a/nvpp_a_2266658_f0015_oc.jpg)
The primary advantage of UT is its ability to penetrate most metals to a depth of several meters, allowing for the detection of deep defects. Some of the limitations of UT can be mitigated through the use of signal and image processing methods [Citation6]. However, UT is often suitable for detecting relatively simple geometries of AM parts. As such, substantial effort will be required to develop new UT techniques and define specifications for procedures that can handle more complex AM parts. Other advantages and limitations are shown in .
3.5. Infrared thermography
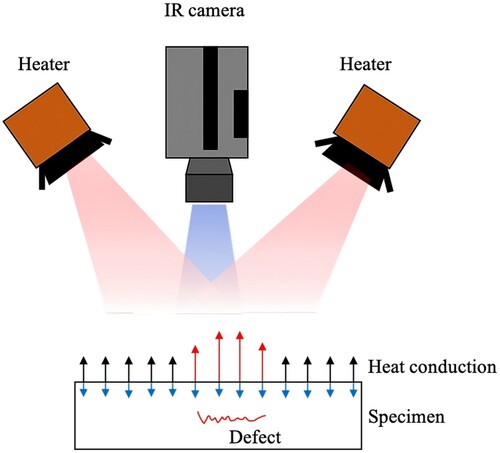
Infrared thermography uses heat diffusion within materials to evaluate material properties, including defects, optical absorption coefficient, coating thickness, and thermal diffusivity [Citation125, Citation126]. The surface temperature is captured by thermal cameras, and the heat source that forces the thermal diffusion can either be passive or active [Citation85, Citation127]. As a result, infrared thermography is categorised into passive infrared thermography and active infrared thermography (see ), depending on the reliance on external heat sources. Passive infrared thermography is typically used for structures and materials whose temperature is different from the operating environment and that are not in thermal equilibrium. This technique is well-suited for cyclic loading, as the hysteresis heat generated allows for time-dependent temperature changes [Citation128]. For example, Sreedhar et al. [Citation129] used the passive thermography method to inspect porosities in aluminum alloy 2219 welding. The smallest detectable defect size shown in this work is 0.6 mm × 0.4 mm.
Figure 16. Schematic illustration of a typical reflection test setup of active infrared thermography.
Compared with passive infrared thermography, active infrared thermography is more widely used in defect detection for AM components. Typical external heat sources include optical radiation (e.g. halogen heat lamps), ultrasonic waves, eddy currents, and microwaves [Citation18, Citation130, Citation131]. Optically stimulated thermography uses different optical excitation sources to generate thermal waves, such as pulsed thermography and lock-in thermography. Various signal processing algorithms have been developed to decrease noise in thermal images captured by infrared (IR) cameras [Citation132–134]. Ultrasonic stimulated thermography utilises generated vibrations in the test object to induce frictional heating at defects, like cracks. Compared with optically stimulated thermography, this technique is more suitable for detecting deep defects in the early stages [Citation135, Citation136]. Eddy current stimulated thermography induces eddy current excitation in conductive materials to generate induction heating measured by IR cameras. This technology can be used to detect flaws located at a certain depth, not limited to the surface of the specimen [Citation137, Citation138]. Microwave thermography employs electromagnetic radiation with different frequencies to produce heat owing to the dielectric loss of materials [Citation18, Citation139, Citation140]. Note that in addition to utilising heat sources, cold sources such as water jets and liquid nitrogen may be of interest. However, the main limitation of cold stimuli is related to practical considerations, since heating parts is usually easier and more efficient than cooling them [Citation141–143].
Mireles et al. [Citation144] demonstrated that in-situ active infrared thermography can detect critical porosity and other defects in PBF specimens during fabrication and compare them with results obtained using X-ray CT. The in-situ correction strategies are combined with an automated closed-loop feedback control system to correct detected damage during part fabrication with a PBF system [Citation58]. This method was unable to detect smaller defects ( μm) shown in this work, but could be improved by using higher resolution cameras and optics. Kolb et al. [Citation145] analysed the suitability of optically stimulated thermography of an Inconel 718 sample fabricated by PBF in an ex-situ environment. The front view (specimen surface, inset artificial defects) and the rear view (open artificial defects) of the specimen were compared, as shown in . This technique can detect open defects with diameters of 2000 μm, 1000 μm, 500 μm, and 300 μm (see (b)). However, the ability to detect artificial defects is limited due to the high thermal diffusivity of metal substrates (see (a)). They found that this technique is suitable for detecting surface inhomogeneities (e.g. exposed defects and melting tracks) on the PBF Inconel 718 specimen. The detection sensitivity decreases with an increasing depth of inspection, limiting the ex-situ infrared thermography applications. Furthermore, the laser scanning thermographic technique has been applied to detect micrometric defects in Inconel 600 samples [Citation146]. The advantage of this technique is that it is robust and easy to set up. The limitation is that the scanning surface may need to be painted to improve the absorption of radiant energy, as presented in this work. This technique was further applied to a more complex actual AM acetabular cup prosthesis made of titanium alloy with ad hoc damage (diameter of 0.7 mm) to verify the effectiveness of defect detection [Citation147].
Figure 17. Thermograms of the PBF specimen made of the Inconel 718. (a) Front view and (b) rear view [Citation145]. Note that black circles indicate defect outlines.
![Figure 17. Thermograms of the PBF specimen made of the Inconel 718. (a) Front view and (b) rear view [Citation145]. Note that black circles indicate defect outlines.](/cms/asset/a67cdcae-eed3-48a4-b266-baa208363499/nvpp_a_2266658_f0017_ob.jpg)
Optically stimulated thermography is the most commonly used thermal imaging method in AM. The advantages of this method include its non-contact nature, rapidity, and relatively low cost. However, it is not sensitive to deep defects and micro-cracks ranging in size from ten microns to several millimeters. Therefore, ultrasonic stimulated thermography has the potential to provide rapid and accurate quantitative detection of micro-cracks because of frictional heating induced by the interaction of defects with ultrasonic waves [Citation18]. But ultrasonic excitation may require high power to generate waves. Also, eddy current stimulated thermography is a good option as it is sensitive for detecting and characterising surface and subsurface defects of various metallic materials and structures, such as surface cracks. However, the effect of non-uniform heating needs to be considered. Additionally, pattern recognition using different image detection algorithms to inspect patterns linked with thermal peaks needs to be studied in further work on infrared thermography [Citation15].
3.6. Machine learning based NDT techniques
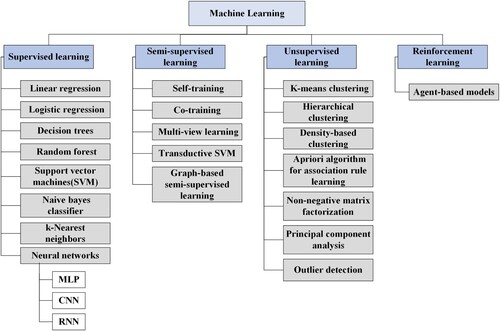
Machine learning (ML) algorithms have been applied in many fields, and there is a growing research trend to combine ML algorithms with AM processes [Citation148]. ML can be categorised into supervised (e.g. support vector machines (SVM), convolutional neural network (CNN)), unsupervised (e.g. K-means clustering, principal component analysis (PCA)), semi-supervised, and reinforcement learning based on the input data type used to train the algorithm [Citation2, Citation122], as shown in . This section focuses on ML algorithms applied to the previously mentioned NDT techniques, demonstrating strong potential in areas such as defect detection, process parameter optimisation, and quality prediction.
Figure 18. Types of machine learning based on input data used to train the algorithm. Note that MLP, CNN and RNN stand for multilayer perceptrons, convolutional neural network and recurrent neural network, respectively.
The traditional optical image inspection process relies on manual recognition, which suffers from inefficiency and potential bias [Citation13]. To improve upon this method, researchers have explored the use of CNN to automatically recognise defects in AM. Specifically, Cui et al. [Citation149] applied a CNN model to optical images to detect the lack of fusion, cracks and gas porosity, as shown in . The results demonstrated that the CNN model can be used to automatically recognise defects in AM products. Similarly, Zhang et al. [Citation150] presented a hybrid CNN approach for PBF process monitoring using raw images. This method can automatically learn temporal and spatial representative features from images with minimal image processing effort. Since this approach reduces the need for image processing steps, it simplifies the feature extraction procedure, making it more suitable for online monitoring applications. Going beyond just detecting defects, Garland et al. [Citation151] used a CNN algorithm to directly link optical imaging to the performance of the AM metal lattice. This work provides a useful tool to monitor the AM lattice quality using a simple ML algorithm based on one to three optical images, enabling rapid lattice screening. Importantly, this ML strategy accurately estimates product performance metrics, not just detects the presence of damage. However, this study did not focus on layer-by-layer monitoring during the build process using image data collected by cameras inside the build chamber [Citation152], and instead used optical images obtained directly from the final product (ex-situ). Moreover, a bi-stream deep CNN was proposed to identify images from the SLM process for the online defection of damage, aiming to improve process monitoring and quality control. Impressively, this developed method achieved 99.4 accuracy in recognising SLM defect conditions [Citation153].
Figure 19. (a–d) Optical images of laser metal deposition build metal parts and (e–h) corresponding attention maps [Citation149]. Note that defects are marked in red circles and rectangles.
![Figure 19. (a–d) Optical images of laser metal deposition build metal parts and (e–h) corresponding attention maps [Citation149]. Note that defects are marked in red circles and rectangles.](/cms/asset/26791b55-f7d8-487e-af00-ca4735056ee3/nvpp_a_2266658_f0019_oc.jpg)
In addition to the use of CNN algorithms for defect detection, other researchers have proposed the one-stage object detection method -- you only look once (YOLO)-attention, in which the algorithm can classify and regress data only once [Citation154, Citation155]. Li et al. [Citation156] further optimised YOLO-attention specifically for the detection of small defects (e.g. surface pores and inclusions as small as approximately 1 mm) in WAAM components, using optical images as input. The proposed model structure, consisting of the backbone network, feature pyramid network, multiple spatial pyramid pooling and detection layer, significantly improved the ability to detect small defects. Experimental results indicated that this model with high precision and high efficiency can be applied to practical WAAM industrial production.
In X-ray CT, Snell et al. [Citation157] applied a K-means clustering algorithm to this NDT technique. This proposed solution is effective for detecting keyholes and lack of fusion with sizes of tens of microns in Ti6Al4V, Ti-5553, Inconel 718 and Haynes 282 samples fabricated by the SLM process. Montazeri et al. [Citation158] used features extracted from the graph Kronecker product as inputs for the SVM algorithm to predict the severity of the average length (tens to hundreds of microns) of lack of fusion in a layer of DED Ti6Al4V samples obtained from the X-ray CT. Addressing the traditionally time-intensive nature of segmenting X-ray CT images for porosity analysis, Gobert et al. [Citation159] combined a CNN with Otsu thresholding to create a named Automated Computed Tomography Segmenter that can automatically segment porosity from X-ray CT images of metal AM samples. Wong et al. [Citation160] further studied automatic defect segmentation of X-ray CT images using a U-Net CNN to detect pores and cracks in AM fabricated metal specimens. Additionally, this novel image segmentation method using the U-Net CNN has been used for the removal of adhered particles on L-PBF fabricated lattice structures from X-ray micro CT [Citation161].
Similar to the use of CNN in previously mentioned NDT techniques, the combination of CNN with AE testing has also emerged as a notable research interest. For example, signals recorded during the DED process were analysed by ML algorithms to classify different build conditions [Citation162]. Initially, an estimate of classification was made using the average of the peak amplitude and centroid amplitude divided by frequency. The next step involved applying the Morlet wavelet transform to the signals, displaying the distinguishable data classes and providing a foundation for implementing CNN. Following this, CNN was applied to recognise the transformed spectrum for various build conditions. Finally, statistical methods were used to correlate identifiers in the AE signals with the AM part quality. Furthermore, Shevchik et al. [Citation163] combined fiber Bragg gratings as AE sensors with spectral CNN techniques to build a classifier to distinguish measured signals. AE testing provides different signatures for different AM qualities. Despite the high noise level of AM machines, the extracted features are differentiable in ML techniques.
Besides CNN, a deep belief network (DBN) has been proposed for defect detection using acoustic signals during the SLM process. The advantage of the DBN method is that it can extract high hierarchical information from raw acoustic signals, so there is no need for feature extraction and data pre-processing [Citation164]. This approach outperforms both SVM and multilayer perceptrons (MLP) and shows generalizability among damage patterns from experiments with random parameter combinations. Therefore, this work provides a simple, feasible and effective tool for realising process monitoring and damage inspection in the SLM process. Gaja and Liou [Citation165] developed a new defect monitoring system for inspecting cracks and porosity that occur in the laser metal deposition process using AE testing and unsupervised K-means clustering combined with PCA. This work demonstrated that signal energy is a key feature for detecting and recognising the AE damage source mechanism. Gaja and Liou [Citation166] further studied the ability of AE testing using an artificial neural network (ANN) and a logistic regression model to detect and characterise defects (e.g. a gas porosity with the size of about 70–80 μm) that occur during laser metal deposition. Then, AE characteristics (e.g. peak amplitude) and statistical features were extracted and analysed, as well as a fast Fourier transformation analysis of the AE signals was performed. The results of the logistic regression model were compared with these of the ANN model, and both models agree well with the cluster analysis technique [Citation34]. Consequently, both models demonstrate robust capabilities in laser metal deposition monitoring, allowing for the detection of damage that could significantly reduce the strength and reliability of the deposited components. Mohammadi et al. [Citation167] used three ML algorithms in conjunction with AE testing to inspect damage in steel components fabricated by the L-PBF. Hierarchical K-means clustering was utilised to train a supervised deep learning network classifier to inspect L-PBF damage. Then, PCA and anomaly detection techniques to decrease the data dimension. A rapid inspection method for the online monitoring and control systems of L-PBF was developed by fitting the reduced data to a Gaussian mixture model [Citation15]. The third ML technique employed a variational autoencoder for the AE signals as a feature extractor module. A deep learning classifier is utilised to generalise the inspection approach. The accuracy of the classifier was validated by AE signals obtained from L-PBF 316L stainless steel parts.
Ultrasonic measurements of metal-based AM components with rough surfaces remain difficult, as the surface decreases the SNR of the signals, thereby reducing the UT performance. Ganster et al. [Citation168] used CNN, deep neural network (DNN) and MLP to efficiently extract damage features, even from ultrasonic echo signals with low SNR and studied the performance in the evaluation of porosity in Ti samples manufactured by SLM with rough surfaces. Different porosities, with sizes on the order of microns, were evaluated by a fully connected DNN trained on raw ultrasound signals measured from SLM specimens [Citation169]. This model demonstrated an average test accuracy of 93 for porosity assessment. The results showed that the porosity assessed by the pre-trained model can agree with that measured by conventional scanning acoustic microscopy, therefore having the potential of deep learning-based ultrasonic detection for the porosity assessment of AM parts. In ultrasonic phased array testing, Rao et al. [Citation170] proposed a data-driven fully convolutional network (FCN) based ultrasonic inversion to directly establish a non-linear mapping from ultrasonic signals to the compressional wave velocity model. This supervised method enables accurate quantitative reconstruction of compressional velocity models for high-contrast cracks ranging in length from 2 mm to 5 mm, which shows great potential for the real-time damage inspection of AM parts. In laser ultrasonics, the strong background noise caused by the rough surface of AM parts reduces the detection probability of the traditional laser ultrasonic inspection system. Xu et al. [Citation171] proposed a denoising algorithm using unsupervised ML (K-means cluster and denoising autoencoder), and used abundant ultrasonic signals for training to improve the SNR. The efficacy of this method was validated using holes on rough surfaces (average roughness of 7.5 μm of SLM components. Building on this, they merged laser ultrasonics with ML to detect surface defects in SLM fabricated 304L stainless steel. The features of each ultrasonic signal were extracted by PCA followed by a trained ANN classification. The proposed multi-feature fusion imaging method can greatly improve imaging quality and defect detection capabilities, avoiding the traditional C-scan images that only have amplitude. The experimental results showed that pores with diameters of 50 μm and 100 μm can be inspected by the obtained high SNR C-scan.
In infrared thermography, improving the thermal image quality is important. Zhang et al. [Citation172] developed sparse coding and K-means singular value decomposition ML algorithms to improve the thermal image quality by removing additive white Gaussian noise without blurring the image. The results demonstrated that this proposed method can effectively detect the smallest defect (i.e. hemispherical-shaped unsintered powder area) with a diameter of 3 mm at a depth of 1 mm in the 316L stainless steel PBF printed parts. However, thermographic inspection sensitivity can often be compromised by noise. On this front, Zhang et al. [Citation173] studied the signal separation from the noise using ML methods (spatial–temporal blind source separation and spatial–temporal sparse dictionary learning methods). The performance of this proposed method was validated using thermography data obtained from L-PBF 316L stainless steel and Inconel 718 specimens containing imprinted porosity with a diameter of 1 mm located at 1 mm depth. The ML-based thermography shows higher accuracy but it requires a longer runtime. Diverging slightly, Baumgartl et al. [Citation174] combined a CNN with thermographic images of H13 steel specimens made by L-PBF processes to detect defects like delamination and splatter. The results showed that the average accuracy of defect detection can reach 96.8. In another innovative approach, Chen et al. [Citation175] used passive infrared thermography with the AlexNet model, stack temperature field, and the pixel width curve to real-time detect defects during the manufacturing process. This method can adjust the processing parameters of the next layer according to the detection information of the current layer, and realise the closed-loop feedback of the AM process. Jeon et al. [Citation176] developed an online melt pool depth estimation technique for DED processes using passive infrared thermography and ANN. Melt pool depth is a critical factor that determines the metallurgical bond between layers during the manufacturing process. The overall root mean square error of the melt pool depth estimate is about 25.97 μm. These results showed the effective potential of the developed technique for DED process monitoring.
3.7. Other NDT techniques
This paper mainly focuses on image-based, acoustic and thermography methods. In this section, other NDT techniques that have been applied to AM are only briefly introduced. For example, eddy current testing (ECT) uses the electromagnetism principle to non-destructively evaluate the damage in conductive materials by measuring the change of induced eddy current in the test object, as shown in [Citation25, Citation177, Citation178]. ECT can be the right choice for in-situ process monitoring technology of AM process and for damage detection and characterisation of metal AM products. ECT equipment was first integrated into a PBF machine for layered monitoring of the relative density of components during production [Citation179]. During the PBF process, AlSi10Mg parts with different relative densities are measured layer by layer using an ECT system mounted on a mechanical recoater. Additionally, data analysis methods were used to efficiently separate and calibrate relative electrical conductivity and lift-off of the measured signals. Bento et al. [Citation180] focused on the in-line layer-by-layer inspection of damage in aluminum specimens printed by WAAM using ECT. The results showed that the developed ECT is capable of locating artificial defects with a depth of up to 5 mm and a thickness as small as 350 μm, with a probe up to 5 mm from the test object surface. Ehlers et al. [Citation181] discussed the applicability of ECT using magnetoresistive sensors to L-PBF parts. Compared with conventional signal processing, the heterodyne principle minimises metrology efforts while preserving damage information. Experimental results showed that the proposed method can inspect artificial surface defects with a size of 100 μm in 316L stainless steel powder printed samples.
Figure 20. Principle of eddy current testing.
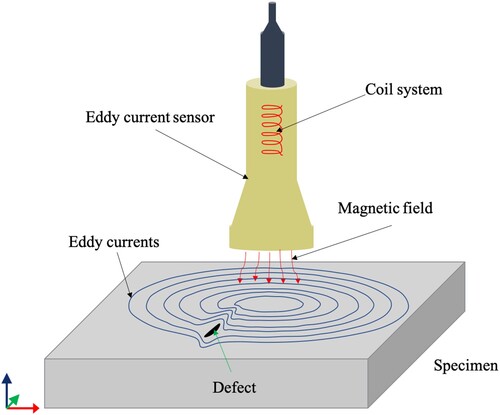
ECT plays an important role in detecting both ferromagnetic and non-ferromagnetic materials at high speeds, reaching up to 150 m/s, without making contact with the material's surface [Citation182]. However, only the surface and subsurface defects can be inspected using commercial ECT. The main disadvantage of applying ECT to AM parts is related to the overall surface roughness, as it is difficult to distinguish signals of cracked or scratched regions from signals of the noisy smooth surface.
Besides ECT, penetrant testing uses capillary phenomena to detect the surface damage of AM parts. This testing method is highly sensitive to defects that open on the surface, such as tiny cracks [Citation4]. However, it is not suitable for inspecting rough or porous AM parts that have not been post-processed or polished. Compared with other NDT techniques, penetrant testing is rarely used to detect AM printed components.
Additionally, NDT techniques are utilised for geometry monitoring and control during the manufacturing process. It is crucial to recognise the correlation between geometry attributes and process parameters [Citation46]. Yang et al. [Citation183] developed a real-time layer height estimation NDT technique using a vision camera, laser line scanner and domain adaptive neural networks. This technique is specifically targeted at layer height estimation at sharp corners during multi-layer deposition [Citation2]. Experimental results demonstrated an accuracy of 25.7 μm in estimating layer height, even when layers with an average height of 250 μm were deposited at corners with varying angles.
4. Discussion and future direction
This article analyses various NDT techniques, including the image-based optical method, X-ray CT, AE testing, UT methods, infrared thermography, machine learning-based methods, eddy current and penetrant testing. The advantages and disadvantages of each method are outlined in . It is important to note that no single NDT technique can detect all types of damage in 3D printed parts, but a combination of NDT techniques has the ability to provide complementary information to assess part integrity. These combined NDT techniques are essential for improving the reliability of the inspection of multiple types of defects, which will have the potential to expand the applications of artificial intelligence algorithms to produce critical structural parts. Building on this foundation, the development of an effective and efficient damage inspection system is a key driver for next-generation technologies in AM [Citation27].
| (1) | Suitable sensing network. Sensor measurements in AM reflect external factors (e.g. operating conditions) or structural behaviour. The measured sensor data should be defect-sensitive to be directly related to the state of the AM processes and components. In practical applications, according to the different AM processes and final products to be detected and monitored, we should select the suitable sensor types (e.g. suitable to high temperature), quantities and placements, and determine the sensor's sensitivity, measurement accuracy, power demand, excitation source for the active sensing, installation constraints, etc. In the further development of the sensing network used in AM, it is also important to incorporate innovations such as smart materials (e.g. self-powered and self-sensing) and wireless data transmission. | ||||
| (2) | Data fusion. When single sensors cannot meet the detection requirements of AM, multiple types of sensors can be used in combination. The challenge then becomes how to integrate different sensor data effectively. The data fusion rule can be carried out according to the sensor types, data quality, application environment, and level of data fusion. At the low level of data fusion (i.e. signal/pixel level), raw signals and/or images from sensors are registered and combined for subsequent inspection and monitoring of AM processes and products. A medium level (i.e. feature level) means that the characteristics extracted from the raw data obtained from sensors are fused for further analysis. At the high level of data fusion (i.e. decision/symbol level), various symbols of process parameters with uncertainty measurements are integrated to make a combination decision. In general, robust and reliable data fusion designs are mostly task-oriented (the specific AM technique for a specific application). | ||||
| (3) | The development of advanced algorithms. In-process signal processing and defect detection and characterisation rely on advanced algorithms. Because the distribution of defects is relatively random and there are many different types of defects, it is difficult to implement only one NDT technique in actual AM detection. Therefore, it is important to develop advanced algorithms that can handle multi-type signals simultaneously. Whether it is a combination of multiple conventional NDT techniques or a mixture of NDT techniques and hybrid ML algorithms will play an increasingly essential role in the AM field. For example, elastic wave-based (model-driven) ML algorithms can improve detection accuracy and reduce the requirement for measured ultrasonic data. In addition, transfer learning and digital twins can be combined with NDT techniques to improve the detection range and efficiency. | ||||
| (4) | Online and in-situ NDT: NDT is crucial for AM at all stages, and the inspection regime needs to encompass not only the geometric distortion and inner defects but also the microstructure and material property variation. However, current NDT techniques face challenges in AM, particularly in online and in-situ inspection during the manufacturing process. Additional factors such as temperature variation, powder scattering, surface condition, and sensor integration need to be considered. When well-established and implemented, online and in-situ NDT methods can help stabilise and enhance the quality of AM products by providing instantaneous feedback for corrective actions in various manufacturing processes. | ||||
| (5) | Robot technology-assisted real-time NDT. For example, different types of sensors can be mounted on the robotic arms and move with the arc torch, combined with the previously mentioned data fusion and advanced algorithms to monitor the WAAM process in real time. A digital delay generator can be used to synchronise all devices used in real-time NDT. | ||||
| (6) | Real-time automatic feedback control and correction system. This system consists of sensor data, data processing with advanced algorithms, defect detection and characterisation, and product quality evaluation. Effective ways to mitigate the impact of defects can be achieved by correcting defects when they are initially inspected or when defects are predicted before they occur. Therefore, it is important to develop real-time automatic control and correct systems to achieve this goal. The reconstruction of defects is based on previously mentioned advanced algorithms. After obtaining the defect information, the corresponding printing parameters like laser speed and laser power can be modified to remove the defects of the next printing layer. | ||||
5. Conclusions
The NDT techniques applied in additive manufacturing (AM) are important to ensure efficient component formation and accurate and uninterrupted material deposition. The implementation of NDT techniques for metal-based AM has many benefits, including but not limited to:
| (1) | Improving the quality of AM components by reducing defects; | ||||
| (2) | Reducing uncertainty (e.g. variations of material properties) and improving reliability by adopting online NDT; | ||||
| (3) | Reducing material waste and CO2 emission through the early detection of defects during manufacturing. For example, we can repair defects during manufacturing once a defect is defected through feedback control. In more severe cases, it may even be prudent to halt the AM process midway instead of waiting for its completion; | ||||
| (4) | Replacing or complementing the current certificate process which is mainly done by destructive testing. For example, yield strength and Young's modulus can be estimated by NDT techniques rather than the current destructive tests done for the certification; | ||||
| (5) | Optimizing maintenance and reducing costs by determining optimal detection, maintenance, and repair schedules based on ‘as needed’ when the monitoring data of AM indicate; | ||||
| (6) | Predicting future performance based on past and current AM monitoring data. | ||||
Different AM processes and components require a thorough and comprehensive review of different NDT techniques to ensure accurate and efficient detection. Based on the analysis of the state-of-the-art works, it can be concluded that these techniques are still developing, and new sensors, signal processing and imaging algorithms are required to improve the reliability, accuracy, and efficiency of the different techniques. For example, the development of novel, flexible sensors will help to detect AM printed structures with complex surfaces. In signal processing, more methods to improve the SNR are required, which will lay a solid foundation for the next step of imaging algorithms. In terms of imaging algorithms, NDT techniques can be integrated with cutting-edge algorithms such as deep learning and digital twins to further enhance resolution, accuracy and imaging efficiency.
Disclosure statement
No potential conflict of interest was reported by the author(s).
Additional information
Funding
References
- Brenner K, Ergun AS, Firouzi K, et al. Advances in capacitive micromachined ultrasonic transducers. Micromachines. 2019;10(2):152. doi: 10.3390/mi10020152.
- DebRoy T, Wei HL, Zuback JS, et al. Additive manufacturing of metallic components–process, structure and properties. Prog Mater Sci. 2018;92:112–224. doi: 10.1016/j.pmatsci.2017.10.001.
- Leung CLA, Marussi S, Atwood RC, et al. In situ X-ray imaging of defect and molten pool dynamics in laser additive manufacturing. Nat Commun. 2018;9(1):1355. doi: 10.1038/s41467-018-03734-7.
- Chen Y, Peng X, Kong L, et al. Defect inspection technologies for additive manufacturing. Int J Extreme Manuf. 2021;3(2):022002. doi: 10.1088/2631-7990/abe0d0.
- Koester L, Taheri H, Bigelow T, et al. Nondestructive testing for metal parts fabricated using powder based additive manufacturing. Mater Eval. 2018;76:514–524.
- Everton S, Dickens P, Tuck C, et al. Using laser ultrasound to detect subsurface defects in metal laser powder bed fusion components. Jom. 2018;70:378–383. doi: 10.1007/s11837-017-2661-7.
- Liu ZZ, Han QQ, Zhang ZH, et al. Design of a novel crack-free precipitation-strengthened nickel-based superalloy and composites for laser powder bed fusion. Virtual Phys Prototyp. 2023;18(1):2224769. doi: 10.1080/17452759.2023.2224769.
- Yu W, Xiao Z, Zhang X, et al. Processing and characterization of crack-free 7075 aluminum alloys with elemental Zr modification by laser powder bed fusion. Mater Sci Addit Manuf. 2022;1(1):4. doi: 10.18063/msam.v1i1.4.
- Chauveau D. Review of NDT and process monitoring techniques usable to produce high-quality parts by welding or additive manufacturing. Weld World. 2018;62:1097–1118. doi: 10.1007/s40194-018-0609-3.
- Chua ZY, Ahn IH, Moon SK. Process monitoring and inspection systems in metal additive manufacturing: status and applications. Int J Precis Eng Manuf Green Technol. 2017;4:235–245. doi: 10.1007/s40684-017-0029-7.
- Everton SK, Hirsch M, Stravroulakis P, et al. Review of in-situ process monitoring and in-situ metrology for metal additive manufacturing. Materials. 2016;95:431–445.
- Taheri H, Shoaib MRM, Koester LW, et al. Powder-based additive manufacturing-a review of types of defects, generation mechanisms, detection, property evaluation and metrology. Int J Addit Subtract Mater Manuf. 2017;1(2):172–209.
- Mandache C. Overview of non-destructive evaluation techniques for metal-based additive manufacturing. Mater Sci Technol. 2019;35(9):1007–1015. doi: 10.1080/02670836.2019.1596370.
- Sreeraj PR, Mishra SK, Singh PK, et al. A review on non-destructive evaluation and characterization of additively manufactured components. Prog Addit Manuf. 2022;7:225–248. doi: 10.1007/s40964-021-00227-w.
- Ramírez IS, Márquez FPG, Papaelias M. Review on additive manufacturing and non-destructive testing. J Manuf Syst. 2023;66:260–286. doi: 10.1016/j.jmsy.2022.12.005.
- Chen X, Kong F, Fu Y, et al. A review on wire-arc additive manufacturing: typical defects, detection approaches, and multisensor data fusion-based model. Int J Adv Manuf Technol. 2021;117:707–727. doi: 10.1007/s00170-021-07807-8.
- Serrati DSM, Machado MA, Oliveira JP, et al. Non-destructive testing inspection for metal components produced using wire and arc additive manufacturing. Metals. 2023;13(4):648. doi: 10.3390/met13040648.
- Shaloo M, Schnall M, Klein T, et al. A review of non-destructive testing (NDT) techniques for defect detection: application to fusion welding and future wire arc additive manufacturing processes. Materials. 2022;15(10):3697. doi: 10.3390/ma15103697.
- Du Pleaais A, Yadroitsev I, Yadroitsava I, et al. X-ray microcomputed tomography in additive manufacturing: a review of the current technology and applications. 3D Print Addit Manuf. 2018;5(3):227–247. doi: 10.1089/3dp.2018.0060.
- Li ZR, Wu DL, Zhou JF, et al. Advances in online detection technology for laser additive manufacturing: a review. 3D Print Addit Manuf. 2023;10(3):467–489. doi: 10.1089/3dp.2021.0049.
- Honarvar F, Varvani-Farahani A. A review of ultrasonic testing applications in additive manufacturing: defect evaluation, material characterization, and process control. Ultrasonics. 2020;108:106227. doi: 10.1016/j.ultras.2020.106227.
- Lu QY, Wong CH. Additive manufacturing process monitoring and control by non-destructive testing techniques: challenges and in-process monitoring. Virtual Phys Prototyp. 2018;13(2):39–48. doi: 10.1080/17452759.2017.1351201.
- ISO/ASTM 52900:2021. Standard terminology for additive manufacturing -- general principles -- terminology. West Conshohocken (PA, USA): ASTM International; 2021.
- Bankong B, Abioye T, Olugbade T, et al. Review of post-processing methods for high-quality wire arc additive manufacturing. J Appl Psychol. 2023;39(2):129–146.
- Gong X, Zeng D, Groeneveld-Meijer W, et al. Additive manufacturing: a machine learning model of process-structure-property linkages for machining behavior of Ti–6Al–4V. Mater Sci Add Manuf. 2022;1(6):1–16.
- Savinov R, Shi J. Microstructure, mechanical properties, and corrosion performance of additively manufactured CoCrFeMnNi high-entropy alloy before and after heat treatment. Mater Sci Addit Manuf. 2023;2(1):42. doi: 10.36922/msam.42.
- Sing SL, Huang S, Yeong WY. Effect of solution heat treatment on microstructure and mechanical properties of laser powder bed fusion produced cobalt-28chromium-6molybdenum. Mater Sci Eng A. 2020;769:138511. doi: 10.1016/j.msea.2019.138511.
- Xue P, Zhu L, Xu P, et al. Effect of heat treatment on microstructure and mechanical properties of in-situ synthesized Ni2CrCoNb0. 16 multi-principal element alloy manufactured by directed energy deposition. Mater Sci Eng A. 2023;862:144398. doi: 10.1016/j.msea.2022.144398.
- Chen H, Meng X, Chen J, et al. Wire-based friction stir additive manufacturing. Addit Manuf. 2023;70:103557.
- Kumar S, Kar A. A review of solid-state additive manufacturing processes. Trans Indian Natl Acad Eng. 2021;6(4):955–973. doi: 10.1007/s41403-021-00270-7.
- Li W, Yang K, Yin S, et al. Solid-state additive manufacturing and repairing by cold spraying: a review. J Mater Sci Technol. 2018;34(3):440–457. doi: 10.1016/j.jmst.2017.09.015.
- Liu M, Kumar A, Bukkapatnam S, et al. A review of the anomalies in directed energy deposition (DED) processes & potential solutions-part quality & defects. Procedia Manuf. 2021;53:507–518. doi: 10.1016/j.promfg.2021.06.093.
- Ngo TD, Kashani A, Imbalzano G, et al. Additive manufacturing (3D printing): a review of materials, methods, applications and challenges. Compos Part B Eng. 2018;143:172–196. doi: 10.1016/j.compositesb.2018.02.012.
- Svetlizky D, Zheng B, Vyatskikh A, et al. Laser-based directed energy deposition (DED-LB) of advanced materials. Mater Sci Eng A. 2022;840:142967. doi: 10.1016/j.msea.2022.142967.
- Tuncer N, Bose A. Solid-state metal additive manufacturing: a review. Jom. 2020;72(9):3090–3111. doi: 10.1007/s11837-020-04260-y.
- Xie R, Shi Y, Liu H, et al. A novel friction and rolling based solid-state additive manufacturing method: microstructure and mechanical properties evaluation. Mater Today Commun. 2021;29:103005. doi: 10.1016/j.mtcomm.2021.103005.
- Svetlizky D, Das M, Zheng B, et al. Directed energy deposition (DED) additive manufacturing: physical characteristics, defects, challenges and applications. Mater Today. 2021;49:271–295. doi: 10.1016/j.mattod.2021.03.020.
- Wong KV, Hernandez A. A review of additive manufacturing. Int Sch Res Not. 2012;2012:208760.
- Chua CK, Leong KF. 3D printing and additive manufacturing: principles and applications (with companion media pack)-of rapid prototyping. Singapore: World Scientific Publishing Company; 2014.
- Alhijaily A, Kilic ZM, Bartolo A. Teams of robots in additive manufacturing: a review. Virtual Phys Prototyp. 2023;18:e2162929. doi: 10.1080/17452759.2022.2162929.
- Safeea M, Bearee R, Neto P. An integrated framework for collaborative robot-assisted additive manufacturing. J Appl Psychol. 2019;81:406–413.
- Gibson I, Rosen DW, Stucker B, et al. Additive manufacturing technologies. Vol. 17, New York: Springer; 2021.
- Yang L, Hsu K, Baughman B, et al. Additive manufacturing of metals: the technology, materials, design and production. Cham: Springer; 2017.
- Sing SL, Kuo C, Shih C, et al. Perspectives of using machine learning in laser powder bed fusion for metal additive manufacturing. Virtual Phys Prototyp. 2021;16(3):372–386. doi: 10.1080/17452759.2021.1944229.
- Dass A, Moridi A. State of the art in directed energy deposition: from additive manufacturing to materials design. Coatings. 2019;9(7):418. doi: 10.3390/coatings9070418.
- Sing SL, Huang S, Goh GD, et al. Emerging metallic systems for additive manufacturing: in-situ alloying and multi-metal processing in laser powder bed fusion. Prog Mater Sci. 2021;119:100795. doi: 10.1016/j.pmatsci.2021.100795.
- Wang D, Liu L, Deng G, et al. Recent progress on additive manufacturing of multi-material structures with laser powder bed fusion. Virtual Phys Prototyp. 2022;17(2):329–365. doi: 10.1080/17452759.2022.2028343.
- Nurhudan AI, Supriadi S, Whulanza Y, et al. Additive manufacturing of metallic based on extrusion process: a review. J Manuf Process. 2021;66:228–237. doi: 10.1016/j.jmapro.2021.04.018.
- Yu W, Sing SL, Chua CK, et al. Influence of re-melting on surface roughness and porosity of AlSi10Mg parts fabricated by selective laser melting. J Alloys Compd. 2019;792:574–581. doi: 10.1016/j.jallcom.2019.04.017.
- Sames WJ, List FA, Pannala S, et al. The metallurgy and processing science of metal additive manufacturing. Int Mater Rev. 2016;61(5):315–360. doi: 10.1080/09506608.2015.1116649.
- He Y, Li M, Meng Z, et al. An overview of acoustic emission inspection and monitoring technology in the key components of renewable energy systems. Mech Syst Signal Process. 2021;148:107146. doi: 10.1016/j.ymssp.2020.107146.
- Wolf SJ, Wu H, Parab N, et al. In-situ high-speed X-ray imaging of piezo-driven directed energy deposition additive manufacturing. Sci Rep. 2019;9:962. doi: 10.1038/s41598-018-36678-5.
- Aiden AM, Nicholas PC, Saad AK, et al. Dynamics of pore formation during laser powder bed fusion additive manufacturing. Nat Commun. 2019;10:1987. doi: 10.1038/s41467-019-10009-2.
- Khairallah SA, Anderson AT, Rubenchik A, et al. Laser powder-bed fusion additive manufacturing: physics of complex melt flow and formation mechanisms of pores, spatter, and denudation zones. Acta Mater. 2016;108:36–45. doi: 10.1016/j.actamat.2016.02.014.
- Witkin DB, Sitzman S, Kim Y, et al. Experimental nondestructive characterization of an aluminum alloy prepared by powder-bed additive manufacturing. Mater Eval. 2018;76(4):489–502.
- Brennan MC, Keist JS, Palmer TA. Defects in metal additive manufacturing processes. J Mater Eng Perform. 2021;30:4808–4818. doi: 10.1007/s11665-021-05919-6.
- Manvatkar V, De A, DebRoy T. Heat transfer and material flow during laser assisted multi-layer additive manufacturing. J Appl Phys. 2014;116(2):124905. doi: 10.1063/1.4896751.
- Cerniglia D, Scafidi M, Pantano A, et al. Inspection of additive-manufactured layered components. Ultrasonics. 2015;62:292–298. doi: 10.1016/j.ultras.2015.06.001.
- DePond PJ, Guss G, Ly S, et al. In situ measurements of layer roughness during laser powder bed fusion additive manufacturing using low coherence scanning interferometry. Mater Des. 2018;154:347–359. doi: 10.1016/j.matdes.2018.05.050.
- Acevedo R, Sedlak P, Kolman R, et al. Residual stress analysis of additive manufacturing of metallic parts using ultrasonic waves: state of the art review. J Mater Res Technol. 2020;9:9457–9477. doi: 10.1016/j.jmrt.2020.05.092.
- Bartlett J, Li X. An overview of residual stresses in metal powder bed fusion. Addit Manuf. 2019;27:131–149.
- Nadimpalli VK, Karthik G, Janakiram G, et al. Monitoring and repair of defects in ultrasonic additive manufacturing. Int J Adv Manuf Technol. 2020;108:1793–1810. doi: 10.1007/s00170-020-05457-w.
- Gorelik M. Additive manufacturing in the context of structural integrity. Int J Fatigue. 2017;94:168–177. doi: 10.1016/j.ijfatigue.2016.07.005.
- Ji L, Lu J, Tang S, et al. Research on mechanisms and controlling methods of macro defects in TC4 alloy fabricated by wire additive manufacturing. Materials. 2018;11:1104. doi: 10.3390/ma11071104.
- Madhvacharyula AS, Pavan AVS, Gorthi S, et al. In situ detection of welding defects: a review. Weld World. 2022;66:611–628. doi: 10.1007/s40194-021-01229-6.
- Dwivedi SK, Vishwakarma M, Soni A. Advances and researches on non destructive testing: a review. Mater Today Proc. 2018;5(2):3690–3698. doi: 10.1016/j.matpr.2017.11.620.
- Zhang Y, Fuh JYH, Ye D, et al. In-situ monitoring of laser-based PBF via off-axis vision and image processing approaches. J Appl Psychol. 2019;25:263–274.
- Kanko JA, Sibley AP, Fraser JM. In situ morphology-based defect detection of selective laser melting through inline coherent imaging. J Mater Process Technol. 2016;231:488–500. doi: 10.1016/j.jmatprotec.2015.12.024.
- Nair A, Cai CS. Acoustic emission monitoring of bridges: review and case studies. Eng Struct. 2010;32(6):1704–1714. doi: 10.1016/j.engstruct.2010.02.020.
- Abdelrahman M, Reutzel E, Nassar AR, et al. Flaw detection in powder bed fusion using optical imaging. Addit Manuf. 2017;15:1–11.
- Lu QY, Nguyen N, Hum A, et al. Optical in-situ monitoring and correlation of density and mechanical properties of stainless steel parts produced by selective laser melting process based on varied energy density. J Mater Process Technol. 2019;271:520–531. doi: 10.1016/j.jmatprotec.2019.04.026.
- Lu QY, Nguyen NV, Hum AJ, et al. Identification and evaluation of defects in selective laser melted 316L stainless steel parts via in-situ monitoring and micro computed tomography. Addit Manuf. 2020;35:101287.
- Hossain MS, Taheri H. In situ process monitoring for additive manufacturing through acoustic techniques. J Mater Eng Perform. 2020;29(10):6249–6262. doi: 10.1007/s11665-020-05125-w.
- Biswal R, Zhang X, Shamir M, et al. Interrupted fatigue testing with periodic tomography to monitor porosity defects in wire+ arc additive manufactured Ti–6Al–4V. Addit Manuf. 2019;28:517–527.
- Hassen AA, Kirka MM. Additive manufacturing: the rise of a technology and the need for quality control and inspection techniques. Mater Eval. 2018;76(4):438–453.
- Sun W, Symes DR, Brenner CM, et al. Review of high energy x-ray computed tomography for non-destructive dimensional metrology of large metallic advanced manufactured components. Rep Prog Phys. 2022;85(1):016102. doi: 10.1088/1361-6633/ac43f6.
- Beutel J, Kundel HL, Metter RLV. Handbook of medical imaging (physics and psychophysics). Vol. 1, Bellingham (WA): SPIE Optical Engineering Press. 2000; p. 949.
- Khosravani MR, Reinicke T. On the use of X-ray computed tomography in assessment of 3D-printed components. J Nondestruct Eval. 2020;39:1–17. doi: 10.1007/s10921-020-00721-1.
- Lu QY, Wong CH. Applications of non-destructive testing techniques for post-process control of additively manufactured parts. Virtual Phys Prototyp. 2017;12(4):301–321. doi: 10.1080/17452759.2017.1357319.
- Malej S, Matjaz G, Crtomir D, et al. Hybrid additive manufacturing of Ti6Al4V with powder-bed fusion and direct-energy deposition. Mater Sci Eng. 2023;878:145229. doi: 10.1016/j.msea.2023.145229.
- Samei J, Amirmaleki M, Dastgiri MS, et al. In-situ X-ray tomography analysis of the evolution of pores during deformation of AlSi10Mg fabricated by selective laser melting. Mater Lett. 2019;255:126512. doi: 10.1016/j.matlet.2019.126512.
- Sanaei N, Fatemi A, Phan N. Defect characteristics and analysis of their variability in metal L-PBF additive manufacturing. Mater Des. 2019;182:108091. doi: 10.1016/j.matdes.2019.108091.
- Siddique S, Imran M, Rauer M, et al. Computed tomography for characterization of fatigue performance of selective laser melted parts. Mater Des. 2015;83:661–669. doi: 10.1016/j.matdes.2015.06.063.
- Smith TR, Sugar JD, Schoenung JM, et al. Relationship between manufacturing defects and fatigue properties of additive manufactured austenitic stainless steel. Mater Sci Eng A. 2019;765:138268. doi: 10.1016/j.msea.2019.138268.
- Tammas-Williams S, Zhao H, Léonard F, et al. XCT analysis of the influence of melt strategies on defect population in Ti–6Al–4V components manufactured by selective electron beam melting. J Appl Psychol. 2015;102:47–61.
- Thompson A, Maskery I, Leach RK. X-ray computed tomography for additive manufacturing: a review. Meas Sci Technol. 2016;27(7):072001. doi: 10.1088/0957-0233/27/7/072001.
- Slotwinski JA, Garboczi EJ, Hebenstreit KM. Porosity measurements and analysis for metal additive manufacturing process control. J Res Natl Inst Stand Technol. 2014;119:494. doi: 10.6028/jres.119.019.
- Kim FH, Moylan SP, Garboczi EJ, et al. Investigation of pore structure in cobalt chrome additively manufactured parts using X-ray computed tomography and three-dimensional image analysis. Addit Manuf. 2017;17:23–38.
- Zhang M, Sun C, Zhang X, et al. Fatigue and fracture behaviour of laser powder bed fusion stainless steel 316L: influence of processing parameters. Mater Sci Eng A. 2017;703:251–261. doi: 10.1016/j.msea.2017.07.071.
- Choo H, Sham K, Bohling J, et al. Effect of laser power on defect, texture, and microstructure of a laser powder bed fusion processed 316L stainless steel. Mater Des. 2019;164:107534. doi: 10.1016/j.matdes.2018.12.006.
- Baruchel J, Buffiere J, Cloetens P, et al. Advances in synchrotron radiation microtomography. Scr Mater. 2006;55(1):41–46. doi: 10.1016/j.scriptamat.2006.02.012.
- Kastner J, Harrer B, Requena G, et al. A comparative study of high resolution cone beam X-ray tomography and synchrotron tomography applied to Fe-and Al-alloys. NDT E Int. 2010;43(7):599–605. doi: 10.1016/j.ndteint.2010.06.004.
- Stock SR. Recent advances in X-ray microtomography applied to materials. Int Mater Rev. 2008;53(3):129–181. doi: 10.1179/174328008X277803.
- Carlton H, Haboub A, Gallegos G, et al. Damage evolution and failure mechanisms in additively manufactured stainless steel. Mater Sci Eng A. 2016;651:406–414. doi: 10.1016/j.msea.2015.10.073.
- Pandiyan V, Drissi-Daoudi R, Shevchik S, et al. Analysis of time, frequency and time-frequency domain features from acoustic emissions during laser powder-bed fusion process. Procedia CIRP. 2020;94:392–397. doi: 10.1016/j.procir.2020.09.152.
- Eschner N, Weiser L, Häfner B, et al. Classification of specimen density in laser powder bed fusion (L-PBF) using in-process structure-borne acoustic process emissions. Addit Manuf. 2020;34:101324.
- Lédeczi H, Hay T, Volgyesi P, et al. Wireless acoustic emission sensor network for structural monitoring. IEEE Sens J. 2009;11(9):1370–1377. doi: 10.1109/JSEN.2009.2019315.
- Zahedi F, Huang H. A wireless acoustic emission sensor remotely powered by light. Smart Mater Struct. 2014;23(3):035003. doi: 10.1088/0964-1726/23/3/035003.
- Ito K, Kusano M, Demura M, et al. Detection and location of microdefects during selective laser melting by wireless acoustic emission measurement. Addit Manuf. 2021;40:101915.
- Barile C, Casavola C, Pappalettera G, et al. Acoustic emission signal processing for the assessment of corrosion behaviour in additively manufactured. Mech Mater. 2022;170:104347. doi: 10.1016/j.mechmat.2022.104347.
- Liu P, Sohn H, Kundu T, et al. Noncontact detection of fatigue cracks by laser nonlinear wave modulation spectroscopy (LNWMS). NDT E Int. 2014;66:106–116. doi: 10.1016/j.ndteint.2014.06.002.
- Ramalho A, Santos TG, Bevans B, et al. Effect of contaminations on the acoustic emissions during wire and arc additive manufacturing of 316L stainless steel. Addit Manuf. 2022;51:102585.
- Strantza M, Van Hemelrijck D, Guillaume P, et al. Acoustic emission monitoring of crack propagation in additively manufactured and conventional titanium components. Mech Res Commun. 2017;84:8–13. doi: 10.1016/j.mechrescom.2017.05.009.
- Barile C, Casavola C, Pappalettera G, et al. Acoustic emission descriptors for the mechanical behavior of selective laser melted samples: an innovative approach. Mech Mater. 2020;148:103448. doi: 10.1016/j.mechmat.2020.103448.
- Liu P, Yi K, Sohn H. Estimation of silicon wafer coating thickness using ultrasound generated by femtosecond laser. J Nondestruct Eval Diagn Progn Eng Syst. 2021;4(1):011005.
- Scruby CB. Some applications of laser ultrasound. Ultrasonics. 1989;27(4):195–209. doi: 10.1016/0041-624X(89)90043-7.
- Selim H, Delgado-Prieto M, Trull J, et al. Defect reconstruction by non-destructive testing with laser induced ultrasonic detection. Ultrasonics. 2020;101:106000. doi: 10.1016/j.ultras.2019.106000.
- Hu S, Shi W, Lu C, et al. Rapid detection of cracks in the rail foot by ultrasonic B-scan imaging using a shear horizontal guided wave electromagnetic acoustic transducer. NDT E Int. 2021;120:102437. doi: 10.1016/j.ndteint.2021.102437.
- Derusova DA, Vavilov VP, Druzhinin N, et al. Investigating vibration characteristics of magnetostrictive transducers for air-coupled ultrasonic NDT of composites. NDT E Int. 2019;107:102151. doi: 10.1016/j.ndteint.2019.102151.
- Kim YY, Kwon YE. Review of magnetostrictive patch transducers and applications in ultrasonic nondestructive testing of waveguides. Ultrasonics. 2015;62:3–19. doi: 10.1016/j.ultras.2015.05.015.
- Lee SE, Liu P, Ko YW, et al. Study on effect of laser-induced ablation for Lamb waves in a thin plate. Ultrasonics. 2019;91:121–128. doi: 10.1016/j.ultras.2018.07.019.
- Chimenti DE. Review of air-coupled ultrasonic materials characterization. Ultrasonics. 2014;54(7):1804–1816. doi: 10.1016/j.ultras.2014.02.006.
- Zimermann R, Mohseni E, Lines D, et al. Multi-layer ultrasonic imaging of as-built Wire+ Arc additive manufactured components. Addit Manuf. 2021;48:102398.
- Nadimpalli VK, Yang L, Nagy PB. In-situ interfacial quality assessment of ultrasonic additive manufacturing components using ultrasonic NDE. NDT E Int. 2018;93:117–130. doi: 10.1016/j.ndteint.2017.10.004.
- Rieder H, Spies M, Bamberg J, et al. On-and offline ultrasonic characterization of components built by SLM additive manufacturing. AIP Conf Proc. 2016;1706(1):130002. doi: 10.1063/1.4940605.
- Lopez AB, Santos J, Sousa J, et al. Phased array ultrasonic inspection of metal additive manufacturing parts. J Nondestruct Eval. 2019;38:1–11. doi: 10.1007/s10921-018-0529-6.
- Javadi Y, MacLeod CN, Pierce SG, et al. Ultrasonic phased array inspection of a Wire+ Arc Additive Manufactured (WAAM) sample with intentionally embedded defects. Addit Manuf. 2019;29:100806.
- Chabot A, Laroche N, Carcreff E, et al. Towards defect monitoring for metallic additive manufacturing components using phased array ultrasonic testing. J Intell Manuf. 2020;31(5):1191–1201. doi: 10.1007/s10845-019-01505-9.
- Rao J, Yang J, He J, et al. Elastic least-squares reverse-time migration with density variation for flaw imaging in heterogeneous structures. Smart Mater Struct. 2020;29(3):035017. doi: 10.1088/1361-665X/ab6ba4.
- Rao J, Sing SL, Lim JCW, et al. Detection and characterisation of defects in directed energy deposited multi-material components using full waveform inversion and reverse time migration. Virtual Phys Prototyp. 2022;17(4):1047–1057. doi: 10.1080/17452759.2022.2086142.
- Lv G, Yao Z, Chen D, et al. Fast and high-resolution laser-ultrasonic imaging for visualizing subsurface defects in additive manufacturing components. Mater Des. 2023;225:111454. doi: 10.1016/j.matdes.2022.111454.
- Chen Y, Jiang L, Peng Y, et al. Ultra-fast laser ultrasonic imaging method for online inspection of metal additive manufacturing. Opt Lasers Eng. 2023;160:107244. doi: 10.1016/j.optlaseng.2022.107244.
- Liu S, Jia K, Wan H, et al. Inspection of the internal defects with different size in Ni and Ti additive manufactured components using laser ultrasonic technology. Opt Laser Technol. 2022;146:107543. doi: 10.1016/j.optlastec.2021.107543.
- Zhang J, Wu J, Zhao X, et al. Laser ultrasonic imaging for defect detection on metal additive manufacturing components with rough surfaces. Appl Opt. 2020;59(33):10380–10388. doi: 10.1364/AO.405284.
- Holland SD, Reusser RS. Material evaluation by infrared thermography. Annu Rev Mater Res. 2016;46:287–303. doi: 10.1146/matsci.2016.46.issue-1.
- Shrestha R, Kim W. Evaluation of coating thickness by thermal wave imaging: a comparative study of pulsed and lock-in infrared thermography–part I: simulation. Infrared Phys Technol. 2017;83:124–131. doi: 10.1016/j.infrared.2017.04.016.
- Liu T, Lough CS, Sehhat H, et al. In-situ infrared thermographic inspection for local powder layer thickness measurement in laser powder bed fusion. Addit Manuf. 2022;55:102873.
- Ciampa F, Mahmoodi P, Pinto F, et al. Recent advances in active infrared thermography for non-destructive testing of aerospace components. Sensors. 2018;18(2):609. doi: 10.3390/s18020609.
- Sreedhar U, Krishnamurthy CV, Balasubramaniam K, et al. Automatic defect identification using thermal image analysis for online weld quality monitoring. J Mater Process Technol. 2012;212(7):1557–1566. doi: 10.1016/j.jmatprotec.2012.03.002.
- Machado MA, Silva MI, Martins AP, et al. Double active transient thermography. NDT E Int. 2022;125:102566. doi: 10.1016/j.ndteint.2021.102566.
- Silva HV, Martins AP, Machado MA, et al. Double active thermographic inspection of additive manufacturing composites: numerical modelling and validation. Measurement. 2023;218:113212. doi: 10.1016/j.measurement.2023.113212.
- Hwang S, Kim H, Lim HJ, et al. Automated visualization of steel structure coating thickness using line laser scanning thermography. Autom Constr. 2022;139:104267. doi: 10.1016/j.autcon.2022.104267.
- Vavilov VP, Burleigh DD. Review of pulsed thermal NDT: physical principles, theory and data processing. NDT E Int. 2015;73:28–52. doi: 10.1016/j.ndteint.2015.03.003.
- Zhao Y, Tinsley L, Addepalli S, et al. A coefficient clustering analysis for damage assessment of composites based on pulsed thermographic inspection. NDT E Int. 2016;83:59–67. doi: 10.1016/j.ndteint.2016.06.003.
- Ciampa F, Scarselli G, Meo M. On the generation of nonlinear damage resonance intermodulation for elastic wave spectroscopy. J Acoust Soc Am. 2017;141(4):2364–2374. doi: 10.1121/1.4979256.
- Guo X. Ultrasonic infrared thermography of aluminium thin plates for crack inspection in friction stir welded joints. IEEE Sens J. 2020;20(12):6524–6531. doi: 10.1109/JSEN.7361.
- Du B, He Y, He Y, et al. Intelligent classification of silicon photovoltaic cell defects based on eddy current thermography and convolution neural network. IEEE Trans Ind Inform. 2019;16(10):6242–6251. doi: 10.1109/TII.9424.
- Zu R, Yang Y, Huang X, et al. A stress detection method for metal components based on eddy current thermography. J Appl Psychol. 2023;133:102762.
- Mirala A, Al Qaseer MT, Donnell KM. Health monitoring of RAM-coated structures by active microwave thermography. IEEE Trans Instrum Meas. 2021;70:6005411. doi: 10.1109/TIM.19.
- Zou X, Mirala A, Sneed L, et al. Detection of CFRP-concrete interfacial debonding using active microwave thermography. Compos Struct. 2021;260:113261. doi: 10.1016/j.compstruct.2020.113261.
- Fierro GPM, Flora F, Boccaccio M, et al. Real-time automated composite scanning using forced cooling infrared thermography. Infrared Phys Technol. 2021;118:103860. doi: 10.1016/j.infrared.2021.103860.
- Lei L, Ferrarini G, Bortolin A, et al. Thermography is cool: defect detection using liquid nitrogen as a stimulus. NDT E Int. 2019;102:137–143. doi: 10.1016/j.ndteint.2018.11.012.
- Szymanik B, Chady T, Goracy K. Numerical modelling and experimental evaluation of the composites using active infrared thermography with forced cooling. Quant Infrared Thermogr J. 2020;17(2):107–129. doi: 10.1080/17686733.2019.1625243.
- Mireles J, Ridwan S, Morton PA, et al. Analysis and correction of defects within parts fabricated using powder bed fusion technology. Surf Topogr Metrol Prop. 2015;3(3):034002. doi: 10.1088/2051-672X/3/3/034002.
- Kolb CG, Zier K, Grager J, et al. An investigation on the suitability of modern nondestructive testing methods for the inspection of specimens manufactured by laser powder bed fusion. SN Appl Sci. 2021;3:1–16. doi: 10.1007/s42452-021-04685-3.
- Cerniglia D, Montinaro N. Defect detection in additively manufactured components: laser ultrasound and laser thermography comparison. Procedia Struct Integr. 2016;8:154–162. doi: 10.1016/j.prostr.2017.12.016.
- Montinaro N, Cerniglia D, Pitarresi G. Defect detection in additively manufactured titanium prosthesis by flying laser scanning thermography. Procedia Struct Integr. 2018;12:165–172. doi: 10.1016/j.prostr.2018.11.098.
- Fu Y, Downey AR, Yuan L, et al. Machine learning algorithms for defect detection in metal laser-based additive manufacturing: a review. J Manuf Process. 2022;75:693–710. doi: 10.1016/j.jmapro.2021.12.061.
- Cui W, Zhang Y, Zhang X, et al. Metal additive manufacturing parts inspection using convolutional neural network. Appl Sci. 2020;10(2):545. doi: 10.3390/app10020545.
- Zhang Y, Soon HG, Ye D, et al. Powder-bed fusion process monitoring by machine vision with hybrid convolutional neural networks. IEEE Trans Ind Inform. 2019;16(9):5769–5779. doi: 10.1109/TII.9424.
- Garland A, White B, Jared B, et al. Deep convolutional neural networks as a rapid screening tool for complex additively manufactured structures. Addit Manuf. 2020;35:101217.
- Delli U, Chang S. Automated process monitoring in 3D printing using supervised machine learning. Procedia Manuf. 2018;26:865–870. doi: 10.1016/j.promfg.2018.07.111.
- Caggiano A, Zhang J, Alfieri V, et al. Machine learning-based image processing for on-line defect recognition in additive manufacturing. CIRP Ann. 2019;68(1):451–454. doi: 10.1016/j.cirp.2019.03.021.
- Huang Z, Wang J, Fu X, et al. DC-SPP-YOLO: dense connection and spatial pyramid pooling based YOLO for object detection. Inf Sci. 2020;522:241–258. doi: 10.1016/j.ins.2020.02.067.
- Redmon J, Farhadi A. YOLO9000: better, faster, stronger. Proceedings of the IEEE Conference on Computer Vision and Pattern Recognition; 2017. p. 7263–7271.
- Li W, Zhang H, Wang G, et al. Deep learning based online metallic surface defect detection method for wire and arc additive manufacturing. Robot Comput Integr Manuf. 2023;80:102470. doi: 10.1016/j.rcim.2022.102470.
- Snell R, Tammas-Williams S, Chechik L, et al. Methods for rapid pore classification in metal additive manufacturing. Jom. 2020;72:101–109. doi: 10.1007/s11837-019-03761-9.
- Montazeri M, Nassar AR, Stutzman CB, et al. Heterogeneous sensor-based condition monitoring in directed energy deposition. Addit Manuf. 2019;30:100916.
- Gobert C, Kudzal A, Sietins J, et al. Porosity segmentation in X-ray computed tomography scans of metal additively manufactured specimens with machine learning. Addit Manuf. 2020;36:101460.
- Wong V, Ferguson M, Law KH, et al. Segmentation of additive manufacturing defects using U-net. International Design Engineering Technical Conferences and Computers and Information in Engineering Conference; Vol. 85376; 2021. V002T02A029.
- Yang H, Wang W, Li C, et al. Deep learning-based X-ray computed tomography image reconstruction and prediction of compression behavior of 3D printed lattice structures. Addit Manuf. 2022;54:102774.
- Hossain MS, Taheri H. In-situ process monitoring for metal additive manufacturing through acoustic techniques using wavelet and convolutional neural network (CNN). Int J Adv Manuf Technol. 2021;116:3473–3488. doi: 10.1007/s00170-021-07721-z.
- Shevchik SA, Masinelli G, Kenel C, et al. Deep learning for in situ and real-time quality monitoring in additive manufacturing using acoustic emission. IEEE Trans Ind Inform. 2019;15(9):5194–5203. doi: 10.1109/TII.9424.
- Ye D, Hong GS, Zhang Y, et al. Defect detection in selective laser melting technology by acoustic signals with deep belief networks. Int J Adv Manuf Technol. 2018;96:2791–2801. doi: 10.1007/s00170-018-1728-0.
- Gaja H, Liou F. Defects monitoring of laser metal deposition using acoustic emission sensor. Int J Adv Manuf Technol. 2017;90:561–574. doi: 10.1007/s00170-016-9366-x.
- Gaja H, Liou F. Defect classification of laser metal deposition using logistic regression and artificial neural networks for pattern recognition. Int J Adv Manuf Technol. 2018;94:315–326. doi: 10.1007/s00170-017-0878-9.
- Mohammadi MG, Mahmoud D, Elbestawi M. On the application of machine learning for defect detection in L-PBF additive manufacturing. Opt Laser Technol. 2021;143:107338. doi: 10.1016/j.optlastec.2021.107338.
- Park S, Hong J, Ha T, et al. Deep learning-based ultrasonic testing to evaluate the porosity of additively manufactured parts with rough surfaces. Metals. 2021;11(2):290. doi: 10.3390/met11020290.
- Park SH, Choi S, Jhang KY. Porosity evaluation of additively manufactured components using deep learning-based ultrasonic nondestructive testing. Int J Precis Eng Manuf Green Technol. 2021;9:395–407. doi: 10.1007/s40684-021-00319-6.
- Rao J, Yang F, Mo H, et al. Quantitative reconstruction of defects in multi-layered bonded composites using fully convolutional network-based ultrasonic inversion. J Sound Vib. 2023;542:117418. doi: 10.1016/j.jsv.2022.117418.
- Xu W, Zhang J, Li X, et al. Intelligent denoise laser ultrasonic imaging for inspection of selective laser melting components with rough surface. NDT E Int. 2022;125:102548. doi: 10.1016/j.ndteint.2021.102548.
- Zhang X, Saniie J, Heifetz A. Detection of defects in additively manufactured stainless steel 316L with compact infrared camera and machine learning algorithms. J Appl Psychol. 2020;72(12):4244–4253.
- Zhang X, Saniie J, Cleary W, et al. Quality control of additively manufactured metallic structures with machine learning of thermography images. JOM. 2020;72(12):4682–4694. doi: 10.1007/s11837-020-04408-w.
- Baumgartl H, Tomas J, Buettner R, et al. A deep learning-based model for defect detection in laser-powder bed fusion using in-situ thermographic monitoring. Prog Addit Manuf. 2020;5(3):277–285. doi: 10.1007/s40964-019-00108-3.
- Chen X, Zhang H, Hu J, et al. A passive on-line defect detection method for wire and arc additive manufacturing based on infrared thermography. 2019 International Solid Freeform Fabrication Symposium; 2019.
- Jeon I, Yang L, Ryu K, et al. Online melt pool depth estimation during directed energy deposition using coaxial infrared camera, laser line scanner, and artificial neural network. Addit Manuf. 2021;47:102295.
- Gbenga EE. Using non-destructive testing for the manufacturing of composites for effective cost saving: a case study of a commercial prepreg CFC. Int J Mater Eng. 2016;6(2):28–38.
- Lim HJ, Lee J, Sohn H. Nondestructive yield strength estimation for 3D-printed Ti–6Al–4V plates using Eddy-current measurement. Sens Smart Struct Technol Civ Mech Aerosp Syst. 2023;12486:39–45.
- Spurek MA, Spierings AB, Lany M, et al. In-situ monitoring of powder bed fusion of metals using eddy current testing. Addit Manuf. 2022;60:103259.
- Bento JB, Lopez A, Pires I, et al. Non-destructive testing for wire+ arc additive manufacturing of aluminium parts. Addit Manuf. 2019;29:100782.
- Ehlers H, Pelkner M, Thewes R. Heterodyne eddy current testing using magnetoresistive sensors for additive manufacturing purposes. IEEE Sens J. 2020;20(11):5793–5800. doi: 10.1109/JSEN.7361.
- Javier GM, Jaime G, Ernesto V. Non-destructive techniques based on Eddy current testing. Sensors. 2011;11:2525–2565. doi: 10.3390/s110302525.
- Yang L, Sohn H, Ma Z, et al. Real-time layer height estimation during multi-layer directed energy deposition using domain adaptive neural networks. Comput Ind. 2023;148:103882. doi: 10.1016/j.compind.2023.103882.