?Mathematical formulae have been encoded as MathML and are displayed in this HTML version using MathJax in order to improve their display. Uncheck the box to turn MathJax off. This feature requires Javascript. Click on a formula to zoom.
ABSTRACT
Laser powder bed fusion (L-PBF), an additive manufacturing (AM) technique, often leads to parts with high surface roughness in as-built condition, hence limited fatigue performance. This paper showcases the favourable impact of applying an in-process surface modification, adopting a hybrid laser processing technique (dual-laser PBF (dL-PBF)), on the three-point bending fatigue life of TiB2-reinforced Al-Cu-Mg-Ag composite coupons. The dL-PBF process parameters are optimised for this high-strength aluminium-based metal matrix composite, followed by a comparative study between 3 surface conditions, i.e. as-built, dL-PBF processed, and milled, focusing on surface roughness, concomitant stress concentration factor, surface residual stress, sub-surface hardness, sub-surface microstructure, and fatigue performance. While no significant hardness or microstructural differences are found, surface roughness and stress concentration factor are substantially decreased (> 50%) and identified as the primary factors for the significantly enhanced fatigue performance of dL-PBF processed TiB2-reinforced Al-Cu-Mg-Ag composite parts with up-facing inclined surfaces.
1. Introduction
High-strength aluminium (Al) alloys, such as 2xxx (Al-Cu), 6xxx (Al-Mg), or 7xxx (Al-Zn) series alloys, are known to be susceptible to solidification cracking when processed by laser powder bed fusion (L-PBF) additive manufacturing (AM). An extensive amount of research has been focused on developing strategies for mitigating solidification cracking in these precipitation hardenable, high-strength aluminium alloys, to be able to unlock their full potential for lightweight high-performance components produced via L-PBF [Citation1–7].
The AM205 alloy (Al-Cu-Mg-Ag-TiB2), which can also be referred as TiB2-reinforced aluminium-based metal matrix composite (MMC), contains finely dispersed TiB2 particles acting as heterogeneous nucleation sites during rapid solidification hence facilitating interdendritic back-filling and avoiding solidification cracking. When properly heat-treated, the alloy displays an excellent quasi-static performance, combining a yield strength, tensile strength and ductility of 440 ± 1.7 MPa, 483 ± 2.4 MPa and 9.5 ± 1.3%, respectively, in heat-treated condition [Citation8]. Its high-strength in heat-treated condition originates from a combination of fine grains (grain boundary strengthening), finely dispersed TiB2 particles (Orowan strengthening) and Al2Cu precipitates (precipitation strengthening). Combined with the high strength-to-weight ratio, high temperature stability, and the geometrical freedom offered by L-PBF, AM205 has become an advantageous candidate for high-end, demanding L-PBF applications [Citation9].
The AM205 alloy was recently commercialised, allowing crack-free high-strength aluminium L-PBF parts production. Considerable research has been dedicated to the study of the microstructural and quasi-static properties of Al-Cu-Mg-Ag-TiB2 [Citation8–15]. However, only a few studies report on the fatigue performance of L-PBF processed Al-Cu-Mg-Ag-TiB2 (AM205, also called A20X) [Citation16–18]. Karimialavijeh et al. [Citation16] investigated the effect of laser contour scan parameters on the surface finish and the axial fatigue performance of the A20X alloy, Avateffazeli et al. [Citation17] recently published their work on the effect of heat treatments (stress relieving and T7) on axial fatigue behaviour of A20X alloy, and Beevers et al. [Citation18] presented L-PBF work on the fatigue performance of rhombic dodecahedron lattice structures processed from this alloy.
Although L-PBF is one of the most widely used metal additive manufacturing techniques, L-PBF processed parts face challenges related to their high surface roughness in as-built condition [Citation19,Citation20]. This issue is particularly critical for structurally demanding applications that are subjected to cyclic loads and require resistance to fatigue [Citation21–24]. The irregularities at the surface, involving peaks and valleys, are referred to as the surface roughness which can generate local notch effects and stress concentration regions. These local notches can be deleterious to the fatigue performance as they act as preferential initiation points for fatigue cracks and facilitate fatigue failure [Citation22,Citation23]. To overcome this limitation, surface finishing techniques are necessary.
Additionally, the machining of L-PBF processed metal matrix composite parts with enhanced mechanical properties and hard ceramic particles, such as those found in the Al-Cu-Mg-Ag-TiB2, poses further difficulties, such as rapid tool wear and poor surface finish [Citation25,Citation26]. Various conventional and non-conventional methods have been proposed to address the machining of metal matrix composites [Citation27–30], each with their advantages and limitations [Citation25].
More recently, specific to additively manufactured parts, hybrid-AM processes and machines which refer to ‘the use of AM with one or more secondary processes or energy sources that are fully coupled and synergistically affect part quality, functionality, and/or process performance’ [Citation31] have been proposed for improved surface quality. One of these novel in-process (integrated) hybrid techniques [Citation32] to further enhance the surface quality of L-PBF metal parts by means of reduced surface roughness is Dual-laser powder bed fusion (dL-PBF) that has been introduced by Metelkova et al. [Citation33]. While dL-PBF bears similarities to the well-established laser polishing (surface re-melting) [Citation34–37] technique to reduce surface roughness, it incorporates an extra step. The distinguishing advantage of dL-PBF lies in its first step, i.e. the use of a pulsed-wave laser allowing to remove powder selectively, exposing densified surfaces that were initially covered by loose powder. During this step, selective powder removal from the up-facing inclined surfaces is facilitated through laser-induced shock waves, that are resulting from material ablation via the integrated pulsed-wave laser. Subsequently, in the second step of the dL-PBF process, the ablated inclined surface is re-melted using a continuous-wave laser [Citation33] leading to surface smoothening through the relocation of molten material from the surface peaks to the valleys [Citation37], akin to the laser polishing technique. This two-step hybrid process allows for in-process surface modification and reduced surface roughness of the L-PBF metal parts with inclined surfaces [Citation33,Citation38].
As the material undergoes a local thermo-mechanical treatment during laser re-melting, not only the surface roughness but also other aspects affecting the surface integrity will be altered. Surface integrity, which is defined as the state and attributes of a manufactured surface that affect its performance, refers to the topographical, metallurgical, mechanical, and chemical characteristics of the surface and the sub-surface [Citation39,Citation40]. Regarding the effect of laser re-melting on surface integrity of L-PBF parts, in addition to surface roughness being lowered, it has been shown that the (sub)surface microstructure and residual stress state, can also be affected. For example, Hofele et al. stated that laser polishing results in a modification of the microstructure, reduced hardness, as well as reduced stresses in the remolten zone for AlSi10Mg parts [Citation37]. Panov et al. revealed that laser polishing has a ‘pore healing effect’ on their 316L samples, allowing closure of sub-surface (edge) L-PBF pores, which, in combination with a lowered surface roughness, resulted in an improved fatigue performance [Citation41]. Contrarily, Kahlin et al. reported a negative effect of laser polishing on additively manufactured Ti-6Al-4V due to martensitic layer formation despite the lowered surface roughness that was realised [Citation42]. In addition to confirming the martensitic layer formation and increased surface hardness, Li et al. revealed that the tensile residual stresses induced by laser polishing resulted in degraded fatigue performance for this alloy [Citation43]. Furthermore, Zhou et al. noted grain coarsening at the heat affected zone in Ti-6Al-4V because of laser polishing [Citation44], although they did not study the fatigue properties, a lower fatigue life can be expected due to the larger grain size, hence lower number of obstacles to crack propagation [Citation45]. Finally, the effect of dL-PBF on some of the surface integrity aspects and resultant fatigue performance was first revealed by Ordnung et al. [Citation46]. They demonstrated that the lower surface roughness and decreased micro-hardness induced by the dL-PBF positively impacts the fatigue life of Maraging steel and Ti-6Al-4V, particularly for three-point bending fatigue coupons with up-facing inclined surfaces [Citation46].
As (a) the dynamic behaviour of L-PBF processed Al-Cu-Mg-Ag-TiB2 is only described to a limited extent in literature, (b) the use of in-process surface roughness reduction methodologies is overall limited and restricted to metallic alloys and (c) the machining behaviour of Al-based metal matrix composites is extremely challenging, the current study is dedicated to demonstrating and explaining, for the first time, the beneficial impact of utilising the dL-PBF process on enhancing the surface quality and fatigue performance of L-PBF processed high-strength TiB2-reinforced Al-Cu-Mg-Ag composite (AM205) coupons, particularly those with inclined surfaces. The dL-PBF process optimisation for AM205 coupons is achieved, while the effect of re-melting laser energy density is revealed. The surface integrity of AM205 coupons processed with optimised dL-PBF settings (R) is studied and compared to the as-built (AB) and milled (M) conditions by means of surface roughness, density and microstructure, residual stress, and hardness evaluation. Finally, the effect of the abovementioned three surface conditions (AB, dL-PBF processed (R), and M) on the three-point bending fatigue performance of TiB2-reinforced Al-Cu-Mg-Ag composite is revealed.
2. Material and methods
2.1. Material
In this study, TiB2-reinforced aluminium-based metal matrix composite (MMC) parts were produced using commercially available AM205 (TLS Technik GmbH & Co, Germany) (currently commercially supplied by Eckart as A20XTM), pre-alloyed gas-atomized powder which comprises of Al-Cu-Mg-Ag-TiB2. The powder particle size distribution was measured as D10 of 18 µm, D50 of 42 µm, and D90 of 59 µm using an LS13 320 Laser Diffraction Particle Size Analyzer with the Tornado dry powder system (Beckman Coulter, United States).
2.2. Methods
2.2.1. Production
Laser powder bed fusion
The samples used for this study were produced by the laser powder bed fusion (L-PBF) technique, utilising an in-house customised ProX320 DMP machine (3D Systems). The customised L-PBF machine is equipped with two lasers: (1) a continuous wave (CW) near-infrared (IR) (central wavelength of 1070 nm) 500 W fibre laser, and (2) an integrated 50 W nanosecond (ns) pulsed-wave (PW) laser with comparable wavelength (pulse duration range of 2–250 ns). The nominal laser spot sizes are and
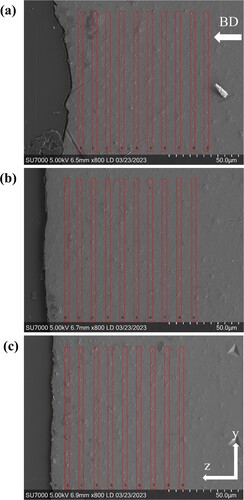
for CW and PW laser, respectively. The CW laser was used to build the samples, while the PW laser was used to treat the sample top surfaces in-process, followed by re-melting via CW laser, as described in the following subsection. The applied L-PBF process parameters for bulk sample production were 260 W, 1200 mm/s, 0.1, 0.03 mm, as CW laser power (P), scan speed (ѵ), hatch spacing (h), and layer thickness (t), respectively, with a 45° tilted scan vector orientation and 90° scan rotation between subsequent layers. Two types of sample geometries were produced: (a) dL-PBF process optimisation samples, and (b) three-point bending fatigue (3PBF) coupons [Citation46,Citation47] as shown in (a,b), respectively. Half-sized 3PBF coupons (Figure 1(a)) were used for dL-PBF process optimisation in order to minimise the geometrical effect on powder removal and re-melting steps of dL-PBF and resultant sample properties.
Figure 1. Sample geometries used in this study and their dimensions (in mm) for (a) dL-PBF process optimisation samples and (b) three-point bending fatigue (3PBF) coupons [Citation23,Citation46,Citation47], with two representative loading cylinders for fatigue testing indicating the distances needed for sample orientation during 3PBF tests. hs, hb, w, L, Lt and R refer to sample height at the minimum cross section, maximum height, sample width, distance between the supporting pins, total sample length, and radius of curvature, respectively.
![Figure 1. Sample geometries used in this study and their dimensions (in mm) for (a) dL-PBF process optimisation samples and (b) three-point bending fatigue (3PBF) coupons [Citation23,Citation46,Citation47], with two representative loading cylinders for fatigue testing indicating the distances needed for sample orientation during 3PBF tests. hs, hb, w, L, Lt and R refer to sample height at the minimum cross section, maximum height, sample width, distance between the supporting pins, total sample length, and radius of curvature, respectively.](/cms/asset/d1757597-7e43-4b18-a4fb-df3fa269ef2c/nvpp_a_2276247_f0001_ob.jpg)
Surface treatment
For the optimisation of the dL-PBF process, first, the powder removal step was applied by utilising the PW laser, using 42 W, 500 mm/s, 0.07 mm, 30 ns, 100 kHz, as PW average laser power, scan speed, hatch spacing, pulse duration, and pulse repetition rate, respectively. This step allowed removing the powder covering the sample surface with the local powder blowing effect of laser-induced shock waves created as a result of the pulsed-wave laser material ablation [Citation33,Citation38]. Once the sample surface was free of powder, the re-melting is applied. In this step, variable laser power (P) and scan speed (ѵ) combinations were applied, using the CW laser, to reveal the optimum parameter set for the re-melting step of the dL-PBF process. Independent on the applied P-ѵ combinations, the hatch distance (h) was kept constant at 0.07 mm. The list of applied varying parameter sets for re-melting and the corresponding volumetric energy density (Ev) values (calculated by dividing laser power (P) by the multiplication of hatch distance (h), layer thickness (t), and scan speed (ѵ)) (Ev = P / (h x t x ѵ)) for each surface condition studied are listed in , while the detailed schematic of dL-PBF process steps is shown in Appendix A.
Table 1. The list of dL-PBF process optimisation sample IDs and the corresponding laser power (W), scan speed (mm/s), and volumetric energy density (Ev) (J/mm3) values (t was taken as 30 µm, i.e. the powder layer thickness during L-PBF).
Finally, for fatigue characterisation, 3PBF coupons with three types of surface conditions were prepared, namely; (a) as-built surface condition (AB), (b) dual-laser powder bed fusion (dL-PBF) treated surface condition (R), and (c) milled surface condition (M) as the conventionally machined surface reference. The R condition was processed using the optimised dL-PBF parameter set obtained in the current study (R-b), i.e. the laser power of 300 W and the scan speed of 800 mm/s.
2.2.2. Characterisation
Surface roughness
A tactile profilometer (Formtracer Mitutoyo CS3200, USA) equipped with a 60° conical probe and 2 µm tip radius was used to extract surface roughness profiles. For each optimisation and fatigue sample, five surface measurements with a measuring length of 10 mm were completed along the longitudinal direction (along x-axis in ) (parallel to scan direction). Then the average Ra (the arithmetical mean of filtered data, using a Gaussian regression filter as stated in ISO 16610-31 (2016)) and Rv (the maximum valley depth) values were calculated, using the cut-off length (λc) of 2.5 mm as defined in ISO 4288, to compare the different surface conditions. Finally, the surface roughness profiles were used to calculate the critical stress concentration factors (kt) as described in [Citation24].
Density and microstructure
The Archimedes’ method was used to measure the relative part density of 3PBF coupons (theoretical density based on the powder density measured by gas (Helium) pycnometer = 2.84 g/cm3). In addition, in order to visualise internal porosity, X-ray microcomputed tomography (µCT) was used (TESCAN UniTOM XL located at the KU Leuven XCT Core Facility). The following parameters were utilised for the µCT scanning; 225 kV, 15 W, 2400, as the scan voltage, power, and number of projections, respectively, and a 1 mm thick aluminium filter. The achieved voxel size was 5.8 µm. TESCAN Acquila reconstruction software and Avizo 2021.2 was used for reconstruction and 3D data analyses, respectively. Grain sizes near top surfaces were determined by electron backscatter diffraction (EBSD) analysis on a FEI Nova NanoSEM 450 microscope with the following mapping settings: 20 kV acceleration voltage, 5 µm spot size, 0.4 µm step size over the scan area of 146 µm × 346 µm. Finally, polished cross sections were prepared for optical microscopy (OM) and scanning electron microscopy (SEM) imaging by etching (5 s in Keller’s reagent, 2.5 ml Nitric acid (HNO3) + 1.5 ml Hydrochloric acid (HCl) + 1 ml Hydrofluoric acid (HF) + 95 ml deionised water).
Residual stress
Surface residual stress measurements were realised using X-ray diffractometry (XRD) (Bruker D8 Advance, Germany), equipped with a LYNXEYE XE-T detector (1D mode), a Cu anode emitting K-α1 radiation directed through a 1 mm diameter collimator (40 kV, 40 mA, 1.54 Å). The measurements were performed on the top surface of the process optimisation sample geometry, at the region with minimum cross-sectional area ((a)). For the measurements, the (422) Al lattice plane with a 2θ diffraction peak located approximately around 135.5° was adopted. LEPTOS 7.9 was used for data processing. The following input material parameters were used: a Poisson’s ratio of 0.352 and a Young’s modulus of 70922 MPa, corresponding to X-ray elastic constants S1 and 1/2 S2 as −4.970E-6 and 1.907E-5, respectively and the calibration measurements were done on reference Al2O3 sample, displaying the residual stress of +/- 28 MPa (BS EN15305). It is important to mention that the exact residual stress values might be different for the 3PBF coupons, due to the geometrical differences. Hence, the principal residual stress (σI) was reported as a qualitative surface residual stress state comparison among samples with different surface finish conditions.
Hardness
KLA – iNano ® (KLA, Milpitas, USA) with a Berkovich pyramidal tip that was calibrated for area function using a fused silica sample of known modulus (72 GPa) and Poisson’s ratio (0.17) [Citation48] was used for nanoindentation experiments. Hardness (H) and reduced modulus (Eru) [Citation49] distribution maps were created utilising high speed nanoindentation mapping as described by Datye et al. in [Citation50–52]. The mappings were done at the YZ cross section (so sub-surface hardness is measured) and the indentations were done up to a peak load of 2 mN (corresponding to a penetration depth of ∼ 250 nm) with a 10 µm spacing [Citation53], creating a 10 × 10 grid of 100 µm (along the BD) x 100 µm (perpendicular to BD). SEM images displaying nanoindentations are given in Appendix B. The average sub-surface H and Eru values are reported for each condition.
Tensile
The tensile properties were characterised on flat dog-bone shaped (ISO 6892) machined parts, utilising an Instron 4467 (Instron, US) machine (crosshead speed was set to 0.4 mm/min (ASTM E8)). The average (avg.) properties of 5 samples with the as-built microstructure and machined surfaces are reported here as: avg. yield strength (σyield) of 311 ± 6 MPa, avg. ultimate tensile strength (σUTS) of 430 ± 6 MPa, with an avg. elongation at break of 16 ± 2%.
Fatigue
An Instron E10000 (Instron, US) machine with a 10 kN dynamic load cell was used to realise three-point bending fatigue (3PBF) tests. The details of adopted 3PBF fatigue coupon geometry [Citation23,Citation46,Citation47] is shown in . The applied load (F) levels were calculated as stated in [Citation46,Citation47] using Equation (1) and Equation (2), where the moment of inertia (I) and bending span (L) were constant, while height (hs) and width (w) were measured for each sample.
(1)
(1)
(2)
(2)
The stress (σ) levels were selected by the authors taking the yield strength (311 ± 6 MPa) of the alloy into account. The applied stress amplitudes were namely 123, 212, 265, and 338 MPa, corresponding to 40, 70, 90, 110% of the yield strength, respectively. The stress distribution specific to this 3PBF geometry can be found in [Citation47]. The tests were conducted under constant amplitude axial loading with a stress ratio (R) of 0.1 and a frequency of 30 Hz. For each stress level, minimum three samples were tested for every condition. The stop condition was taken as either the sample fracture or the run-out at 2 million cycles without failure and the results are reported as S-N curves displaying the stress amplitude (σa = ((σmax- σmin)/2)) vs number of cycles to failure (Nf).
3. Results
The results section is subdivided into three main sections.
Firstly, the dL-PBF process optimisation study for Al-Cu-Mg-Ag-TiB2 parts is presented, focusing on the effect of a variable re-melting energy density on three surface integrity aspects that are affected by re-melting: surface roughness, part density, and sub-surface grain size. As such, an optimised dL-PBF methodology for Al-based 3PBF coupons is proposed.
Subsequently, TiB2-reinforced Al-Cu-Mg-Ag composite 3PBF coupons with different surface conditions, i.e. (a) dL-PBF processed using the optimised re-melting parameters (R), (b) as-built (AB), and (c) milled (M), are characterised. Besides surface roughness and concomitant critical stress concentration factor, the surface residual stress state, and the sub-surface nanohardness profile are evaluated.
Finally, the resultant 3PBF performance of coupons with different surface finishing conditions (AB, R, and M) and the fractured surface characteristics of each surface condition are evaluated.
3.1. Parameter optimisation for dL-PBF
Varying re-melting laser power and scan speeds are utilised to fabricate Al-Cu-Mg-Ag-TiB2 dL-PBF process optimisation samples with five different surface conditions, namely, AB, R-a, R-b, R-c, and R-d. During the characterisation of these samples, three parameters are evaluated, i.e. surface roughness, part density and grain size. Accordingly, the results obtained from (a) tactile profilometry, (b) µCT scans, and (c) EBSD analysis are shared in this section.
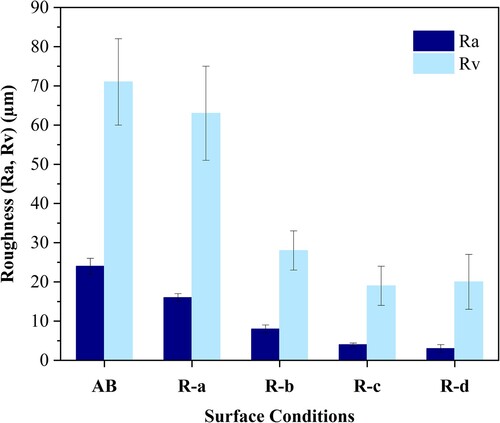
The average surface roughness measured for AB (as-built), R-a, R-b, R-c, and R-d samples are represented by Ra and Rv values in . A similar decreasing trend is observed for both Ra and Rv values from the AB to R-d conditions, indicating that the surface roughness decreases as the volumetric energy density (Ev) increases. While the surface roughness achieved by R-a dL-PBF processing parameters (Ra = 16 ± 1 µm, Rv = 63 ± 12 µm) are comparable to the AB surface condition (Ra = 24 ± 2 µm, Rv = 71 ± 11 µm), a significantly lower surface roughness is recorded in the cases of R-b (Ra = 8 ± 1 µm, Rv = 28 ± 5 µm), R-c (Ra = 4 ± 0 µm, Rv = 19 ± 5 µm), and R-d (Ra = 3 ± 1 µm, Rv = 20 ± 7 µm).
Figure 2. The surface roughness values represented as Ra (the arithmetic mean) (dark blue) and Rv (the maximum valley depth) (light blue), extracted from surface profiles measured by tactile profilometry on dL-PBF optimisation samples with the surface conditions of AB (as-built), R-a, R-b, R-c, and R-d.
displays the reconstructions of µCT scans of Al-Cu-Mg-Ag-TiB2 dL-PBF process optimisation samples processed with varying re-melting laser power and scan speeds. The 3D reconstructions focusing on top surfaces, the 3D cross-sectional views focusing on sub-surfaces, and the 2D slices of YZ cross-sections are shown for AB ((a–c)), R-a ((d–f)), R-b ((g–i)), R-c ((j–l)), and R-d ((m–o)), respectively. The volumetric energy density values increase from 89 J/mm3 to 317 J/mm3 for R-a ((d)), R-b ((g)), R-c ((j)), and R-d ((m)). The porosity is visualised by the blue-coloured spots, while the bulk material is represented by the grey colour. The total pore counts are noted as 885, 7514, 1925, 9764, and 5759, while the pore volume contents are calculated as 0.004, 0.08, 0.01, 0.08, and 0.14% for AB, R-a, R-b, R-c, and R-d, respectively. Although it is important to keep in mind that CT analysis is limited to detecting pores larger than the resolution achieved, it can be stated that the highest density is recorded for AB, while amongst the dL-PBF processed samples, R-b has the smallest amount of pores. It can be noticed from the 3D reconstructions that, AB in (a) has the roughest surface, and very low amount of overall pore content, R-a, which was subjected to the lowest re-melting energy density amongst the four conditions investigated, ((d)) displays remnant porosity spread across the sample, accumulating mostly at the smaller cross-sectional region. R-b appears to be the dL-PBF processed sample with the highest density with 0.08% pore volume, displaying the minimum number of blue spots, which are located at the top corner ((g)). In the case of R-c, the number of pores at the top corner increases ((j)), whereas for R-d, displayed in (m), a severe increase in porosity content (0.14%) can be noticed, specifically at the top left corner but also throughout the whole sample. In addition to pore localisation, a deterioration is also observed at the top left corner of the half 3PBF geometry at high re-melting energy densities. The pore localisation and the deterioration at the top left corner are attributed to the overheating issue observed in that corner because of the utilised scan strategy and geometry effects [Citation54,Citation55]. This phenomenon occurs due to the scan turn point, where the laser scanning mirrors decelerate and then accelerate, being situated in that particular corner leading to a significantly decreased scan speed and concomitant local energy density increase [Citation54].
Figure 3. The reconstructions of µCT scans of Al-Cu-Mg-Ag-TiB2 AB sample (a, b, c), and dL-PBF process optimisation samples processed with varying re-melting laser power and scan speeds, corresponding to a variable re-melting volumetric energy density (Ev = P/htѵ): (d, e, f) R-a with a re-melting energy density of 89 J/mm3 (lowest Ev), (g, h, i) R-b with a re-melting energy density of 179 J/mm3, (j, k, l) R-c with a re-melting energy density of 238 J/mm3, and (m, n, o) R-d with a re-melting energy density of 317 J/mm3 (highest Ev). Blue spots indicate porosity in the 3D displays focusing on top surfaces (a, d, g, j, m), on the 3D cross sectional view focusing on sub-surfaces (b, e, h, k, n), and the 2D slices of YZ cross sections (c, f, i, l, o). The 2D slices are numbered with 1, 2, 3 and represent the top, middle and bottom part of the sample, respectively.
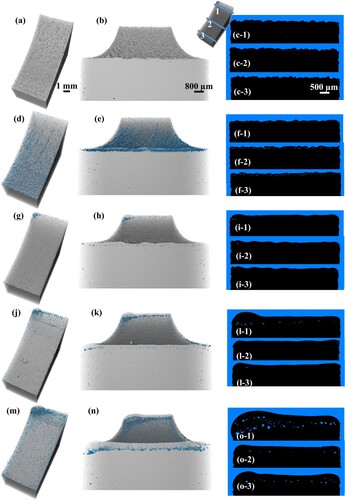
A more detailed look at the YZ cross sections in 3D is provided in (b,e,h,k,n) for AB, R-a, R-b, R-c, and R-d, respectively. It is shown that pores observed near the surface are very few for AB ((b)), whereas in the case of R-a appear to be more frequent, elongated, and aligned ((e)), while more spherical and gradually larger pores can be observed when the volumetric energy density is high, i.e. when evolving from R-a towards R-d, resulting in the highest spherical pore content in the case of R-d ((n)).
The shape of the defects (pores) was evaluated by the sphericity factor (ψ), which is calculated by Equation (3):
(3)
(3) where V represents the volume of the defect, A represents the surface area of the defect. The sphericity factor equals to 1 for a perfect sphere, whereas any other geometry will have a sphericity factor lower than 1. It must also be noted that the voxel size and the meshing performed during the µ-CT image analysis may influence the defect area calculation and hence the resultant sphericity factor [Citation56]. However, as the abovementioned parameters are kept constant, the data obtained for AB, R-a, R-b, R-c, and R-d can be compared. Finally, it should be noted that (a) the smallest reliable pore size to be counted as a perfect sphere is limited by 6 times of the CT voxel size for all the samples at the achieved resolution for this study and (b) pores below that limit are not considered in this analysis. The sphericity factor vs equivalent pore diameter plots can be found in (a–e), for AB, R-a, R-b, R-c, and R-d, respectively.
Figure 4. The sphericity factor vs pore (defect) diameter with the inserts displaying the relative frequency distributions (bin size = 0.05) of the sphericity factor are shown for (a) AB, (b) R-a, (c) R-b, (d) R-c, and (e) R-d, separately. A representative non-spherical pore (defect) (blue) with a sphericity factor of 0.3 and a more spherical one (pink) with a sphericity factor of 0.9 are also shown in (b).
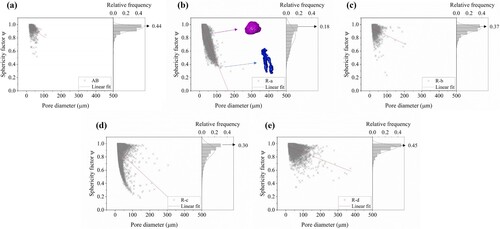
A representative non-spherical, elongated pore (defect) (blue volume) with a sphericity factor of 0.3 and a more spherical one (pink volume) with a sphericity factor of 0.9 can be seen in (b). It can be noticed that the highest volume percent of more spherical pores (sphericity factor, bin center = 0.975) is detected for R-d, followed by AB, R-b, and R-c, while the minimum is recorded for R-a, noted as 45, 44, 37, 30 and 18%, respectively.
The cross sections are displayed in 2D with 3 (YZ) slices from the top (number 1), middle (number 2), and bottom (number 3) of every sample ((c,f,i,l,o)). The rough surface and couple small pores can be noticed for AB sample ((c)). Small, elongated pores (low sphericity) are observed in the middle and bottom part of the R-a samples ((f-2) and (f-3), respectively). While very few and small pores can be noticed for R-b ((i)), it can be seen that in the cases of R-c and R-d, larger spherical pores are detected, the largest ones being mostly at the top corners ((l–1) and (o–1), respectively). Finally, it can be stated that the pores are located much deeper into the bulk material in the case of R-d samples as compared to R-a samples.
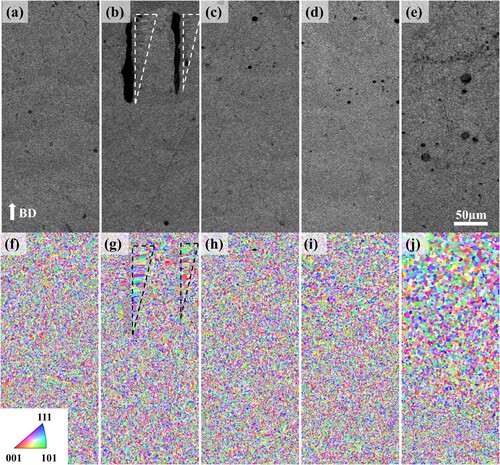
In addition, it was recorded that dL-PBF had no considerable effect on the grain size, except for the cases of the lowest and the highest energy densities used in this study. The average grain sizes measured are comparable for AB (1.36 ± 0.55 µm) and R-b (1.37 ± 0.52 µm) conditions. On the other hand, the average grain size is slightly higher for R-a (1.42 ± 0.57 µm) and R-c (1.41 ± 0.57 µm) and increases for R-d (1.79 ± 1.03 µm). Nevertheless, the EBSD maps () show that the average grain sizes can’t be taken as representative values in the cases of R-a and R-d. This is due to the large, elongated grains observed around the sub-surface defects (pores) in the former ((b)) and the gradual grain coarsening towards the top surface in the latter ((j)). The maximum grain size detected is 4.8 µm for AB, R-b, and R-c, whereas it is 7.6 and 8.2 µm for R-a and R-d, respectively.
Figure 5. EBSD results displaying the image quality (IQ) maps on the top, and the inverse pole figure (IPF) maps for as-built (AB) (a, f), R-a (b, g), R-b (c, h), R-c (d, i), and R-d (e, j), respectively. The dashed triangles (in b and g) indicate the large, elongated grains observed around the sub-surface pores (lack-of-fusion).
Therefore, in light of the optimisation study results, aiming at the highest surface and sub-surface quality, the optimal re-melting parameters to be used for 3PBF samples (R condition) are selected as laser power of 300 W and laser speed of 800 mm/s (condition R-b, ), considering the lowest surface roughness, the smallest amount of remnant sub-surface porosity combined with the smallest extent of grain coarsening achieved for this parameter set.
3.2. Surface integrity of 3PBF coupons
To reveal the impact of dL-PBF on surface integrity and resultant fatigue performance, 3PBF coupons are prepared using the optimised dL-PBF process parameters, resulting in coupons with minimal surface roughness, maximum part density, and unaltered and uniform grain size. These coupons (R condition) are then compared to the coupons in as-built (AB) and milled (M) conditions. The 3PBF coupon evaluation, described in this sub-section aims at the systematic investigation of various surface integrity aspects that are known to influence the fatigue behaviour, namely, surface roughness and concomitant critical stress concentration factor, the presence of (sub)surface residual stresses, and sub-surface hardness.
3.2.1. Surface roughness and critical stress concentration factor
The surface roughness values (represented as Ra and Rv) and the critical stress concentration factors (kt) are calculated for 3PBF coupons with AB (as-built), R (optimised dL-PBF processed condition), and M (milled) surface conditions. For all parameters, i.e. Ra, Rv, and kt, the highest values are recorded for AB condition (Ra = 23 ± 2 µm, Rv = 87 ± 11 µm, kt = 3.6 ± 0.3), lower values (∼50%) for R condition (Ra = 10 ± 1 µm, Rv = 44 ± 8 µm, kt = 1.5 ± 0.1) as compared to AB condition, and the minimum values (∼95%) for M condition (Ra = 1 ± 0 µm, Rv = 7 ± 2 µm, kt = 1.0 ± 0.1).
3.2.2. Surface residual stress
The principal surface residual stress values (σI) for different surface conditions, namely AB, R, and M are measured as 55, 107 MPa, and −232 MPa, respectively. The positive values indicate tensile stresses, while negative values are used for compressive stresses. Therefore, it can be stated that the residual stresses observed in AB and R samples are tensile in nature and minor when compared to the high compressive stresses observed in the case of M samples.
3.2.3. Sub-surface nanohardness
The average H and Eru values measured on YZ cross sections of 3PBF samples correspond to 1.6 ± 0.1 GPa and 77 ± 6 GPa for AB condition, 1.7 ± 0.1 GPa and 80 ± 2 GPa for R condition, and 1.7 ± 0.1 GPa and 79 ± 2 GPa for M condition, respectively. Bearing in mind that these hardness values correspond to indents positioned at a maximum distance of 100 µm from the top surface, it can be stated that the sub-surface hardness and modulus are not affected significantly by the surface machining treatments, i.e. dL-PBF process or milling.
3.3. Fatigue performance
Finally, the three-point bending fatigue (3PBF) performance and fracture surface characteristics of AB, R and M conditions are presented,
3.3.1. Three-point bending S-N fatigue
shows (a) the samples with different surface conditions subjected to three-point bending fatigue tests, (b) the test set-up, and (c) 3PBF test results. The stress amplitude vs number of cycles to failure recorded during 3PBF S-N fatigue tests are displayed in (c) for three surface conditions, i.e. AB, R, and M. The poorest fatigue performance is recorded for samples displaying an AB surface condition. Moreover, it should be highlighted that the fatigue performance of high-strength TiB2-reinforced Al-Cu-Mg-Ag composite (AM205) AB samples investigated in this study outperforms the AlSi10Mg AB samples in [Citation47]. Low stress levels and large scatter in the data can be noticed for samples in the AB condition. On the other hand, the fatigue life is improved significantly for the composite samples with R and M surface conditions, displaying comparable fatigue performance, the latter being slightly superior. The run-out level, set as 2 million cycles without failure, was reached for stress amplitudes of 124, 212 and 265 MPa for AM205 AB, R, and M conditions. Finally, it is noted that significantly higher fatigue strength can be achieved for AM205 as compared to AlSi10Mg, considering the reported run-out stress amplitudes for AlSi10Mg AB and polished conditions were 61 and 87 MPa [Citation47], respectively.
Figure 6. (a) Top surface pictures (XY view) of 3PBF coupons with different surface conditions; AB (as-built), R (re-melted via optimised in-process dL-PBF), and M (milled), from top to bottom, respectively, (b) The 3PBF test set-up, red arrow displaying the applied force and white arrow is indicating the minimum cross sectional area with as-built (AB) or treated surface conditions, (c) 3PBF S-N fatigue test results displaying stress amplitude vs number of cycles for AB, R, and M conditions from this study, and as a reference, AB AlSi10Mg (Series A, Ra = 8.04 ± 4.4 µm) from work of Beretta et al. [Citation47]. The run-out (2 × 10⁶ cycles) stress levels are indicated with the arrows.
![Figure 6. (a) Top surface pictures (XY view) of 3PBF coupons with different surface conditions; AB (as-built), R (re-melted via optimised in-process dL-PBF), and M (milled), from top to bottom, respectively, (b) The 3PBF test set-up, red arrow displaying the applied force and white arrow is indicating the minimum cross sectional area with as-built (AB) or treated surface conditions, (c) 3PBF S-N fatigue test results displaying stress amplitude vs number of cycles for AB, R, and M conditions from this study, and as a reference, AB AlSi10Mg (Series A, Ra = 8.04 ± 4.4 µm) from work of Beretta et al. [Citation47]. The run-out (2 × 10⁶ cycles) stress levels are indicated with the arrows.](/cms/asset/02d0c2b7-83d7-4eb4-88ba-ba34e91d16f5/nvpp_a_2276247_f0006_oc.jpg)
3.3.2. Fractography
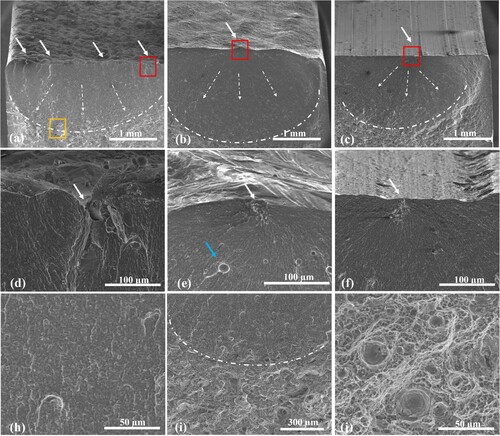
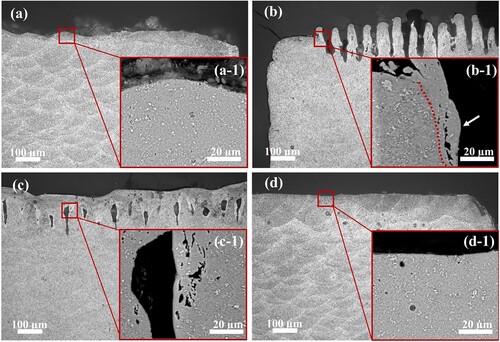
The fractographs captured by SEM for as-built (AB), re-melted (R), and milled (M) 3PBF samples shown in display (1) the initiation points, (2) the initiation and propagation zones, and (3) final fracture zones at the fractured surfaces. While the crack initiation points are indicated by solid white arrows in (a–c) for AB, R and M conditions, respectively, the crack propagation zone is highlighted by the white dashed arrows. The zoomed in images of the fatigue crack initiation points, that are marked by the red rectangles in (a–c), display that cracks initiate from surface defects in case of the AB sample ((d)), while near-surface defects are recorded as initiation points for the R ((e)) and M ((f)) samples. In addition to the rough surface with semi-attached powder particles, a surface discontinuity (valley) can be seen for the as-built (AB) condition ((d)). Whereas, for the re-melted (R) condition ((e)), in addition to spherical key-hole pores located ∼ 100 µm below the surface (blue arrow), a near-surface defect (pore) is noticed as the crack initiation point. On the other hand, for all conditions, the same features are observed in the propagation and final fracture zones. The cracks seem to propagate through the relatively flat region ((h)) until the transition zone, which is indicated with a white dashed line ((i)). It can be noticed that the propagation zone extends from the initiation point for about 1–2 mm along the 6 mm cross section until the transition zone is reached. Afterwards, the sample can’t withstand the applied load anymore and ruptures, creating a final fracture zone displaying dimples, indicating ductile failure ((j)).
Figure 7. SEM images of fractured surfaces of 3PBF samples with surface conditions namely, (a) as-built (AB), (b) re-melted (R), and (c) milled (M). Solid white arrows indicate the crack initiation points, while dashed white arrows indicate the crack propagation till final fracture zone separated with dashed curves, and red rectangles show the crack initiation points zoomed in for (d) as-built (AB), (e) re-melted (R), and (f) milled (M) surface conditions. Blue arrow in (e) indicates a spherical pore. The zoomed in images for the 3 zones (top, middle, bottom) within the yellow rectangle in (a) indicate the crack propagation zone (h), transition zone (i), and final fracture zone (j), respectively.
4. Discussion
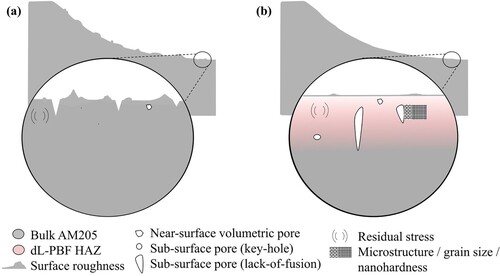
This work reveals (a) the effect of re-melting parameters on the surface integrity of dL-PBF processed TiB2 reinforced Al-Cu-Mg-Ag composite (AM205) coupons, while explaining the sub-surface pore formation mechanisms, as well as the related phenomena occur during the first and the second steps of dL-PBF, and (b) the impact of optimised dL-PBF settings on the surface integrity and the fatigue performance of TiB2-reinforced Al-Cu-Mg-Ag composite (AM205) 3PBF coupons. A schematic describing the surface integrity aspects that will be discussed is given in , focusing on L-PBF process-intrinsic surface roughness, near-surface volumetric defects, and the (sub)surface residual stress state observed in the as-built (AB) condition ((a)), as well as, the additional key-hole or lack-of-fusion sub-surface pores observed for R condition, and the altered (sub)surface stress state due to surface modifications for R and M conditions ((b)).
Figure 8. Schematic describing the surface integrity aspects in (a) as- built (AB) and (b) dL-PBF processed (R) surface conditions.
4.1. Optimisation of dL-PBF and pore formation mechanisms
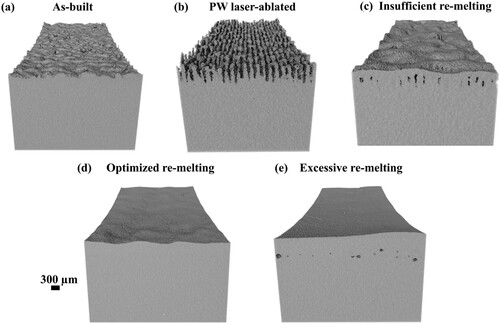
The different surface topographies obtained with varying re-melting parameters are visualised in . First, it is demonstrated that an increased re-melting energy density results in a decreased surface roughness ( and (c–e)). This phenomenon, also observed in laser polishing [Citation37], can be correlated to supplying re-melting energy that is sufficient to re-melt the surface asperities and semi-attached particles, while achieving wide and stable melt-pools.
Figure 9. Surface topographies (a-e); after L-PBF (a), laser-ablated surface with crater formation subsequent to powder blowing using PW laser during dL-PBF (b), lack-of-fusion pores formed due to insufficient re-melting energy (c), the optimal dL-PBF condition: smooth and sub-surface pore-free surface topography after optimised re-melting during dL-PBF (d), and the key-hole pores due to excessive re-melting energy (e).
Second, it is established that the use of sub-optimal dL-PBF parameter sets can result in sub-surface pore formation. Two types of sub-surface pores are detected, namely lack-of fusion pores (remnant ablation traces) and key-hole pores as shown in 3D in (c and e), and at 2D cross sections in (c and d), respectively. The formation mechanisms of the two pore types observed in this work, as well as the resultant alteration in the surface topography and the microstructure with varying re-melting parameters are discussed further.
Figure 10. Optical microscopy images of etched YZ cross sections of (a) as-built (AB), (b) pulsed-wave laser processed (laser-ablated), (c) dL-PBF processed with low re-melting energy density, (d) dL-PBF processed with high re-melting energy density, with inserted BSE-SEM images for (a-1) as-built (AB) microstructure, bright particles indicating TiB2, (b-1) pulsed-wave laser processed (laser-ablated) condition, with a focus on the re-solidified layer top region (indicated with white arrow) with defects and altered microstructure compared to the bulk (indicated with a red dashed line), (c-1) sub-surface pore (ablation crater residue, referred as lack-of-fusion) due to insufficient re-melting energy density, (d-1) sub-surface pore (key-hole) due to high re-melting energy density.
The µCT reconstruction in (a) and OM image in (a) reveals the rougher surface characteristics of as-built (AB) condition, while BSE-SEM image in (a-1) is used to show the equiaxed microstructure with fine α-Al grains and high Cu concentration at the grain boundaries [Citation11,Citation57] observed in Al-Cu-Mg-Ag-TiB2 AB L-PBF condition. During the first and the second steps of the dL-PBF process, the (sub)surface characteristics are altered and pores might be introduced.
4.1.1. First step of dL-PBF: ablation
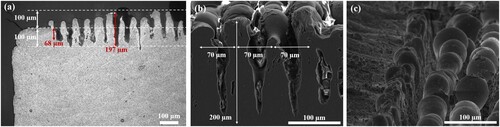
The phenomena occur due to the pulsed-wave (PW) laser – material interaction during the first step of dL-PBF process is visualised in . When the high-intensity nanosecond laser pulse interacts with the material surface, the absorption of (part of) the laser energy leads to an increase in temperature at the surface, resulting in material removal, hence the thermal vapour and then plasma formation by ionisation [Citation58,Citation59]. The plasma eventually expands and creates a high-amplitude, short duration, pressure pulse resulting in shock waves propagating into the material [Citation60–62]. Therefore, material removal by ablation from the bulk sample forms the laser-induced shock waves (LISWs), which blow the surrounding powder away [Citation33,Citation62,Citation63]. After subjecting the sample surface to several laser scan passes, the powder is effectively removed from the sample surface as a direct effect of the generated shock waves, resulting in a laser-ablated (also referred as PW laser processed), powder-free surface as shown in (b). It can be noticed that the laser ablation tracks appear as grooves ((b)) and consist of ablation craters ((b) and ). reveals that the extent of material removal caused by the PW laser ablation, displaying the resultant crater depth of ∼200 µm ((a)), with a ∼ 70 µm distance between each crater (groove) ((b)), which is correlated to the hatch distance (70 µm) used for PW laser processing. In addition, as highlighted by the red dashed line in (b-1), there is a re-solidified layer covering the crater walls which exhibits a slightly altered microstructure in comparison to the bulk material. Furthermore, the presence of defects (material discontinuity indicated with white arrows in (b-1)) can also be identified within the re-solidified layer at the ablated surface.
Figure 11. The mechanism of material removal by nanosecond pulsed wave laser involved in dL-PBF. The schematic is not to the scale and it is modified from Fernandez et al. [Citation94] and Cha et al. [Citation95].
![Figure 11. The mechanism of material removal by nanosecond pulsed wave laser involved in dL-PBF. The schematic is not to the scale and it is modified from Fernandez et al. [Citation94] and Cha et al. [Citation95].](/cms/asset/5cbf8061-9d7d-4ec6-802b-6ec71cfca8ed/nvpp_a_2276247_f0011_oc.jpg)
Figure 12. Laser-ablated state subsequent to the pulsed-wave laser processing (the first step of dL-PBF); (a) OM image displaying the ablation depth with respect to AB surface (∼70–100 µm), the crater depth (∼200 µm) is shown with the red arrows on the etched YZ cross section, (b) SEM image of YZ cross section displaying the frequency of ablation grooves, the distance between the grooves (∼70 µm) is indicated with the white horizontal arrows, (c) SEM image displaying the top view of AB surface (left) and the PW laser processed surface state with ablation tracks (right).
It is also worth noting that the observed ablated surface structure, shown in (b), is similar to the structure referred to by Fishburn et al. as ‘created by explosive melt ejection’ [Citation64], indicating that the laser fluence (energy density) was high and led to phase explosion [Citation65]. However, the authors would like to add here that in case a lower energy input is applied during pulsed-wave laser processing (using 22 and 30 W, instead of 42 W as average PW laser power), while keeping all the other PW laser parameters identical, material ablation from the surface was not possible. Instead, the powder covering the sample surface was partially molten and powder removal was not achieved. The observed phenomena can be attributed to the combined effects of various factors such as material evaporation, recoil-induced melt expulsion [Citation66], phase explosion [Citation65,Citation67] and rapid solidification, caused by the highly dynamic laser-material interaction that occurs during pulsed-wave (PW) laser ablation and a more in-depth study on PW laser ablation is needed. However, a comprehensive investigation of PW laser ablation and its influence on the microstructure is beyond the scope of this study.
4.1.2. Second step of dL-PBF: re-melting
Nevertheless, during the second step of the dL-PBF process, depending on the re-melting energy density provided via the continuous-wave (CW) laser, the ablated microstructure changes since the craters, coated on the inside with re-solidified layers, are re-melted and/or filled, either partially ((c)) or fully ((d)). When the re-melting energy density is insufficient, resulting in the formation of small and shallow melt-pools, only a limited amount of molten metal is created, resulting in only partial closure of craters, leaving a residue of ablation craters, which will be referred as sub-surface pores (lack-of-fusion) in the material ((c,c-1)) as well as large, elongated grains around those pores ((g)). On the other hand, provided that the correct laser re-scanning parameters and strategy are applied, sufficient re-melting energy is supplied and optimal melt-pool sizes are achieved, then the ablation craters are closed completely, the AB grain size is preserved, thus the effect of PW laser ablation is removed (as also confirmed by nanohardness measurements on 3PBF R samples), while the surface roughness is reduced ((d)). However, in case excessive re-melting energy is supplied, deeper melt-pools are formed, leading to a transition into the unstable key-hole regime, and resulting in the formation of sub-surface pores (key-hole) ((e) and (d,d-1)) and leading to grain coarsening ((j)) in the material.
In other words, the parameters used for the second step of dL-PBF, i.e. the laser re-melting, are critical both for sub-surface and surface quality. A sufficiently high energy input during the laser re-melting step (a) creates large-sized melt-pools, ensuring that a sufficiently large molten volume is available to fill the ablation craters [Citation68] which are formed during the powder removal (first) step of dL-PBF, completely and (b) impacts the temperature and the forces acting on the liquid volume, hence affecting the melt-pool dynamics, shape, flow, and solidification behaviour [Citation69–72], thus the resultant surface roughness. Therefore, it is also worth noting that authors believe that the thermal, physical and optical material properties affecting the laser-material interaction for Al-based alloys [Citation73,Citation74] makes that the dL-PBF of them is more challenging, as compared to the alloys with higher melting/evaporation temperatures and lower thermal diffusivities (∼slower heat dissipation) such as Ti64 and 316L, for which no sub-surface pore formation by dL-PBF is observed [Citation46].
In summary, the current investigation revealed that there is a threshold re-melting energy density, utilised during dL-PBF, where the positive effects of high re-melting energy application, such as surface roughness improvement, closure of ablation craters, and elimination of sub-surface lack-of-fusion defects, are overshadowed by the formation of large key-hole (sub-surface) defects, grain growth and corner deterioration during re-melting. However, it can be stated that there is still a wide stable process window around this threshold, considering the wide range of energy densities studied.
It is important to note that finding the optimal re-melting parameters in dL-PBF is crucial not only for achieving a smooth surface, but also for ensuring a good sub-surface quality of dL-PBF processed samples. Therefore, when selecting the optimised dL-PBF parameter set guaranteeing defect-free samples with low surface roughness, it should be kept in mind that it is necessary to find the balance between sufficient re-melting to close the ablation craters, but also avoiding key-hole formation and grain coarsening during dL-PBF.
4.2. The surface integrity and its effect on fatigue performance
Regarding the surface integrity of 3PBF samples with different surface finishes, namely, AB, dL-PBF processed (R), and milled (M), significantly lower (>50%) surface roughness values and concomitant lower critical stress concentration factors are noticeable in the cases of samples with R and M surface conditions as compared to AB surface condition, although smoothening to the level of the M surface condition could not be achieved for the samples with R surface condition. The surface roughness decrease realised in dL-PBF processed (R)® samples, as compared to samples exhibiting the AB surface condition, is attributed to the thermo-mechanical effects of the surface treatment, as also discussed in the previous paragraphs, whereas during milling, the surface roughness (peaks) is removed mechanically. This can be correlated also to the residual stress differences observed among the three surface finish conditions studied. On one hand, the thermal laser processing ((re)melting) results in tensile residual stresses due to rapid solidification and shrinkage of the melt-pools [Citation75] in the cases of AB and R conditions, while the mechanical force applied to remove material during milling, on the other hand, induces compressive stresses [Citation76] in the case of M condition. The extent of compressive stress induced by milling (M), however, is larger than the tensile stresses measured on samples with AB and R surface conditions. It can also be stated that the tensile stress state measured for R condition, similar to AB, indicates that the compressive stresses that can be introduced by PW laser processing due to laser induced shock waves (LISW) is eliminated after the subsequent re-melting via CW laser during dL-PBF. Finally, no considerable difference in terms of sub-surface hardness or grain size is recorded between AB, R or M conditions, suggesting that the influence of hardness and grain size on fatigue performance can be considered negligible for this study, hence these two aspects are not included in the subsequent discussion.
The total fatigue life of a part consists of crack initiation, propagation (short crack and long crack) and final fracture [Citation77,Citation78]. The current study focuses on how the different surface conditions (AB, dL-PBF processed (R), and milled (M)) affect the overall fatigue performance by following a stress-based SN fatigue approach, where the majority of the lifetime is spent on fatigue (macro)crack initiation, while the duration of the propagation stage is negligible, therefore, mainly demonstrating the crack initiation characteristics. Further dedicated tests would be needed to better understand and quantitively analyse the propagation stage [Citation42,Citation79–82], but this is beyond the scope of this study. Within this sub-section, the fatigue responses of the different surface conditions (AB, R, M), covering the role of the differences observed in their surface and sub-surface characteristics, i.e. surface roughness (irregularities), residual stress, and internal (near-surface) defects, on the crack initiation and propagation is discussed.
First of all, as widely known, surface roughness or surface irregularities (defects), particularly ones defined as the critical valleys [Citation23], act as stress concentration points and are major contributors to early crack initiation. Within this study, samples with the AB surface condition exhibit overall the poorest 3PBF performance, while surface treated ones, namely, the R and M surface conditions, demonstrate significantly improved and comparable fatigue performances (). The shorter fatigue life of AB samples is mainly attributed to the significantly higher surface roughness observed in the AB condition (), leading to the presence of numerous stress concentrators which result in multiple crack initiations as displayed in (a). On the other hand, it becomes evident that the lower surface roughness and subsequently reduced stress concentration factors for R, as compared to AB surface, serve as the primary reasons for the significantly enhanced fatigue performance for the former.
Furthermore, the presence of residual stresses can influence the fatigue performance [Citation83–85]. When the near surface residual stresses are tensile in nature, they tend to accelerate fatigue crack initiation and propagation, while a compressive residual stress state, resulting in a decreased stress intensity factor, will delay crack initiation and reduce fatigue crack growth rates [Citation81,Citation84,Citation86]. In other words, residual stresses can increase (tensile) or decrease (compressive) the net stress inducing crack initiation/growth. Recently, Beretta et al. [Citation52] compare the fatigue limits of AlSi10Mg 3PBF sample series with comparable fracture origin defect size, which allowed them to reveal the significant effect of residual stresses on the effective stress ratio (Reff), which is calculated by considering the total stress as the summation of applied stress and residual stress, more details can also be found in [Citation85]. They show that, as the tensile residual stress is increased, a higher effective stress ratio is reached which resulted in a lower fatigue strength [Citation52]. On the other hand, Leuders et al. [Citation87] state that fatigue strength of AM TiAl6V4 is mainly affected by micro porosity, while the residual stresses mainly influence the crack growth behaviour. Additionally, both Zhao et al. [Citation88] and Ge et al. [Citation81] have demonstrated the combined beneficial effect of grain refinement and compressive residual stresses, resulting from laser surface re-melting (LSR) and laser surface peening (LSP), respectively, on the fatigue crack growth rate. Ge et al. [Citation81] state that the increased area of grain boundaries in fine grained microstructure results in an increased number of obstacles to dislocation slip, while the compressive stresses balance out some of the tensile stress applied and lead to reduced stress intensity factors, hence retard crack propagation. The residual stress state seems to differ for M condition in this study, displaying a beneficial compressive surface stress state as opposed to tensile surface stresses observed for AB and R conditions. However, surprisingly, despite the beneficial compressive stresses and lower surface roughness, both of which are expected to delay crack initiation, in case of M condition as compared to R condition, the fatigue performance of M and R appear to be similar. Although the reason behind the comparable fatigue performances is not immediately evident, the similarity is attributed to three influencing factors; (1) low kt achieved for R, (2) residual milling tracks on M surface acting as stress concentrators, and (3) the presence of near-surface (internal) volumetric defects on both R and M samples. Firstly, despite the differences in surface roughness between R and M, the low stress concentration factor for R, with only a marginal difference to M condition (1.5 and 1, respectively), indicates that both conditions have similar level of critical notches that can act as detrimental stress concentration points [Citation24]. In relation to critical notches, a second factor that needs to be considered is the poor milling quality, resulting in residual milling tracks, which act as stress concentrators at the surface (as shown in (f)). Kahlin et al. [Citation42] demonstrate that surface pits acting as stress concentration points can balance out the compressive residual stresses and result in comparable fatigue strength to a surface with tensile residual stresses and minor surface defects. Therefore, it can be stated that in the case of M samples, regarding the surface stress state, the beneficial effect of the compressive stresses on the stress intensity factor is overshadowed by the stress concentration caused by the milling tracks. Therefore, refining the milling parameters to achieve a higher-quality milled surface or performing a polishing operation after milling could potentially enhance fatigue performance for M condition, although this may be cost and time-intensive. Finally, fatigue failures initiating in the sub-surface region for R and M samples, suggests that the volumetric near-surface defects have a dominant effect as sub-surface crack initiators, resulting in comparable fatigue performance of R and M samples, as opposed to the dominant surface crack initiators (combined effect of surface roughness and tensile residual stresses) for AB surfaces.
Therefore, last but not least, the effect of volumetric defects (particularly near-surface) on fatigue performance is discussed. It is known that defects are one of the major detrimental factors when it comes to the fatigue performance of additively manufactured parts, specifically near-surface defects especially when a high-surface quality is achieved, either in-process or after machining [Citation89,Citation90]. The criticality of these defects depends on their size, location and distribution [Citation91], and their concomitant stress concentration effect. Yadollahi et al. [Citation89] provide a comparison between wrought and machined AM parts, emphasising that fatigue cracks tend to initiate from process-induced pores resulting in poorer fatigue performance for the latter. Nasab et al. [Citation90] show that sufficiently large volumetric defects near a smooth surface can be destructive when it comes to fatigue. du Plessis et al. [Citation92] mention that although pores that are smaller than the critical size, don’t play a significant role on part’s static performance, fatigue performance is sensitive to the total pore content and proximity of the pores to the surface. They define pores located within 1 mm distance to the surface as the ‘killers’ [Citation92]. Similarly, Siddique et al. show that pores near the surface, even smaller in size, are more critical due to their higher stress concentration factor calculated using CT data and finite element modelling [Citation93]. Also in this study, as can be seen in , it is found that while the surface crack initiation is the main fatigue failure mechanism for the AB condition ((d)), pores (defects) just below the surface are found to be the initiation points for the R ((e)) and M ((f)) conditions. Finally, it can also be stated that in the case of R sample, the preferred initiation point indicates that the larger pore closer to the surface has a higher stress concentration effect than the smaller spherical pore located further away from the surface. This finding is consistent with the ones from the work of Karimialavijeh et al. [Citation16] where sub-surface key-hole pores that are not connected to the surface did not contribute to fatigue crack initiation.
To sum up, the findings of this study demonstrate that both the R and M conditions exhibit significantly enhanced fatigue performance when compared to the AB condition. The primary contributing factor for the improved fatigue performance of dL-PBF processed condition is the lower surface roughness and subsequent reduction in stress concentration factor. The presence of a few small and spherical sub-surface pores in the R condition is outweighed by the notably detrimental effects of the peaks and valleys with high stress concentration factors found on the surface of AB samples.
It is shown that optimised dL-PBF process can be effectively utilised to improve surface quality of TiB2-reinforced Al-Cu-Mg-Ag composite (AM205) L-PBF parts with up-facing inclined surfaces, in-process.
5. Conclusion
The dL-PBF process is highly effective on reducing the surface roughness of TiB2-reinforced Al-Cu-Mg-Ag (AM205) composite parts, reaching up to 50% reduction in surface roughness. The dL-PBF process optimisation for AM205 is achieved, as the mechanisms of pore formation in case of sub-optimal dL-PBF parameters are revealed. The effect of the volumetric energy density applied during the re-melting step, on the resultant surface roughness and sub-surface microstructure is demonstrated. In case a low re-melting energy input is applied, only a limited decrease in surface roughness is recorded, while elongated sub-surface pores (ablation crater residue referred as lack-of-fusion), as well as an altered microstructure near the craters, are observed close to the surface, due to insufficient re-melting of the ablation craters. On the other hand, when a high energy input is used during laser re-melting, surface roughness is lowered even more extensively. However, large, spherical sub-surface pores (key-hole) are introduced as well as grain coarsening, and the part geometry is deformed, due to over-heating. In the case of optimal parameters, as-built microstructure is preserved, while surface roughness is decreased significantly.
The fatigue performance of high-strength crack-free TiB2-reinforced Al-Cu-Mg-Ag composite (AM205) is improved significantly for the optimal dL-PBF processed (R) condition as compared to as-built (AB) condition. Notably, the dominant factor contributing to the enhanced 3PBF performance of dL-PBF processed condition, as observed in this study, is the substantial reduction in surface roughness (∼ 50%) achieved for the R condition in contrast to the AB condition.
When comparing the fatigue behaviour of TiB2-reinforced Al-Cu-Mg-Ag composite (AM205) samples to that of AlSi10Mg, considerably higher fatigue performance is realised for the former, as the run-out at 2 million cycles (R = 0.1, 30 Hz) is achieved for the stress amplitudes of 124 and 212 MPa for AM205 AB and dL-PBF-processed conditions, and of 61 and 87 MPa for AlSi10Mg AB and polished conditions, respectively.
Acknowledgements
Authors would also like to thank Dr. Jeroen Soete for his support on Avizo data analysis, and to acknowledge the support of Shuhan Zhang from Yale University for SEM imaging of nanoindentations, from KU Leuven, Dr. Jitka Metelkova and Daniel Ordnung for the knowledge transfer on the dual-laser processing, and Yannis Kinds for the dL-PBF experiments using 3D Systems ProX320 DMP machine with the integrated pulsed-wave laser. Seren Senol: Conceptualisation, Methodology, Investigation, Formal analysis, Visualisation, Writing – original draft preparation, Writing – review & editing. Antonio Cutolo: Writing – review & editing, Formal analysis. Amit Datye: Investigation, Formal analysis, Writing – review & editing. Brecht Van Hooreweder: Writing – review & editing, Supervision, Funding acquisition. Kim Vanmeensel: Conceptualisation, Methodology, Writing – review & editing, Supervision, Funding acquisition.
Data availability statement
The data will be made available upon request.
Disclosure statement
No potential conflict of interest was reported by the author(s).
Correction Statement
This article has been corrected with minor changes. These changes do not impact the academic content of the article.
Additional information
Funding
References
- Li G, Brodu E, Soete J, et al. Exploiting the rapid solidification potential of laser powder bed fusion in high strength and crack-free Al-Cu-Mg-Mn-Zr alloys. Addit Manuf. 2021;47:102210), doi:10.1016/j.addma.2021.102210
- Tan Q, Zhang J, Sun Q, et al. Inoculation treatment of an additively manufactured 2024 aluminium alloy with titanium nanoparticles. Acta Mater. 2020;196:1–16. doi:10.1016/j.actamat.2020.06.026
- Zhou SY, Su Y, Wang H, et al. Selective laser melting additive manufacturing of 7xxx series Al-Zn-Mg-Cu alloy: Cracking elimination by co-incorporation of Si and TiB2. Addit Manuf. 2020;36:101458), doi:10.1016/j.addma.2020.101458
- Sullivan E, Polizzi A, Iten J, et al. Microstructural characterization and tensile behavior of reaction synthesis aluminum 6061 metal matrix composites produced via laser beam powder bed fusion and electron beam freeform fabrication. Int J Adv Manuf Technol. 2022;121:2197–2218. doi:10.1007/s00170-022-09443-2
- Liu X, Liu Y, Zhou Z, et al. Grain refinement and crack inhibition of selective laser melted AA2024 aluminum alloy via inoculation with TiC–TiH2. Mater Sci Eng A. 2021;813:141171), doi:10.1016/j.msea.2021.141171
- Mair P, Kaserer L, Braun J, et al. Microstructure and mechanical properties of a TiB2-modified Al–Cu alloy processed by laser powder-bed fusion. Mater Sci Eng A. 2021;799:140209), doi:10.1016/j.msea.2020.140209
- Li G, Tunca B, Senol S, et al. Revealing the precipitation behavior of crack-free TiB2/Al-Zn-Mg-Cu composites manufactured by laser powder Bed fusion. Addit Manuf. 2023;66:103460), doi:10.1016/j.addma.2023.103460
- Avateffazeli M, Carrion PE, Shachi-Amirkhiz B, et al. Correlation between tensile properties, microstructure, and processing routes of an Al–Cu–Mg–Ag–TiB2 (A205) alloy: Additive manufacturing and casting. Mater Sci Eng A. 2022;841:142989), doi:10.1016/j.msea.2022.142989
- Ghoncheh MH, Sanjari M, Zoeram AS, et al. On the microstructure and solidification behavior of new generation additively manufactured Al-Cu-Mg-Ag-Ti-B alloys. Addit Manuf. 2021;37:101724), doi:10.1016/j.addma.2020.101724
- Shakil SI, Zoeram AS, Pirgazi H, et al. Microstructural-micromechanical correlation in an Al–Cu–Mg–Ag–TiB2 (A205) alloy: additively manufactured and cast. Mater Sci Eng A. 2022;832:142453), doi:10.1016/j.msea.2021.142453
- Biffi CA, Bassani P, Fiocchi J, et al. Selective laser melting of AlCu-TiB2 alloy using pulsed wave laser emission mode: processability, microstructure and mechanical properties. Mater Des. 2021;204:109628), doi:10.1016/j.matdes.2021.109628
- Jiang F, Tang L, Li S, et al. Achieving strength-ductility balance in a laser powder bed fusion fabricated TiB2/Al–Cu-Mg-Ag alloy. J Alloys Compd. 2023;945:169311), doi:10.1016/j.jallcom.2023.169311
- Indriyati M, Janik V, Dashwood RJ. Elevated temperature deformation behavior of high strength Al-Cu-Mg-Ag based alloy reinforced by TiB2 particles. Light Met. 2014;9781118889:1353–1358. doi:10.1002/9781118888438.ch226
- Li S, Cai B, Duan R, et al. Synchrotron characterisation of ultra-fine grain TiB2/Al-Cu composite fabricated by laser powder Bed fusion. Acta Metall Sin (English Lett. 2022;35:78–92. doi:10.1007/s40195-021-01317-y
- Ghasri-Khouzani M, Karimialavijeh H, Pröbstle M, et al. Processability and characterization of A20X aluminum alloy fabricated by laser powder bed fusion. Mater Today Commun. 2023;35:105555), doi:10.1016/j.mtcomm.2023.105555
- Karimialavijeh H, Ghasri-Khouzani M, Das A, et al. Effect of laser contour scan parameters on fatigue performance of A20X fabricated by laser powder bed fusion. Int J Fatigue. 2023;175:107775), doi:10.1016/j.ijfatigue.2023.107775
- Avateffazeli M, Shakil SI, Khan MF, et al. The effect of heat treatment on fatigue response of laser powder bed fused Al-Cu-Mg-Ag-TiB2 (A20X) alloy. Mater Today Commun. 2023;35:106009), doi:10.1016/j.mtcomm.2023.106009
- Beevers E, Cutolo A, Mertens F, et al. Unravelling the relation between Laser Powder Bed Fusion processing parameters and the mechanical behaviour of as built lattices in a novel Al–Cu–Mg–Ag–Ti–B alloy. J Mater Process Technol. 2023;315:117915), doi:10.1016/j.jmatprotec.2023.117915
- Barari A, Kishawy HA, Kaji F, et al. On the surface quality of additive manufactured parts. Int J Adv Manuf Technol. 2017;89:1969–1974. doi:10.1007/s00170-016-9215-y
- Nasab MH, Gastaldi D, Lecis NF, et al. On morphological surface features of the parts printed by selective laser melting (SLM). Addit Manuf. 2018;24:373–377. doi:10.1016/j.addma.2018.10.011
- Gockel J, Sheridan L, Koerper B, Whip B. The influence of additive manufacturing processing parameters on surface roughness and fatigue life. Int J Fatigue. 2019;124:380–388. doi:10.1016/j.ijfatigue.2019.03.025.
- Dinh Vanwalleghem TD, Xiang J, Erdelyi H, et al. A unified approach to model the effect of porosity and high surface roughness on the fatigue properties of additively manufactured Ti6-Al4-V alloys. Addit Manuf. 2020;33:101139), doi:10.1016/j.addma.2020.101139
- du Plessis A, Beretta S. Killer notches: The effect of as-built surface roughness on fatigue failure in AlSi10Mg produced by laser powder bed fusion. Addit Manuf. 2020;35:101424), doi:10.1016/j.addma.2020.101424
- Cutolo A, Elangeswaran C, Muralidharan GK, et al. On the role of building orientation and surface post-processes on the fatigue life of Ti-6Al-4V coupons manufactured by laser powder bed fusion. Mater Sci Eng A. 2022;840:142747), doi:10.1016/j.msea.2022.142747
- Liao Z, Abdelhafeez A, Li H, et al. State-of-the-art of surface integrity in machining of metal matrix composites. Int J Mach Tools Manuf. 2019;143:63–91. doi:10.1016/j.ijmachtools.2019.05.006
- Bains PS, Sidhu SS, Payal HS. Fabrication and machining of metal matrix composites: A review. Mater Manuf Process. 2016;31:553–573. doi:10.1080/10426914.2015.1025976
- Maleki E, Bagherifard S, Bandini M, et al. Surface post-treatments for metal additive manufacturing: Progress, challenges, and opportunities. Addit Manuf. 2021;37:101619), doi:10.1016/j.addma.2020.101619
- Abrate S, Walton D. Machining of composite materials. Part II: Non-traditional methods. Compos Manuf. 1992;3:85–94. doi:10.1016/0956-7143(92)90120-J
- Abrate S, Walton DA. Machining of composite materials. Part I: Traditional methods. Compos Manuf. 1992;3:75–83. doi:10.1016/0956-7143(92)90119-F
- Pramanik A. Developments in the non-traditional machining of particle reinforced metal matrix composites. Int J Mach Tools Manuf. 2014;86:44–61. doi:10.1016/j.ijmachtools.2014.07.003
- Sealy MP, Madireddy G, Williams RE, et al. Hybrid processes in additive manufacturing. J Manuf Sci Eng Trans ASME. 2018;140:140), doi:10.1115/1.4038644
- Dilberoglu UM, Gharehpapagh B, Yaman U, et al. Current trends and research opportunities in hybrid additive manufacturing. Int J Adv Manuf Technol. 2021;113:623–648. doi:10.1007/s00170-021-06688-1
- Metelkova J, Vanmunster L, Haitjema H, et al. Hybrid dual laser processing for improved quality of inclined up-facing surfaces in laser powder bed fusion of metals. J Mater Process Technol. 2021;298:117263), doi:10.1016/j.jmatprotec.2021.117263
- Yu W, Sing SL, Chua CK, et al. Influence of re-melting on surface roughness and porosity of AlSi10Mg parts fabricated by selective laser melting. J Alloys Compd. 2019;792:574–581. doi:10.1016/j.jallcom.2019.04.017
- Yasa E, Kruth JP, Deckers J. Manufacturing by combining Selective Laser Melting and Selective Laser Erosion/laser re-melting. CIRP Ann - Manuf Technol. 2011;60:821–842. doi:10.1016/j.cirp.2011.05.006
- Manco E, Cozzolino E, Astarita A. Laser polishing of additively manufactured metal parts: a review. Surf Eng. 2022;38:217–233. doi:10.1080/02670844.2022.2072080
- Zhang D, Yu J, Li H, et al. Investigation of laser polishing of four selective laser melting alloy samples. Appl Sci. 2020: 760), doi:10.3390/app10030760
- Metelkova J, Ordnung D, Kinds Y, et al. Novel strategy for quality improvement of up-facing inclined surfaces of LPBF parts by combining laser-induced shock waves and in situ laser remelting. J Mater Process Technol. 2021;290:116981), doi:10.1016/j.jmatprotec.2020.116981
- Grzesik W. Chapter twenty - surface integrity. In: Grzesik W, editor. Adv mach process met mater (second ed). Elsevier; 2017. p. 533–561. Available from: https://www.sciencedirect.com/science/article/pii/B978044463711600020X.
- Griffiths B. Manufacturing surface technology: surface integrity & functional performance. GT: CRC Press; 2001.
- Panov D, Oreshkin O, Voloskov B, et al. Pore healing effect of laser polishing and its influence on fatigue properties of 316L stainless steel parts fabricated by laser powder bed fusion. Opt Laser Technol. 2022;156:108535), doi:10.1016/j.optlastec.2022.108535
- Kahlin M, Ansell H, Basu D, et al. Improved fatigue strength of additively manufactured Ti6Al4V by surface post processing. Int J Fatigue. 2020;134:105497), doi:10.1016/j.ijfatigue.2020.105497
- Li YH, Wang B, Ma CP, et al. Material characterization, thermal analysis, and mechanical performance of a laser-polished Ti Alloy prepared by selective laser melting. Metals (Basel). 2019;9:112–111. doi:10.3390/met9020112
- Zhou J, Liao C, Shen H, et al. Surface and property characterization of laser polished Ti6Al4V. Surf Coatings Technol. 2019;380:125016), doi:10.1016/j.surfcoat.2019.125016
- Yang X, Zhou J, Ling X. Influences of surface grain size and gradient variation along depth on fatigue life of metallic materials. Mater Des. 2013;43:454–459. doi:10.1016/j.matdes.2012.07.026
- Ordnung D, Metelkova J, Cutolo A, et al. Improving fatigue performance of metal parts with up-facing inclined surfaces produced by laser powder bed fusion and in-situ laser remelting. Addit Manuf Lett. 2022;3:100049), doi:10.1016/j.addlet.2022.100049
- Beretta S, Gargourimotlagh M, Foletti S, et al. Fatigue strength assessment of “as built” AlSi10Mg manufactured by SLM with different build orientations. Int J Fatigue. 2020;139:105737), doi:10.1016/j.ijfatigue.2020.105737
- Oliver WC, Pharr GM. An improved technique for determining hardness and elastic modulus using load and displacement sensing indentation experiments. J Mater Res. 1992;7:1564–1583. doi:10.1557/JMR.1992.1564
- Hay JL. Corporation MTSS. Instrumented indentation testing. Mech Test Eval. 2018;8:232–243. doi:10.31399/asm.hb.v08.a0003273
- Datye A, Ketkaew J, Schroers J, et al. Effect of the fictive temperature on the modulus, hardness, yield strength, dynamic mechanical and creep response of Zr44Ti11Cu10Ni10Be25 metallic glasses. J Alloys Compd. 2020;819:152979), doi:10.1016/j.jallcom.2019.152979
- Datye A, Alexander Kube S, Verma D, et al. Accelerated discovery and mechanical property characterization of bioresorbable amorphous alloys in the Mg-Zn-Ca and the Fe-Mg-Zn systems using high-throughput methods. J Mater Chem B. 2019;7:5392–5400. doi:10.1039/C9TB01302D
- Lai J, Hu W, Datye A, et al. Revealing the relationships between alloy structure, composition and plastic deformation in a ternary alloy system by a combinatorial approach. J Mater Sci Technol. 2021;84:97–104. doi:10.1016/j.jmst.2020.12.038
- Sudharshan Phani P, Oliver WC. A critical assessment of the effect of indentation spacing on the measurement of hardness and modulus using instrumented indentation testing. Mater Des. 2019;164:107563), doi:10.1016/j.matdes.2018.107563
- Martin AA, Calta NP, Khairallah SA, et al. Dynamics of pore formation during laser powder bed fusion additive manufacturing. Nat Commun. 2019;10:1–10. doi:10.1038/s41467-018-07882-8
- Kim SI, Hart AJ. A spiral laser scanning routine for powder bed fusion inspired by natural predator-prey behaviour. Virtual Phys Prototyp. 2022;17:239–255. doi:10.1080/17452759.2022.2031232
- Sinico M, Jadhav SD, Witvrouw A, et al. A micro-computed tomography comparison of the porosity in additively fabricated cucr1 alloy parts using virgin and surface-modified powders. Materials (Basel). 2021;14:1995), doi:10.3390/ma14081995
- Mair P, Braun J, Kaserer L, et al. Unique microstructure evolution of a novel Ti-modified Al-Cu alloy processed using laser powder bed fusion. Mater Today Commun. 2022;31:103353), doi:10.1016/j.mtcomm.2022.103353
- Ding K, Ye L. Laser shock peening: performance and process simulation. Woodhead Publishing; 2006.
- Schaaf P. Laser processing of materials: fundamentals, applications and developments. Springer Science & Business Media; 2010.
- Fabbro R, Peyre P, Berthe L, et al. Physics and applications of laser-shock processing. J Laser Appl. 1998;10:265–279. doi:10.2351/1.521861
- Sun R, Li L, Zhu Y, et al. Microstructure, residual stress and tensile properties control of wire-arc additive manufactured 2319 aluminum alloy with laser shock peening. J Alloys Compd. 2018;737:255–262. doi:10.1016/j.jallcom.2017.12.068
- Ding K, Ye L. 3 - Simulation methodology. In: Ding K, Ye L, editor. Laser shock peen. Woodhead Publishing; 2006. p. 47–72. Available from: https://www.sciencedirect.com/science/article/pii/B9781855739291500032.
- Peyre P, Fabbro R, Merrien P, et al. Laser shock processing of aluminium alloys. Application to high cycle fatigue behaviour. Mater Sci Eng A. 1996;210:102–113. doi:10.1016/0921-5093(95)10084-9
- Fishburn JM, Withford MJ, Coutts DW, et al. Study of the fluence dependent interplay between laser induced material removal mechanisms in metals: Vaporization, melt displacement and melt ejection. Appl Surf Sci. 2006;252:5182–5188. doi:10.1016/j.apsusc.2005.07.053
- Porneala C, Willis DA. Observation of nanosecond laser-induced phase explosion in aluminum. Appl Phys Lett. 2006;89:1–4. doi:10.1063/1.2393158
- Zhigilei LV, Lin Z, Ivanov DS. Atomistic modeling of short pulse laser ablation of metals: Connections between melting, spallation, and phase explosion. J Phys Chem C. 2009;113:11892–11906. doi:10.1021/jp902294m
- Bulgakova NM, Bulgakov AV. Pulsed laser ablation of solids: Transition from normal vaporization to phase explosion. Appl Phys A Mater Sci Process. 2001;73:199–208. doi:10.1007/s003390000686
- Krishnan A, Fang F. Review on mechanism and process of surface polishing using lasers. Front Mech Eng. 2019;14:299–319. doi:10.1007/s11465-019-0535-0
- Xu J, Zou P, Liu L, et al. Investigation on the mechanism of a new laser surface structuring by laser remelting. Surf Coatings Technol. 2022;443:128615), doi:10.1016/j.surfcoat.2022.128615
- Xu J, Zou P, Wang W, et al. Study on the mechanism of surface topography evolution in melting and transition regimes of laser polishing. Opt Laser Technol. 2021;139:106947), doi:10.1016/j.optlastec.2021.106947
- Burzic B, Hofele M, Mürdter S, et al. Laser polishing of ground aluminum surfaces with high energy continuous wave laser. J Laser Appl. 2017;29:011701), doi:10.2351/1.4966923
- Snyder JC, Thole KA. Understanding laser powder bed fusion surface roughness. J Manuf Sci Eng Trans ASME. 2020;142:142), doi:10.1115/1.4046504
- Stafe M, Vlädoiu I, Negutu C, et al. Experimental investigation of the nanosecond laser ablation rate of aluminium. Rom Reports Phys. 2008;60:789–796.
- Mazzi A, Miotello A. Simulation of phase explosion in the nanosecond laser ablation of aluminum. J Colloid Interface Sci. 2017;489:126–130. doi:10.1016/j.jcis.2016.08.016
- Mercelis P, Kruth JP. Residual stresses in selective laser sintering and selective laser melting. Rapid Prototyp J. 2006;12:254–265. doi:10.1108/13552540610707013
- Chighizola CR, D’Elia CR, Weber D, et al. Intermethod comparison and evaluation of measured near surface residual stress in milled aluminum. Exp Mech. 2021;61:1309–1322. doi:10.1007/s11340-021-00734-5
- Zerbst U, Madia M, Klinger C, et al. Defects as a root cause of fatigue failure of metallic components. I: Basic aspects. Eng Fail Anal. 2019;97:777–792. doi:10.1016/j.engfailanal.2019.01.055
- Suresh S. Fatigue of materials. 2nd ed. Cambridge University Press; 1998.
- Ren XD, Zhang YK, Yongzhuo HF, et al. Effect of laser shock processing on the fatigue crack initiation and propagation of 7050-T7451 aluminum alloy. Mater Sci Eng A. 2011;528:2899–2903. doi:10.1016/j.msea.2010.12.058
- Singh AK, Datta S, Chattopadhyay A, et al. Fatigue crack initiation and propagation behavior in Al – 7075 alloy under in-phase bending-torsion loading. Int J Fatigue. 2019;126:346–356. doi:10.1016/j.ijfatigue.2019.05.024
- Ge MZ, Xiang JY. Effect of laser shock peening on microstructure and fatigue crack growth rate of AZ31B magnesium alloy. J Alloys Compd. 2016;680:544–552. doi:10.1016/j.jallcom.2016.04.179
- Bussu G, Irving PE. The role of residual stress and heat affected zone properties on fatigue crack propagation in friction stir welded 2024-T351 aluminium joints. Int J Fatigue. 2002;25:77–88. doi:10.1016/S0142-1123(02)00038-5
- Withers PJ, Bhadeshia HKDH. Residual stress part 1 - Measurement techniques. Mater Sci Technol. 2001;17:355–365. doi:10.1179/026708301101509980
- Webster GA, Ezeilo AN. Residual stress distributions and their influence on fatigue lifetimes. Int J Fatigue. 2001;23:375–383. doi:10.1016/s0142-1123(01)00133-5
- Garcia C, Lotz T, Martinez M, et al. Fatigue crack growth in residual stress fields. Int J Fatigue. 2016;87:326–338. doi:10.1016/j.ijfatigue.2016.02.020
- Becker A. The effect of laser shock peening and shot peening on the fatigue performance of aluminium alloy 7075. University of Cape Town; 2017.
- Leuders S, Thöne M, Riemer A, et al. On the mechanical behaviour of titanium alloy TiAl6V4 manufactured by selective laser melting: Fatigue resistance and crack growth performance. Int J Fatigue. 2013;48:300–307. doi:10.1016/j.ijfatigue.2012.11.011
- Zhao X, Zhang H, Liu Y. Effect of laser surface remelting on the fatigue crack propagation rate of 40Cr steel. Results Phys. 2019;12:424–431. doi:10.1016/j.rinp.2018.11.097
- Yadollahi A, Shamsaei N. Additive manufacturing of fatigue resistant materials: Challenges and opportunities. Int J Fatigue. 2017;98:14–31. doi:10.1016/j.ijfatigue.2017.01.001
- Hamidi Nasab M, Romano S, Gastaldi D, et al. Combined effect of surface anomalies and volumetric defects on fatigue assessment of AlSi7Mg fabricated via laser powder bed fusion. Addit Manuf. 2020: 100918), doi:10.1016/j.addma.2019.100918
- Zhu Z, Dhokia VG, Nassehi A, et al. A review of hybrid manufacturing processes - State of the art and future perspectives. Int J Comput Integr Manuf. 2013;26:596–615. doi:10.1080/0951192X.2012.749530
- Baek J-H, Kim C-M, Kim Y-P, et al. The influence of the microstructure on fracture toughness and fatigue crack growth properties in the base metal and weld metal of 304 pipeline for LNG transmission | L’influence de la microstructure sur la tenacite de rupture et la croissance de fissure f. IGT Int Liq Nat Gas Conf Proc. 2001;1:1–9.
- Siddique S, Imran M, Rauer M, et al. Computed tomography for characterization of fatigue performance of selective laser melted parts. Mater Des. 2015;83:661–669. doi:10.1016/j.matdes.2015.06.063
- Fernández B, Claverie F, Pécheyran C, et al. Direct analysis of solid samples by fs-LA-ICP-MS. TrAC - Trends Anal Chem. 2007;26:951–966. doi:10.1016/j.trac.2007.08.008
- Cha D, Axinte D, Billingham J. Geometrical modelling of pulsed laser ablation of high performance metallic alloys. Int J Mach Tools Manuf. 2019;141:78–88. doi:10.1016/j.ijmachtools.2019.04.004.
Appendices
Appendix A
Figure A1. Schematic describing the dL-PBF process: (a) 3D part obtained at the end of the L-PBF process, showing, from top to bottom, the focal plane (yellow), the part covered with powder, the powder bed, and the build platform, (b) build platform is moved 3 mm upwards (defocusing (DF)3) to apply selective powder removal with PW laser by sequentially scanning the defined areas 1, 2, and 3, (c) middle state of the powder removal: powder in area-1 is removed, area-2 is being scanned, which will be followed by area-3 being scanned with PW, and the white arrows show the longitudinal PW scan vectors applied for selective powder removal, (d) the final step of powder removal: build platform is moved 1 mm more upwards (DF4) to bi-directionally scan the full length of the 3PBF sample with PW obtaining powder-free surface, (e) re-melting step: build platform is moved downwards bringing the focus to the middle of the curved region (DF2). Then the part is scanned 2 times with 45° tilt scan strategy, utilising the parameters listed in in the manuscript.
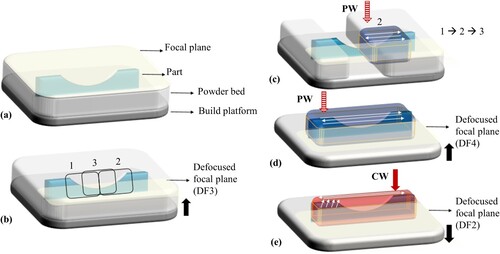
Appendix B
Figure B1. SEM images of nanoindentations applied on (YZ) cross sections of 3PBF samples with the surface conditions (a) AB, (b) R, and (c) M. The red rectangles are used to indicate measurement lines with 10 µm step size and building direction (BD) (along z axis) is indicated with the white arrow.