
 ?Mathematical formulae have been encoded as MathML and are displayed in this HTML version using MathJax in order to improve their display. Uncheck the box to turn MathJax off. This feature requires Javascript. Click on a formula to zoom.
ABSTRACT
Achieving grain refinement in the wire-arc directed energy deposition (DED) process of NiTi alloy is highly challenging. We have successfully obtained NiTi alloy with a fine microstructure and observed an improvement in superelastic recoverability by introducing an ultrasound-assisted field during the deposition process. The results show that the average grain size of the NiTi alloy samples decreased from 147.3 to 72.2 μm. Additionally, the recoverable strain of the samples increased significantly from 3.7% to 4.4%. This is attributed to the ultrasonic cavitation and acoustic streaming phenomena during the ultrasound-assisted process, which promotes the columnar-to-equiaxed transition (CET) during the solidification process. Fundamentally, the key to the enhancement of recoverable strain after ultrasound-assisted is that the formation of equiaxial grains provides more strain compatibility to the grain boundaries, which reduces the formation of dislocations during deformation.
1. Introduction
Additive manufacturing (AM) is considered to be a disruptive technology because of its extremely high design freedom and the ability to manufacture complex structural components with high efficiency and low cost [Citation1]. Wire-arc directed energy deposition (DED), which uses wire as the raw material, is considered as one of the most promising AM technologies with extremely high deposition efficiency [Citation2, Citation3]. However, wire-arc DED typically introduces coarse columnar grains with grain lengths up to the millimeter level, and often with a single orientation parallel to the building direction [Citation4]. This is mainly due to the unique thermal cycling and rapid solidification process during wire-arc DED [Citation5]. In addition, the low supercooling of the components under high-speed cooling conditions makes it difficult to achieve spontaneous nucleation [Citation6]. These complex metallurgical processes eventually lead to columnar grains. This not only generates a heterogenous microstructure but also leads to a decrease in the mechanical properties of metal components [Citation7].
Near-equiatomic NiTi alloys have excellent shape memory effects, superelasticity, and corrosion resistance [Citation8, Citation9]. This makes it extremely advantageous for applications in aerospace, solid-state cooling, and biomedical fields [Citation10, Citation11]. However, the preparation of NiTi alloys by conventional machining methods is limited by many factors, including the high reactivity and poor machinability of NiTi alloys [Citation12]. Therefore, many researchers have started to use AM technologies to fabricate NiTi alloy components [Citation8]. Numerous studies have shown that columnar grains are easily produced in NiTi alloys prepared by wire-arc DED [Citation13–15]. It is often observed that coarse columnar grains formed through epitaxial solidification span multiple deposition layers, which leads to a decrease in the mechanical properties of NiTi alloys. Therefore, it is necessary to explore grain refinement methods for wire-arc DED in order to improve the microstructure of NiTi alloys.
To achieve grain refinement during the deposition process, researchers usually use the following three methods. (i) Optimisation of deposition process parameters has been demonstrated to achieve the columnar-to-equiaxed transition (CET) in NiTi alloy through laser solid forming (LSF) [Citation16]. However, for wire-arc DED processes, it is difficult to achieve the CET solely through process parameter optimisation. Although some researchers have achieved CET in Ti alloys by controlling the travel speed, wire feed rate, and welding current [Citation17, Citation18]. However, the size of the equiaxed grains is still coarse (about 500 μm). It is challenging to further reduce the size of equiaxed grains by optimising process parameters. (ii) Alloying has been proven to significantly enhance nucleation ability during the deposition process [Citation6]. Studies have shown that through the addition of La2O3 particles into NiTi powder, the nucleation rate during solidification can be increased, resulting in smaller equiaxed grains in the AM process [Citation19]. This significantly improves the uniformity of the NiTi alloy microstructure. Meanwhile, the grain refinement effectively increases the resistance to plastic deformation, which is beneficial for enhancing the superelastic recoverability. However, alloying does change the composition and properties of the NiTi alloy to some extent, such as significantly altering the phase transformation temperature of NiTi alloy [Citation20]. Additionally, the addition of particles in wire-arc DED of NiTi alloys complicates the fabrication process. (iii) Introducing external field assistance during the AM process can significantly refine the grain size while maintaining the alloy’s chemical composition. Common types of external field assistance include ultrasonic [Citation21], magnetic [Citation22], thermal [Citation23], and mechanical deformation fields [Citation24]. As one of the commonly used methods, ultrasound-assisted field has been widely applied in the AM process [Citation25, Citation26]. This technique can not only achieve grain structure refinement but also promote the alleviation of texture and enhancement of material uniformity. Previous studies have shown that ultrasound-assisted field can introduce cavitation and acoustic streaming phenomena to the melt pool [Citation27], which helps in breaking up dendrites during solidification and promoting grain refinement. Additionally, ultrasound-assisted field can effectively enhance the homogenisation of alloying elements, thereby improving the morphology and distribution of precipitates. However, for wire-arc DED of NiTi alloys, whether ultrasound-assisted field can be applied to achieve CET and enhance mechanical properties still requires systematic research.
In this study, we introduced ultrasound-assisted field into the AM process of NiTi alloys. The effect of ultrasound-assisted field on the evolution of microstructure and mechanical properties is discussed by adjusting the ultrasonic power. The results show that ultrasound-assisted field can induce equiaxed grains of NiTi alloys during deposition, thus significantly increasing the recoverable strain. This work aims to extend the existing research on NiTi alloys and provide a new strategy for grain refinement of NiTi alloys.
2. Materials and methods
2.1. Materials and processing
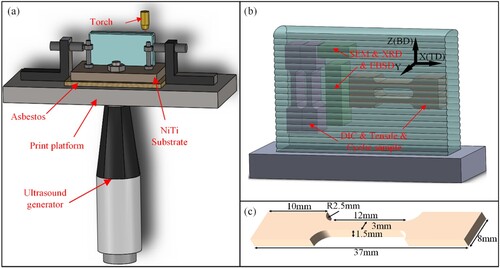
In this study, NiTi wall-shaped component was prepared using ultrasound-assisted wire-arc DED equipment in an argon atmosphere (99.99% pure). The whole equipment consists of a CMT welding power source, a wire feeding robot and a home-made ultrasound-assisted system, and a schematic diagram on the deposition process is shown in a. A commercial NiTi wire with a diameter of 1.2 mm and a nominal composition of Ni50.8Ti49.2 was used as the raw material. Impurities were kept below 0.037 wt% C, 0.003 wt% N, 0.001 wt% H, and 0.037 wt% O. The substrate is a rolled plate with a nominal composition (Ni50.8Ti49.2) close to the wire and a thickness of 15 mm to avoid cracking between the wall-shaped component and the substrate during the deposition process. According to our previous studies [Citation28, Citation29], NiTi alloys can exhibit good forming quality within a wide process window. In this work, we select optimised process parameters (wire feeding speed of 6 m/min, travel speed of 0.2 m/min, current of 131 A, voltage of 13.7 V) to ensure both a stable forming process and good forming quality. Ultrasound with a frequency of 15 kHz was introduced into the deposition process of the NiTi wall-shaped component through an ultrasound generator with a selected power of 90 and 180 W, respectively. The selection of ultrasonic power was based on the following reasons: (i) the separation of the ultrasonic generator from the substrate at lower power not only reduces the ultrasonic effect but also generates serious noise, which is unfriendly, and (ii) a too high power affects the deposited forming quality and causes some wear on the ultrasonic generator. A NiTi wall-shaped component with dimensions of 75 mm × 12 mm × 50 mm was deposited using an alternate deposition path. For convenience, we define the sample without ultrasound as SAD, and the samples with ultrasound power of 90 and 180 W as S90 and S180, respectively.
Figure 1. (a) Schematic diagram of ultrasound-assisted additive manufacturing process; (b) Test sample locations; (c) Dimensions of tensile and cyclic loading test samples.
2.2. Microstructural characterisation and mechanical test
Metallographic samples were extracted from wall-shaped components along the travel direction (TD) and building direction (BD) using wire electro-discharge machining (EDM). The metallographic samples were ground and polished, and then chemical etched in mixed etchant (2HF + 5HNO3 + 30H2O) for 60 s. The precipitates and fracture morphology of the samples were observed using a scanning electron microscopy (SEM, SU8230). The grain structure of the samples was examined using an electron backscattered diffraction (EBSD). The acceleration voltage of EBSD was 15 kV, the working distance was 15 mm, and the scan step was 3 μm. The data obtained by EBSD were interpreted using AztecCrystal software. Further investigations on the precipitates and dislocations in the samples were conducted using a transmission electron microscopy (TEM, Talos F200X) operating at an acceleration voltage of 200 kV. The phase structure was analyzed by X-ray diffractometer (XRD, Bruker D8 Advance) with a scanning angle of 20°–90°. The XRD was operated at 40 kV and 40 mA with a step size of 0.02°. The phase transformation behaviour of the samples was studied by differential scanning calorimetry (DSC, Discovery DSC250) with test temperatures ranging from −90°C to 90°C and a cooling and heating rate of 10°C/min. The hardness of the sample was determined using a microhardness machine, with a test load of 200 g and a dwell time of 15 s. To ensure the accuracy of the data, measurements were taken five times at the same height.
To evaluate the mechanical properties of the wall-shaped component, tensile samples were extracted by wire EDM in the middle region of the wall-shaped component, as shown in (b). Uniaxial tensile and cyclic loading tests were performed on the samples in TD and BD directions by a universal testing machine (CMT5100) at room temperature (25°C) with a strain rate of 4 × 10⁻⁴ /s. The dimensions of the tensile and cyclic samples are shown in (c). The same type of sample was tested at least three times to ensure reproducibility. The uniaxial tensile test was continuously loaded until the specimens fractured. The cyclic loading test was loaded with a maximum strain of 6% and then unloaded to a zero-stress state. The superelastic behaviour of the samples was evaluated by 10 cyclic loading tests. Digital image correlation (DIC) was used in the cyclic loading test to evaluate the evolution of the local strain field of the sample.
3. Results
3.1. Microstructure
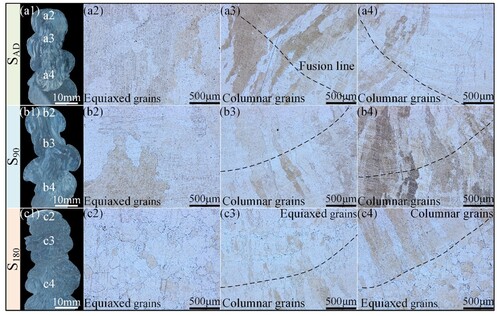
shows the cross-sectional morphology and metallographic structure of the samples with and without ultrasound-assisted field, using the smallest magnification that can still exhibit grain boundaries with good contrast. The cross-sectional profile of the sample clearly shows periodically arranged weld path ((a1–c1)). Due to the introduction of ultrasonic waves, the stability of the molten pool is reduced, and it can be observed that as the ultrasonic power increases, the fluctuation of the molten pool morphology intensifies. However, it is still possible to ensure the formation of wall-shaped components. Coarse equiaxed grains were observed in the top region of the SAD and S90 samples ((a2–b2)), while fine equiaxed grains were observed in the S180 sample ((c2)). The middle region of both SAD and S90 samples exhibits elongated columnar grain structures ((a3, a4, b3, and b4)). In the S180 sample, an alternating distribution of equiaxed and columnar grains is observed ((c3, c4)). Based on the observed metallographic structure, we conclude that the microstructure in the middle region is relatively uniform and does not exhibit any obvious gradient structure.
Figure 2. (a1–c1) Cross-sectional morphology of wall-shaped components; Metallographic structure of different regions of the (a2–a4) SAD, (b2–b4) S90, and (c2–c4) S180 samples.
shows the grain structure and size distribution of NiTi alloy samples with and without ultrasound-assisted field using EBSD. Samples for EBSD analysis were extracted from the same height and were all located in the middle region of the wall-shaped component, as shown in (b). As shown in (a1–c1), the grains are slightly inclined towards the center of the fusion zone in different samples. This is the result of the movement of the heat source and the change in the direction of the maximum temperature gradient [Citation30]. Affected by the rapid cooling during deposition, the SAD samples show continuous coarse columnar grains in the X-Z plane ((a1)), which is commonly found in previous wire-arc DED studies [Citation31, Citation32]. The S90 sample still exhibits coarse columnar grains. However, the production of some small-sized columnar grains can already be observed, with clear interfaces between the layers, as shown in (b1). The microstructure of the S180 sample shows periodically varying heterogeneous bands, with clearly refined grain size ((c1)). This phenomenon indicates that high-intensity ultrasound disrupts the growth of columnar grains and has a significant contribution to the change of grain structure.
Figure 3. The EBSD of (a1–c1) X-Z and (a2–c2) X-Y planes of SAD, S90, and S180 samples; (a3–c3) Grain size statistics of SAD, S90, and S180 samples.
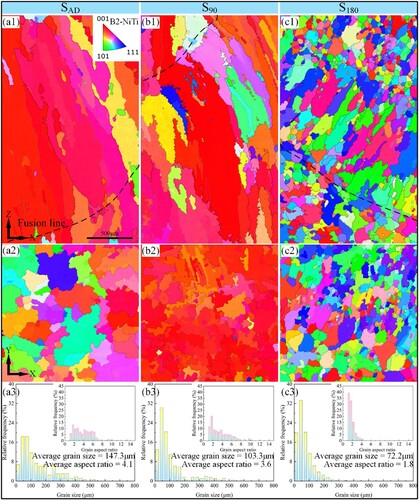
In the X-Y plane, the microstructure of NiTi samples are all equiaxed B2 grains with different average grain sizes. It should be noted that the grain size of the SAD samples is mainly ranges from 45 to 255 μm, which is much larger than the grain size of the S90 (ranges from 15 to 135 μm) and S180 samples (ranges from 15 to 105 μm). The average grain sizes of the SAD, S90, and S180 samples were 147.3, 103.3, and 72.2 μm, respectively ((a3–c3)). Apparently, higher ultrasonic power contributes to grain refinement. To further evaluate the grain structure, the aspect ratios of the grains were counted in the X-Z plane. The average aspect ratios of the SAD, S90, and S180 samples were 4.1, 3.6, and 1.8, respectively. We define the aspect ratio less and more than 2.5 as equiaxed grains and columnar grains, respectively [Citation33]. In detail, the content of equiaxed grains in the SAD, S90, and S180 samples was 28.9%, 41.3%, and 87.4%, respectively. The content of equiaxed grains increased by 42.9% (90W) and 202.4% (180W), respectively, using ultrasound-assisted during the deposition process. Obviously, ultrasound-assisted field is beneficial to CET in NiTi alloy. It can be concluded that the present work infuses new vitality into the CET of wire-arc DED NiTi alloys.
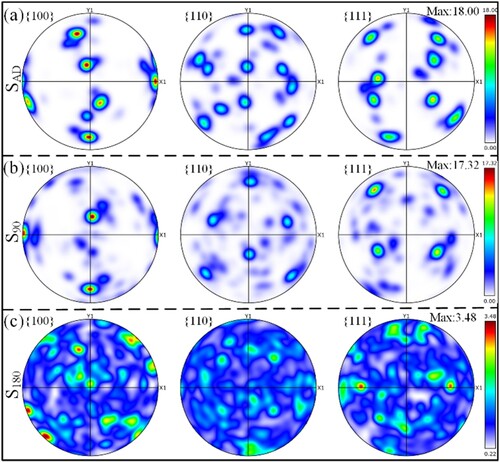
To analyze the effect of ultrasound-assisted field on the crystallographic texture, EBSD data was further used to produce the pole figures, as shown in . The multiples of uniform distribution (MUD) was used to evaluate the crystallographic texture, where a MUD value of 1 indicates random texture. As shown in (a), the SAD sample has a clear crystallographic texture, and the intensity of MUD is 18. Specifically, the B2 grains in the SAD sample show the preferred cubic texture component {001} <100>. The grains in the SAD sample are mainly orientation along the (001) direction as shown in (a1). There is no significant change in crystallographic texture in the S90 sample ((b)), with the maximum value of MUD being 17.3. The slight decrease in the MUD value may be due to the presence of a small number of grains in the (101) and (111) directions ((b1)). With increasing ultrasonic power, the maximum value of MUD in the S180 sample decreases to 3.5. This indicates that the cubic texture component {001} <100> is not dominating in the S180 sample and no other preferred texture component is observed. The B2 grains in the S180 sample exhibit a near random crystallographic texture. As shown in (c1), a combined orientation of (001), (101), and (111) was formed at an ultrasonic power of 180 W. From the results given above, it can be confirmed that ultrasound-assisted field is beneficial to eliminate the preferred texture during the deposition process.
Figure 4. Pole figures of (a) SAD, (b) S90, and (c) S180 samples.
3.2. Phase analysis
(a) compares the XRD results of the samples with different ultrasound-assisted power. The data obtained at 25°C show that all samples consist of the B2 austenite phase. The B2 austenite peaks that can be clearly identified in the XRD patterns are (100), (110), (200), and (211) Miller indices, respectively. The observed significant changes in peak intensity of the samples at different ultrasound-assisted powers further indicate the transition of sample texture.
Figure 5. (a) XRD of samples before and after ultrasound-assisted; (b) Morphology, (c) elemental distribution at point A and (d) elemental mapping of Ti2Ni precipitates in SAD samples.
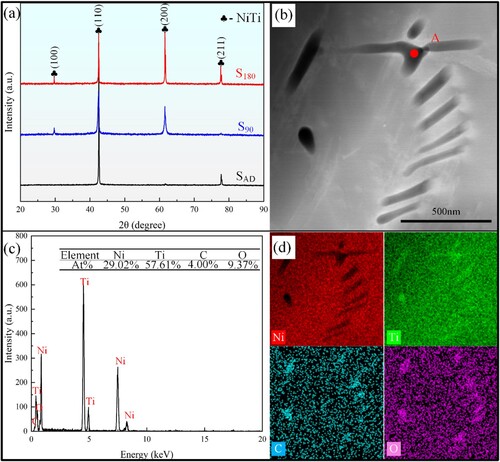
Generally, XRD can only detect diffraction peaks corresponding to B2-NiTi, and the content of precipitates is relatively low. By TEM analysis, some submicron-sized precipitates can be detected at grain boundaries and inside the grains. (b) shows the typical morphology of rod-like precipitates in the SAD sample with lengths ranging from 150 to 650 nm. The elemental mapping of the precipitates using EDS shows that the elemental composition of the precipitates is 29.02 at% Ni, 57.61 at% Ti, 4.00 at% C, and 9.37 at% O. We conclude that the precipitates are Ti2Ni. The generation of the Ti2Ni phase is mainly due to the high temperature and fast cooling rate during the AM process. The AM process generates higher heat input inside the melt pool. Since the boiling point of Ni atoms (2913°C) is lower than that of Ti atoms (3287°C), the Ni atoms are more likely to evaporate [Citation34]. The loss of Ni atoms and the segregation of chemical composition leads to the generation of a Ti-rich liquid phase in the local region. When the melt pool temperature is lowered to 984°C, the NiTi phase and the surrounding Ti-rich liquid phase undergo the peritectic reaction NiTi + L(Ti) → Ti2Ni, leading to the precipitation of the Ti2Ni phase [Citation35, Citation36]. Therefore, the Ti2Ni phase was observed in our study. A similar Ti2Ni phase was found in previous studies of Ni-rich NiTi alloy AM [Citation37, Citation38].
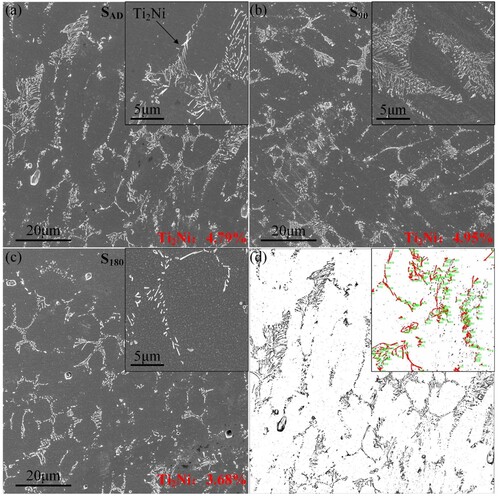
shows the distribution of the Ti2Ni phase in the three different samples by SEM. The Ti2Ni phases of uneven size show the cluster-like distribution in the NiTi matrix. To evaluate the effect of ultrasound on the precipitate content, the precipitates were counted using Image-J. To better extract the precipitates, the raw images were processed as shown in (d). The statistical results showed that the Ti2Ni phase content in the SAD, S90, and S180 samples were 4.79%, 4.95%, and 3.68%, respectively. As mentioned earlier, the precipitation of the Ti2Ni phase comes from the generation of the Ti-rich liquid phase region. The higher ultrasonic power helps to promote the diffusion of atoms, thus alleviating the segregation of local chemical components, thereby reducing the generation of the Ti-rich liquid phase. This is the main reason for the reduction of the Ti2Ni phase in the S180 sample. In contrast, there is no significant change in the precipitate content in the S90 sample, and the possible explanation is that the lower ultrasonic power is not sufficient to promote the diffusion of atoms, especially under fast cooling conditions.
Figure 6. Distribution of precipitates in (a) SAD, (b) S90, and (c) S180 samples; (d) Processing results of the raw image.
3.3. Phase transformation behaviour
The phase transformation behaviour of the samples with and without ultrasound-assisted field was characterised using DSC and the results are shown in . The sample used for DSC analysis is located in the middle region of the wall-shaped component. From the DSC results the corresponding transformation temperatures can be obtained, as shown in . The transformation temperatures include martensite start temperature (Ms), martensite finish temperature (Mf), austenite start temperature (As), and austenite finish temperature (Af). The transformation temperatures were determined from the DSC curves by the tangent method. The results showed that the samples under different conditions exhibited B2 → B19′ one-step martensitic phase transformation during cooling. The B19′ → B2 phase transformation was carried out during heating. Secondly, the Ms of the samples are well below room temperature, which indicates that no martensitic phase transformation occurs during the deposition process. The final deposited samples are mainly occupied by the B2 austenite phase. This is consistent with the EBSD and XRD test results. Compared to the variation in ultrasonic power, there is no significant change in the phase transformation temperature. It can be concluded that ultrasound-assisted field does not significantly affect the phase transformation behaviour.
Figure 7. Phase transformation behaviour of samples with and without ultrasound-assisted.
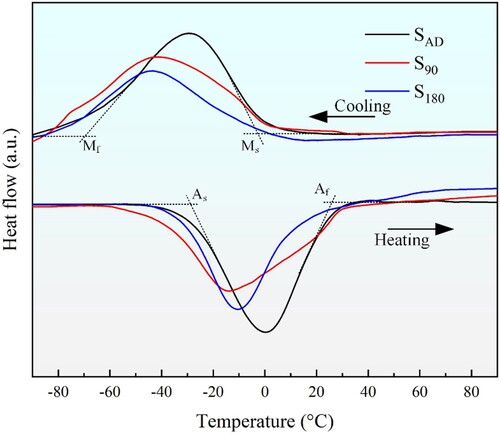
Table 1. Transformation temperature of samples with and without ultrasound-assisted.
3.4. Hardness and Ni content
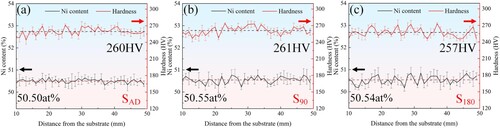
The distribution of hardness and Ni content along the building direction of the samples with and without ultrasonic assistance is shown in . With the increase in deposition height, noticeable fluctuations in hardness and Ni content are observed but remain within a stable range. The hardness values for the SAD, S90, and S180 samples are 260 HV, 261 HV, and 257 HV, respectively. The Ni element content is measured to be 50.50 at%, 50.55 at%, and 50.54 at% for the corresponding samples. The Ni content in the NiTi alloy wire is 50.8 at%, and the decrease in Ni content in the deposited samples can be attributed to the evaporation of Ni during the deposition process. We conclude that the distribution of hardness and Ni element content in the middle region of the deposition layer is relatively uniform.
Figure 8. Hardness and Ni content of (a) SAD, (b) S90, and (c) S180 samples along the building direction.
3.5. Mechanical properties
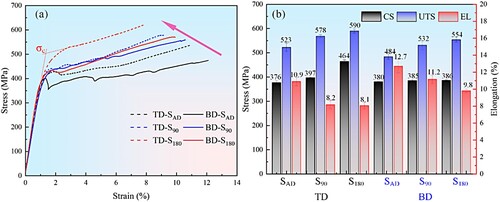
(a) shows the stress–strain curves of the three different samples along the TD and BD directions. The statistics of critical stress (CS), ultimate tensile strength (UTS), and elongation (EL) of the samples in different conditions were listed in (b). The CS reflects the critical value of the stress-induced martensitic phase transformation, which is determined by the tangent method. The stress–strain curves shown in (a) are consistent with the superelastic mechanical behaviour of the austenitic NiTi alloy, i.e. with increasing stress austenite undergoes elastic deformation. Stress-induced martensitic phase transformation occurs when the applied stress is greater than the CS. Finally, it undergoes reorientation and plastic deformation of the martensite until fracture. As the ultrasonic power increases, the CS in the TD direction samples increases from 376 MPa to 464 MPa. We believe that the change in CS is mainly due to the grain refinement. The increase in ultrasonic power resulted in a significant decrease in the grain size of the samples. Previous studies have shown that the relationship between CS and grain size is consistent with the Hall-Petch relationship [Citation39]. Nevertheless, the CS of the BD direction samples is basically the same, all around 380 MPa. The possible explanation is that the presence of columnar grains regions in the samples counteracts the increase in CS caused by small-sized equiaxed grains. Even so, the formation of small-sized equiaxed grains still contributes significantly to the UTS. It can be seen that in the BD direction, the UTS increases from 484 MPa to 554 MPa with the increase of ultrasonic power. Of course, this is opposed by the decrease in elongation. The elongation of all samples exceeded 8%, which is comparable to the reported elongation of the samples prepared by AM of NiTi alloy [Citation40–43]. Therefore, by changing the ultrasonic power, the microstructure of the sample is improved, which can synergistically regulate the strength and toughness of NiTi alloy.
Figure 9. (a) Stress-strain curves in TD and BD directions of the different types of samples; (b) Statistics of critical stress, ultimate tensile strength, and elongation of samples tested in TD and BD directions
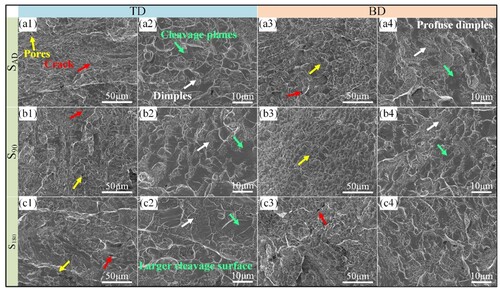
The fractography of the samples with and without ultrasound-assisted field after tensile test was analyzed by SEM, as shown in . The overall fracture morphology of the samples in different conditions shows a typical hybrid ductile-brittle fracture feature. Both dimples and cleavage surfaces are present on the fracture surface. Pores and cracks on the fracture surface can be observed, however, there is no evidence that the ultrasound-assisted field has a recognisable effect on their formation. It is worth mentioning that the fracture morphology of the TD directions samples is dominated by the cleavage surface, and it can be seen that the samples contain more larger cleavage surfaces, especially in the S180 samples ((c2)). On the other hand, the fracture morphology of the BD directions samples is dominated by dimples. In particular, abundant small-sized dimples were observed in the SAD samples ((a4)). This is in excellent agreement with the higher elongation exhibited by the SAD samples during tensile testing ((a)).
Figure 10. Fracture morphology of (a1–a4) SAD, (b1–b4) S90, and (c1–c4) S180 samples in TD and BD directions.
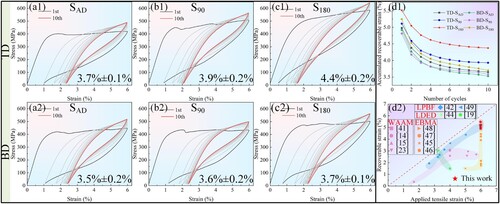
The tensile superelastic behaviour of the samples with and without ultrasound-assisted field were evaluated by cyclic loading tests (). The cyclic loading tests were performed at room temperature and it can be concluded that the samples were all in the austenitic state. The samples under different conditions showed significant recoverability during cyclic loading tests. At a maximum strain of 6%, the recoverable strain of all samples after the 10th cycle exceeded 3.5%. Specifically, the recoverable strain of the 1st cycle SAD samples were 5.0% and 4.9% in the TD and BD directions, respectively. After 10 cycles, the recoverable strain was 3.7% and 3.5%, respectively. It can be seen that the superelastic response of the SAD samples is highly consistent in the TD and BD directions ((a1 and a2)). The superelastic response of the S90 sample is essentially the same as that of the SAD sample. However, the recoverable strain of the S90 sample increases slightly. The recoverable strain of the S90 sample after the 10th cycle was 3.9% and 3.6% in the TD and BD directions, respectively ((b1 and b2)). In contrast, the superelastic response of the S180 sample was significantly different in the TD and BD directions. The recoverable strain of the S180 sample in the 1st cycle was 5.5% and 5.2% in the TD and BD directions, respectively. After 10 cycles, the recoverable strain was 4.4% and 3.7%, respectively ((c1 and c2)). This indicates a significant increase in recoverable strain along the TD direction. This is mainly due to the fully equiaxed grains in the TD direction of the S180 sample, which improves the superelasticity of the sample. (d1) shows the relationship between the recoverable strain and the number of cycles for the samples in different conditions. Apparently, the samples in different conditions show similar evolutionary trends. Specifically, after the 1st cycle, the samples produced a large residual strain, while the recoverable strain gradually decreased and stabilised as the cycling process continued. The statistics of the recoverability of the samples during the first cycle are shown in (d2). It is worth mentioning that the recoverable properties of the samples in this paper are comparable to the excellent results in the literature [Citation14, Citation15, Citation19, Citation23, Citation41, Citation42, Citation44–49].
Figure 11. Tensile superelastic behaviour of SAD, S90, and S180 samples in (a1–c1) TD and (a2–c2) BD directions; (d1) Relationship between recoverable strain and number of cycles; (d2) Tensile superelasticity of the NiTi alloy in this work and the AM-deposited NiTi alloy reported in the literature.
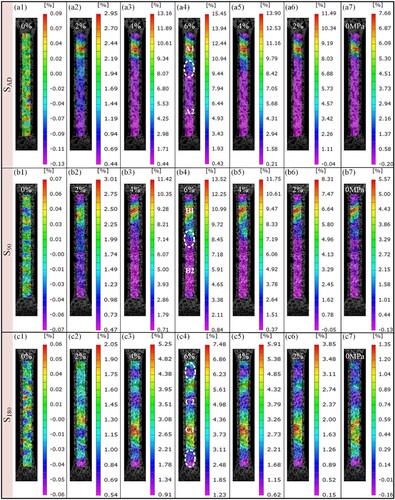
The local strain evolution of the BD direction samples during the first cycle was observed using DIC. It is clear that the strain evolution of the samples with and without ultrasound-assisted field shows a diffusion mode with visible strain differences in a drastic gradient. In detail, the strain is uniformly distributed within the sample in the initial state ((a1–c1)). As the stress increases, the strains start to localise, resulting in distinct Lüders bands, as shown in the red region in (a2–c2). With further increase of stress, the strain shows a diffusion evolution mode centered on the Lüders band (shown in the region A1–C1 in ). A clear transformation fronts are observed in the samples as shown in the white dashed region in (a4–c4). Clear strain gradients were observed in the SAD and S90 samples. At an overall strain of 6%, the local strain ranges from 0.43 to 15.45% for SAD samples and 0.83–13.52% for S90 samples. Next, after unloading to the zero-stress state, the maximum strains in the local region were 7.66% and 5.57% for the SAD and S90 samples, respectively. In contrast, the strain distribution during cycling was more uniform for the S180 sample. As shown in c4, the local strains in the S180 sample range from 1.23 to 7.48% at an overall strain of 6%. The maximum value of the local region strain after unloading was 1.35%. Multiple transformation fronts were also observed in the S180 sample, which may be related to the heterogeneous band that occurs periodically in the sample. The strains in the TD direction samples have similar evolutionary characteristics, which are not repeated here.
Figure 12. Local strain evolution in the BD direction for the (a1–a7) SAD, (b1–b7) S90, and (c1–7) S180 samples during the first cycle.
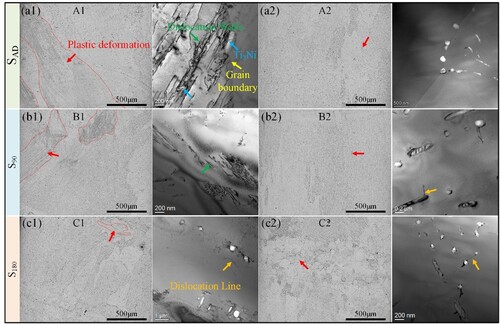
To better analyze the changes of microstructure in the samples after cyclic loading, we performed OM and TEM observations of the six regions marked in , as shown in , where the area A1 in corresponds to (a1), and so on. Here we need to emphasise that all samples were prepared by electrolytic polishing, which was done to eliminate scratches during the sample preparation process and thus to better observe the plastic deformation traces. The results of the OM observations show that the A1 and B1 regions exhibit significant plastic deformation ((a1 and b1)). The generation of plastic deformation is also consistent with the significant residual strain seen in SAD (7.66%) and S90 (5.57%) samples after cyclic loading. Only a small amount of concentrated plastic deformation was observed in the C1 region, which is consistent with the trace residual strain seen in the S180 (1.35%) sample after cyclic loading. In the A2–C2 region, we did not observe a concentrated region of plastic deformation, and only a few bands of plastic deformation were observed ((a2–c2)). Further analysis using TEM showed that a large number of dislocation walls were present in the A1 and B1 regions. A small number of dislocation lines were observed in the C1 region. In contrast, there is almost no dislocation generation in the A2–C2 region.
Figure 13. OM and TEM observations of the (a1) A1, (a2) A2, (b1) B1, (b2) B2, (c1) C1, and (c2) C2 regions in .
4. Discussion
4.1. Effect of ultrasound on solidification behaviour
During the wire-arc DED process, the formation of coarse columnar grains is not only a common issue in NiTi alloys but also observed in many alloy systems [Citation31, Citation50]. As shown in , the results of this study indicate that ultrasound-assisted field is beneficial in promoting the CET of NiTi alloy, thereby achieving grain refinement. According to the available studies [Citation21, Citation51], the factors leading to grain structure refinement during solidification mainly include ultrasonic cavitation and acoustic streaming phenomena.
The mechanisms of ultrasonic cavitation on grain refinement include the promotion of nucleation and fragmentation of dendrites. The threshold at which ultrasonic cavitation occurs can be expressed in terms of Black threshold pressure [Citation52]:
(1)
(1) where P0 (0.101 MPa) is the standard atmospheric pressure, Pv is the saturated vapour pressure of about 0 MPa, and σ is the surface tension coefficient value of the NiTi alloy melt of 1.75 N/m [Citation53]. R0 is the initial radius of the tiny bubbles in the melt. When R0 is in the range of 10–50 μm, the ultrasonic cavitation threshold value
is between 0.12 and 0.22 MPa. The actual sound pressure amplitude (Pm) during ultrasound-assisted is given by the following equation [Citation54]:
(2)
(2)
(3)
(3) where ρ is the density of NiTi alloy of 6.5 g/cm3; I is the sound intensity; c is the speed of sound in the NiTi alloy of 5400 m/s [Citation55]; ω is the angular frequency, which can be calculated from the ultrasonic frequency (15 kHz); A (ranges from 10 to 20 μm) is the amplitude of the ultrasonic process obtained from the substrate using a laser vibrometer. Therefore, the Pm in the ultrasound-assisted process ranges from 0.33 to 0.66 MPa. This indicates that the ultrasonic power used in the experimental process may induce cavitation in the molten pool.
The phenomenon of acoustic streaming contributes to the formation of a uniform temperature field inside the melt pool, thus reducing the temperature gradient, which is beneficial to hindering the rapid growth of columnar grains [Citation56]. Meanwhile, acoustic streaming can transfer the dendritic fragments produced by ultrasonic cavitation and provide more nucleation sites for the generation of equiaxed grains in the melt pool [Citation54].
According to Sections 3.1 and 3.2, the differences in the microstructure between the samples with and without ultrasound-assisted field mainly focus on the grain structure. Specifically, compared to the SAD sample, the S90 sample still exhibits columnar grains in the X-Z plane, but the intervention of ultrasound is clearly observed to have a refining effect on the grain size based on the grain size statistics in the X-Y plane (decreased from 147.3 to 103.3 μm). When the ultrasonic power is increased to 180 W, the grain size in the X-Y plane further decreases (72.2 μm), while the formation of fine equiaxed grains is observed in the X-Z plane.
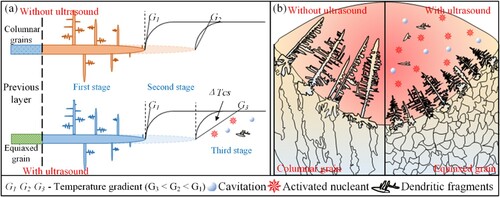
Combined with the above analysis we schematically illustrate the grain structure evolution in the melt pool with and without ultrasound-assisted field ((a)). According to previous studies [Citation57], constitutional supercooling (ΔTcs) is the main driving force for the grain structure evolution during solidification. In the first stage, partial remelting occurs at the bottom of the melt pool, and the grains grow outward from the remelted zone to produce epitaxial solidification. We believe that the temperature gradient in front of the solid–liquid interface in this stage is very steep and ΔTcs is small. Different samples are in this stage at the beginning of solidification. Accompanying the solidification process, in the second stage, the temperature gradient decreases with the columnar grains grow during epitaxial solidification, and ΔTcs is gradually increases before the columnar grains. Even so, the ΔTcs remain small and is not sufficient to activate the CET of NiTi alloy. The results of (a1 and b1) show that the SAD and S90 samples still exhibit a columnar grain structure. Therefore, we deduce that the SAD and S90 samples have remained in the second stage throughout the solidification process. As the temperature gradient continues to decrease, the columnar grains further grow and ΔTcs gradually increases. When ΔTcs exceeds the undercooling nucleation (ΔTn) critical point, it enters the third stage, triggering the continuous nucleation of equiaxed grains. As shown in (c1), in the S180 sample, continuous formation of equiaxed grains is observed when the columnar grains grow to approximately 300–500 μm. This indicates that the solidification process of the S180 sample enters the third stage. Based on the previous discussion, cavitation and acoustic streaming phenomena have a significant promoting effect on the transition of the S180 sample from the second stage to the third stage. In detail, the tiny bubbles caused by cavitation phenomena generate instantaneous local high pressure and high temperature during the collapse process. According to the Clausius–Clapeyron equation [Citation58], this will increase the melting point of the NiTi alloy, thus increasing the supercooling and promoting grain nucleation. The solute exchange caused by the acoustic streaming phenomenon also helps to reduce the temperature gradient at the solidification front. Meanwhile, the high pressure generated by the collapse of the tiny bubbles is sufficient to cause the fragmentation of dendrites and thus prevent the formation of columnar grains [Citation59, Citation60]. Therefore, as shown in (b), we believe that ultrasound-assisted wire-arc DED has the potential to achieve CET of NiTi alloys.
Figure 14. Schematic diagram of (a) grain evolution and (b) grain growth in front of the solid–liquid interface with and without ultrasound-assisted.
For the S90 sample, the grain structure was observed to remain as narrow columnar grains, and one possible reason is that ultrasonic cavitation may not have occurred within the melt pool. Existing studies show that there is a significant attenuation of the ultrasound energy during propagation. The relationship between ultrasonic amplitude A and deposition layer height z can be described by the following equation [Citation21]:
(4)
(4) The calculated results indicate that the Pm in the middle region of the deposition layer (z = 30 mm) for the S90 and S180 samples are 0.23 and 0.46 MPa, respectively. Considering the dissipation in the actual process, the energy of the ultrasonic waves will be further reduced. Therefore, in the case of the S90 sample, the actual Pm may be lower than the ultrasonic cavitation threshold value (0.22 MPa), which is not sufficient to induce the formation of continuous equiaxed grains. Apparently, the ΔTcs in this work is still not sufficient to achieve the CET at an early stage of solidification. Further studies can advance the CET by optimising the ultrasonic parameters or adding nucleation particles to promote dendrite fragmentation and enhanced nucleation.
4.2. Mechanisms of superelastic evolution
The cyclic loading tests results () show that the recoverable strains of the SAD, S90, and S180 samples in the BD direction after 10 cycles are 3.5%, 3.6%, and 3.7% respectively. This indicates that the superelastic response of the samples in the BD direction is consistent. We believe that the main reason for this phenomenon is that the samples in the BD direction always contain multiple deposition layers, which results in the presence of columnar grains in the test samples. According to the observation results of the samples under OM ((a1–c1)) after cyclic loading, it is evident that the plastic deformation of the samples mainly occurs in the columnar grain regions. The EBSD test results show that the columnar grains in the SAD and S90 samples exhibited a distinct <001> fiber texture, while the columnar grains in the S180 sample showed apparent isotropic characteristics (). Furthermore, the MUD values further confirmed the preferred cubic texture component {001} <100> in the columnar grains of the SAD and S90 samples (). According to previous studies, columnar grains orientation in the same direction as the cyclic loading direction are unfavourable for stress-induced martensitic transformations [Citation61]. In contrast, plastic deformation of B2 austenite may be more likely to occur, as this is essentially consistent with the slip system ({110} <001>) of B2 austenite [Citation62, Citation63]. This leads to the generation of a large amount of plastic deformation in the SAD and S90 samples during the cyclic loading process. The testing results from DIC also indicate that the maximum values of residual strain in localised regions of the SAD and S90 samples after the first cycle of loading were 7.66% and 5.57%, respectively. TEM results reveal the presence of a significant number of dislocation lines in the regions of plastic deformation ((a1 and b1)). We believe that during the cyclic loading process of SAD and S90 samples, both plastic deformation and stress-induced martensitic phase transformation occur simultaneously, resulting in a decrease in recoverable strain. Due to the random orientation of the grains, the S180 sample exhibits less pronounced plastic deformation during the cyclic loading process ((c1 and c2)). However, TEM results indicate the presence of a certain amount of dislocation within the sample. We believe that the dislocations generated during the stress-induced martensitic transformation process are the primary cause of the decrease in recoverable strain in the S180 sample. Detailed analysis of the DIC test results revealed that although the SAD and S90 samples underwent significant plastic deformation during loading, this was limited to small localised regions (as shown in regions A1 and B1 in ), while the majority of regions, including A2 and B2, remained in the elastic deformation stage (). The tensile test results showed that the strain required for stress-induced martensitic transformation was approximately 1.5% (), and the local strains in regions A2 and B2 under maximum strain conditions (6%) were still less than 1.5%. The observation results of (a2 and b2) also indicate that there are almost no dislocations generated in the matrix of SAD and S90 samples. This indicates that plastic deformation is not uniform and only occurs in small localised regions. In contrast, the deformation process of the S180 sample is uniform, and stress-induced martensitic transformation occurs in most regions during cyclic loading (as shown in region C1 in (c4)), resulting in the generation of dislocations in most regions ((c1)). In summary, the dislocations generated by B2 austenite plastic deformation are the main cause of the decrease in recoverable strain in the SAD and S90 samples, while the dislocations generated by stress-induced martensitic transformation are the main cause of the decrease in recoverable strain in the S180 sample.
In contrast to the results of the cyclic loading test on the BD direction sample, there are significant differences in the recoverable strain of the TD direction sample. Specifically, the recoverable strains after 10 cycles for the SAD, S90, and S180 samples are 3.7%, 3.9%, and 4.4% respectively. As the ultrasonic power increases, the recoverable strain of the samples in the TD direction gradually increases. This can be attributed to the more pronounced microstructural evolution induced by ultrasound-assisted field in the TD direction. The grain orientation in the TD direction is inconsistent with the tensile direction, indicating that plastic deformation of the B2 austenite is not the dominant factor. Therefore, the dislocations generated during the stress-induced martensitic transformation process become the primary factor influencing the recoverable strain. During the cyclic loading process, a large number of dislocations are generated in the matrix due to stress-induced martensitic transformation, which subsequently accumulate significantly at grain boundaries, resulting in significant internal stresses to resist external stresses [Citation64]. Once the influence of internal stresses during the loading process exceeds the strength of grain boundaries, the grain boundaries will be disrupted, leading to a rapid decrease in recoverable strain [Citation65]. This is the main reason for the lower recoverable strain in the SAD sample during the cyclic loading process. The increase in recoverable strain in the ultrasound-assisted samples may be due to grain structure refinement. The EBSD test results show that the average grain sizes of the SAD, S90, and S180 samples are 147.3, 103.3, and 72.2 μm respectively (). This indicates that the introduction of ultrasound-assisted leads to an increasing grain boundary density in the TD direction of the sample, enhancing the hindrance effect of grain boundaries on dislocations, which to some extent hinders dislocation slip. Furthermore, the increase in CS suppresses the formation of new dislocations [Citation38]. The tensile test results show that the S180 sample has a higher CS (), which reduces the accommodation of dislocations during the cyclic loading process. In other words, the equiaxed grains in the S180 sample provide more strain compatibility dependent on grain boundaries, which promotes stress-induced martensitic transformation and related CS [Citation66]. This indicates that the generation and slip of dislocations during the cyclic loading process are the main reasons for the decrease in recoverable strain, while grain refinement can inhibit the generation and slip of dislocations, thereby enhancing the recoverable strain of the sample. In summary, we believe that ultrasound-assisted still has great potential in improving the recoverable strain of NiTi alloy in the AM process. Achieving fully equiaxed grains through optimising process parameters contributes to the comprehensive enhancement of recoverable strain in both the BD and TD directions.
5. Conclusions
In this work, ultrasound-assisted field was introduced in the NiTi alloy wire-arc DED process. The effect of ultrasonic power variation on the microstructure and mechanical properties of NiTi alloy was investigated. The evolution of microstructure and superelasticity of NiTi alloy under ultrasound-assisted was elucidated. The main conclusions of this work are as follows:
The introduction of ultrasound-assisted field can significantly promote the production of equiaxed grains. With the increase of ultrasonic power, the content of equiaxed grains increased from 28.9% to 87.4%. The average grain size decreased from 147.3 to 72.2 μm. The generation of equiaxed grains is mainly attributed to the nucleation sites produced by ultrasound and the enhancement of constitutional supercooling.
The dislocations generated during plastic deformation of B2 austenite and stress-induced martensitic transformation are the main causes for the decrease in recoverable strain during cyclic loading. Furthermore, these phenomena are typically more prone to occur in columnar grain regions.
The results of cyclic loading tests at room temperature indicate that there is no significant difference in recoverable strain along the BD direction among different samples. This is mainly due to the presence of a certain amount of columnar grain regions in the samples. However, along the TD direction, the recoverable strain of the samples gradually increases with the increase in ultrasonic power. This is mainly attributed to the inhibitory effect of grain refinement on dislocation generation and slip.
Acknowledgements
Special thanks to Yunnan Chen of Xi’an Jiaotong University Instrumental Analysis Center for help with EBSD experiments.
Disclosure statement
No potential conflict of interest was reported by the author(s).
Data availability statement
The data that support the findings of this study are available from the corresponding author, [Ke], upon reasonable request.
Additional information
Funding
References
- Sames WJ, List FA, Pannala S, et al. The metallurgy and processing science of metal additive manufacturing. Int Mater Rev. 2016;61(5):315–360. doi:10.1080/09506608.2015.1116649
- Debroy T, Mukherjee T, Wei HL, et al. Metallurgy, mechanistic models and machine learning in metal printing. Nat Rev Mater. 2021;6(1):48–68. doi:10.1038/s41578-020-00236-1
- Svetlizky D, Das M, Zheng B, et al. Directed energy deposition (DED) additive manufacturing: physical characteristics, defects, challenges and applications. Mater Today. 2021;49:271–295. doi:10.1016/j.mattod.2021.03.020
- Li Z, Sui S, Ma X, et al. High deposition rate powder- and wire-based laser directed energy deposition of metallic materials: a review. Int J Machine Tools Manuf. 2022;181:103942. doi:10.1016/j.ijmachtools.2022.103942
- Sampaio RFV, Pragana JPM, Bragança IMF, et al. Modelling of wire-arc additive manufacturing – a review. Adv Industrial Manuf Eng. 2023;6:100121. doi:10.1016/j.aime.2023.100121
- Bermingham MJ, Stjohn DH, Krynen J, et al. Promoting the columnar to equiaxed transition and grain refinement of titanium alloys during additive manufacturing. Acta Mater. 2019;168:261–274. doi:10.1016/j.actamat.2019.02.020
- Luo M, Li R, Zheng D, et al. Formation mechanism of inherent spatial heterogeneity of microstructure and mechanical properties of NiTi SMA prepared by laser directed energy deposition. Int J Extreme Manuf. 2023;5(3):035005. doi:10.1088/2631-7990/acd96f
- Elahinia M, Shayesteh Moghaddam N, Taheri Andani M, et al. Fabrication of NiTi through additive manufacturing: a review. Prog Mater Sci. 2016;83:630–663. doi:10.1016/j.pmatsci.2016.08.001
- Otsuka K, Ren X. Physical metallurgy of Ti–Ni-based shape memory alloys. Prog Mater Sci. 2005;50(5):511–678. doi:10.1016/j.pmatsci.2004.10.001
- Cao Y, Zhou X, Cong D, et al. Large tunable elastocaloric effect in additively manufactured Ni–Ti shape memory alloys. Acta Mater. 2020;194:178–189. doi:10.1016/j.actamat.2020.04.007
- Elahinia MH, Hashemi M, Tabesh M, et al. Manufacturing and processing of NiTi implants: a review. Prog Mater Sci. 2012;57(5):911–946. doi:10.1016/j.pmatsci.2011.11.001
- Weinert K, Petzoldt V. Machining of NiTi based shape memory alloys. Mater Sci Eng A. 2004;378(1–2):180–184. doi:10.1016/j.msea.2003.10.344
- Liu G, Zhou S, Lin P, et al. Analysis of microstructure, mechanical properties, and wear performance of NiTi alloy fabricated by cold metal transfer based wire arc additive manufacturing. J Mater Res Technol. 2022;20:246–259. doi:10.1016/j.jmrt.2022.07.068
- Yu L, Chen K, Zhang Y, et al. Microstructures and mechanical properties of NiTi shape memory alloys fabricated by wire arc additive manufacturing. J Alloys Compd. 2022;892:16219. doi:10.1016/j.jallcom.2021.162193
- Zeng Z, Cong BQ, Oliveira JP, et al. Wire and arc additive manufacturing of a Ni-rich NiTi shape memory alloy: microstructure and mechanical properties. Addit Manuf. 2020;32:101051. doi:10.1016/j.addma.2020.101051
- Feng Y, Liu B, Wan X, et al. Influence of processing parameter on phase transformation and superelastic recovery strain of laser solid forming NiTi alloy. J Alloys Compd. 2022;908:164568. doi:10.1016/j.jallcom.2022.164568
- Wang J, Lin X, Li J, et al. A study on obtaining equiaxed prior-β grains of wire and arc additive manufactured Ti–6Al–4 V. Mater Sci Eng A. 2020;772:138703. doi:10.1016/j.msea.2019.138703
- Wang J, Lin X, Wang J, et al. Grain morphology evolution and texture characterization of wire and arc additive manufactured Ti-6Al-4V. J Alloys Compd. 2018;768:97–113. doi:10.1016/j.jallcom.2018.07.235
- Lu B, Cui X, Ma W, et al. Promoting the heterogeneous nucleation and the functional properties of directed energy deposited NiTi alloy by addition of La2O3. Addit Manuf. 2020;33:101150. doi:10.1016/j.addma.2020.101150
- Lu B, Cui X, Jin G, et al. Effect of La2O3 addition on mechanical properties and wear behaviour of NiTi alloy fabricated by direct metal deposition. Optics Laser Technol. 2020;129:106290. doi:10.1016/j.optlastec.2020.106290
- Todaro CJ, Easton MA, Qiu D, et al. Grain structure control during metal 3D printing by high-intensity ultrasound. Nat Commun. 2020;11(1). doi:10.1038/s41467-019-13874-z
- Du D, Haley JC, Dong A, et al. Influence of static magnetic field on microstructure and mechanical behavior of selective laser melted AlSi10Mg alloy. Mater Des. 2019;181:107923. doi:10.1016/j.matdes.2019.107923
- Wang J, Pan Z, Carpenter K, et al. Comparative study on crystallographic orientation, precipitation, phase transformation and mechanical response of Ni-rich NiTi alloy fabricated by WAAM at elevated substrate heating temperatures. Mater Sci Eng A. 2021;800:140307. doi:10.1016/j.msea.2020.140307
- Li X, Fang X, Zhang M, et al. Gradient microstructure and prominent performance of wire-arc directed energy deposited magnesium alloy via laser shock peening. Int J Mach Tools Manuf. 2023;188:104029. doi:10.1016/j.ijmachtools.2023.104029
- Vorontsov A, Astafurov S, Melnikov E, et al. The microstructure, phase composition and tensile properties of austenitic stainless steel in a wire-feed electron beam melting combined with ultrasonic vibration. Mater Sci Eng A. 2021;820:141519. doi:10.1016/j.msea.2021.141519
- Yi H, Wang Q, Zhang W, et al. Wire-arc directed energy deposited Mg-Al alloy assisted by ultrasonic vibration: improving properties via controlling grain structures. J Mater Process Technol. 2023;321:118134. doi:10.1016/j.jmatprotec.2023.118134
- Yuan D, Shao S, Guo C, et al. Grain refining of Ti-6Al-4V alloy fabricated by laser and wire additive manufacturing assisted with ultrasonic vibration. Ultrason Sonochem. 2021;73:105472. doi:10.1016/j.ultsonch.2021.105472
- Zhang M, Duan Y, Fang X, et al. Tailoring the superelasticity of NiTi alloy fabricated by directed energy deposition through the variation of residual stress. Mater Des. 2022;224:111311. doi:10.1016/j.matdes.2022.111311
- Zhang M, Fang X, Wang Y, et al. High superelasticity NiTi fabricated by cold metal transfer based wire arc additive manufacturing. Mater Sci Eng A. 2022;840:143001. doi:10.1016/j.msea.2022.143001
- Zhan X, Wang Q, Wang L, et al. Regionalization of microstructure and mechanical properties of Ti6Al4 V transition area fabricated by WAAM-LMD hybrid additive manufacturing. J Alloys Cmpds. 2022;929:167345. doi:10.1016/j.jallcom.2022.167345
- Xi N, Tang K, Fang X, et al. Enhanced comprehensive properties of directed energy deposited Inconel 718 by a novel integrated deposition strategy. J Mater Sci Technol. 2023;141:42–55. doi:10.1016/j.jmst.2022.09.026
- Li X, Zhang M, Fang X, et al. Improved strength-ductility synergy of directed energy deposited AZ31 magnesium alloy with cryogenic cooling mode. Virtual Phys Prototyp. 2023;18(1). doi:10.1080/17452759.2023.2170252
- Biscuola VB, Martorano MA. Mechanical blocking mechanism for the columnar to equiaxed transition. Metall Mater Trans A. 2008;39:2885–2895. doi:10.1007/s11661-008-9643-x
- Khoo Z, Liu Y, An J, et al. A review of selective laser melted NiTi shape memory alloy. Materials (Basel). 2018;11(4):519. doi:10.3390/ma11040519
- Gao S, Weng F, Bodunde OP, et al. Spatial characteristics of nickel-titanium shape memory alloy fabricated by continuous directed energy deposition. J Manuf Process. 2021;71:417–428. doi:10.1016/j.jmapro.2021.09.039
- Lu B, Cui X, Liu E, et al. Influence of microstructure on phase transformation behavior and mechanical properties of plasma arc deposited shape memory alloy. Mater Sci Eng A. 2018;736:130–136. doi:10.1016/j.msea.2018.08.098
- Li B, Wang B, Wang L, et al. Effect of post-heat treatments on the microstructure, martensitic transformation and functional performance of EBF3-fabricated NiTi shape memory alloy. Mater Sci Eng A. 2023;871:144897. doi:10.1016/j.msea.2023.144897
- Lu HZ, Chen T, Liu LH, et al. Constructing function domains in NiTi shape memory alloys by additive manufacturing. Virtual Phys Prototyp. 2022;17(3):563–581. doi:10.1080/17452759.2022.2053821
- Sutou Y, Omori T, Yamauchi K, et al. Effect of grain size and texture on pseudoelasticity in Cu–Al–Mn-based shape memory wire. Acta Mater. 2005;53(15):4121–4133. doi:10.1016/j.actamat.2005.05.013
- Li B, Wang L, Wang B, et al. Solidification characterization and its correlation with the mechanical properties and functional response of NiTi shape memory alloy manufactured by electron beam freeform fabrication. Addit Manuf. 2021;48:102468. doi:10.1016/j.addma.2021.102468
- Resnina N, Palani IA, Belyaev S, et al. Structure, martensitic transformations and mechanical behaviour of NiTi shape memory alloy produced by wire arc additive manufacturing. J Alloys Compd. 2021;851:156851. doi:10.1016/j.jallcom.2020.156851
- Xue L, Atli KC, Picak S, et al. Controlling martensitic transformation characteristics in defect-free NiTi shape memory alloys fabricated using laser powder bed fusion and a process optimization framework. Acta Mater. 2021;215:117017. doi:10.1016/j.actamat.2021.117017
- Zuo X, Zhang W, Chen Y, et al. Wire-based directed energy deposition of NiTiTa shape memory alloys: microstructure, phase transformation, electrochemistry, X-ray visibility and mechanical properties. Addit Manuf. 2022;59:103115. doi:10.1016/j.addma.2022.103115
- Hamilton RF, Bimber BA, Palmer TA. Correlating microstructure and superelasticity of directed energy deposition additive manufactured Ni-rich NiTi alloys. J Alloys Compd. 2018;739:712–722. doi:10.1016/j.jallcom.2017.12.270
- Li B, Wang L, Wang B, et al. Tuning the microstructure, martensitic transformation and superelastic properties of EBF3-fabricated NiTi shape memory alloy using interlayer remelting. Mater Des. 2022;220:110886. doi:10.1016/j.matdes.2022.110886
- Pu Z, Du D, Wang K, et al. Evolution of transformation behavior and tensile functional properties with process parameters for electron beam wire-feed additive manufactured NiTi shape memory alloys. Mater Sci Eng A. 2022;840:142977. doi:10.1016/j.msea.2022.142977
- Pu Z, Du D, Wang K, et al. Microstructure, phase transformation behavior and tensile superelasticity of NiTi shape memory alloys fabricated by the wire-based vacuum additive manufacturing. Mater Sci Eng A. 2021;812:141077. doi:10.1016/j.msea.2021.141077
- Pu Z, Du D, Zhang D, et al. Improvement of tensile superelasticity by aging treatment of NiTi shape memory alloys fabricated by electron beam wire-feed additive manufacturing. J Mater Sci Technol. 2023;145:185–196. doi:10.1016/j.jmst.2022.10.050
- Xue L, Atli KC, Zhang C, et al. Laser powder bed fusion of defect-free NiTi shape memory alloy parts with superior tensile superelasticity. Acta Mater. 2022;229:117781. doi:10.1016/j.actamat.2022.117781
- Wang X, He X, Wang T, et al. The influence of the microtexture and orientation of columnar grains on the fatigue crack growth of directed energy deposited Ti-6.5Al-2Zr-Mo-V alloys. Addit Manuf. 2020;35:101174. doi:10.1016/j.addma.2020.101174
- Chen Y, Xu M, Zhang T, et al. Grain refinement and mechanical properties improvement of Inconel 625 alloy fabricated by ultrasonic-assisted wire and arc additive manufacturing. J Alloys Compd. 2022;910:164957. doi:10.1016/j.jallcom.2022.164957
- Kang J, Zhang X, Wang S, et al. The comparison of ultrasonic effects in different metal melts. Ultrasonics. 2015;57:11–17. doi:10.1016/j.ultras.2014.10.004
- Lu L, Jiang H, Bian Q, et al. Integrated modelling and simulation of NiTi alloy by powder bed fusion: single track study. Mater Des. 2023;227:111755. doi:10.1016/j.matdes.2023.111755
- Fan Q, Chen C, Fan C, et al. Ultrasonic induces grain refinement in gas tungsten arc cladding AlCoCrFeNi high-entropy alloy coatings. Mater Sci Eng A. 2021;821:141607. doi:10.1016/j.msea.2021.141607
- Jiao Z, Li Z, Wu F, et al. Phase transition, twinning, and spall damage of NiTi shape memory alloys under shock loading. Mater Sci Eng A. 2023;869:144775. doi:10.1016/j.msea.2023.144775
- Zhang X, Kang J, Wang S, et al. The effect of ultrasonic processing on solidification microstructure and heat transfer in stainless steel melt. Ultrason Sonochem. 2015;27:307–315. doi:10.1016/j.ultsonch.2015.05.041
- Qian M, Cao P, Easton MA, et al. An analytical model for constitutional supercooling-driven grain formation and grain size prediction. Acta Mater. 2010;58(9):3262–3270. doi:10.1016/j.actamat.2010.01.052
- Yuan D, Sun X, Sun L, et al. Improvement of the grain structure and mechanical properties of austenitic stainless steel fabricated by laser and wire additive manufacturing assisted with ultrasonic vibration. Mater Sci Eng A. 2021;813:141177. doi:10.1016/j.msea.2021.141177
- Wang F, Eskin D, Mi J, et al. A synchrotron X-radiography study of the fragmentation and refinement of primary intermetallic particles in an Al-35 Cu alloy induced by ultrasonic melt processing. Acta Mater. 2017;141:142–153. doi:10.1016/j.actamat.2017.09.010
- Wang S, Kang J, Guo Z, et al. In situ high speed imaging study and modelling of the fatigue fragmentation of dendritic structures in ultrasonic fields. Acta Mater. 2019;165:388–397. doi:10.1016/j.actamat.2018.11.053
- Polatidis E, Amíd M, Kuběna I, et al. Deformation mechanisms in a superelastic NiTi alloy: An in-situ high resolution digital image correlation study. Mater Des. 2020;191:108622. doi:10.1016/j.matdes.2020.108622
- Chowdhury P, Sehitoglu H. A revisit to atomistic rationale for slip in shape memory alloys. Prog Mater Sci. 2017;85:1–42. doi:10.1016/j.pmatsci.2016.10.002
- Zhu J, Liu K, Riemslag T, et al. Achieving superelasticity in additively manufactured Ni-lean NiTi by crystallographic design. Mater Des. 2023;230:111949. doi:10.1016/j.matdes.2023.111949
- Kang LM, Cai YJ, Luo XC, et al. Bimorphic microstructure in Ti-6Al-4V alloy manipulated by spark plasma sintering and in-situ press forging. Scr Mater. 2021;193:43–48. doi:10.1016/j.scriptamat.2020.10.035
- Luo X, Liu LH, Yang C, et al. Overcoming the strength–ductility trade-off by tailoring grain-boundary metastable Si-containing phase in β-type titanium alloy. J Mater Sci Technol. 2021;68:112–123. doi:10.1016/j.jmst.2020.06.053
- Stebner AP, Paranjape HM, Clausen B, et al. In situ neutron diffraction studies of large monotonic deformations of superelastic nitinol. Shape Memory Superelasticity. 2015;1(2):252–267. doi:10.1007/s40830-015-0015-2