
 ?Mathematical formulae have been encoded as MathML and are displayed in this HTML version using MathJax in order to improve their display. Uncheck the box to turn MathJax off. This feature requires Javascript. Click on a formula to zoom.
ABSTRACT
In present paper, a universal method for multi-objective parameter optimisation of additive manufacturing processes was proposed and successfully applied to laser-based directed energy deposition (DED) experiments with mixtures of H13 and M2 steel powders that were deposited on 4Cr5Mo2SiV1 hot work die steel. The DED experiments were designed and completed based on the response surface method with 13 groups of laser parameters. The microstructure of the deposited alloy steel was observed and its mechanical properties were tested. The deposited steel alloy achieved an ultimate tensile strength (UTS) of 1821 ± 30 MPa with a reasonable elongation of approximately 4.5%, and the bond strength specimens achieved a bond toughness of ∼10.66% with a moderate UTS (1329 ± 28 MPa). A multi-objective optimisation method was proposed based on response surfaces which were established according to microstructural characteristics and mechanical properties data. It provided a basis for achieving high strength or high toughness DED-fabricated steel alloys.
1. Introduction
With the development of integrated die casting technology, castings and die casting molds tend to be larger than in the past. Under the action of alternating heat and force, die casting molds are prone to develop fatigue cracks on the surface where stresses concentrate, leading to mold failure [Citation1]. The failure of large and expensive die casting molds due to localised fatigue cracks has caused tremendous costs. Therefore, strengthening or repairing mold surfaces for the purpose of improving mold life has attracted the attention of many researchers [Citation2–7]. Traditional mold repair and strengthening methods mainly include welding methods and spraying methods [Citation8–10]. In recent years, the development of laser DED technology has led to its use to strengthen and repair molds [Citation2,Citation7,Citation11–16] due to the advantages of small heat-affected zones and low residual stresses, high bond strength, and good adaptability to complex mold surfaces.
DED technology has the advantage of flexible process control based on point-by-point, row-by-row, and layer-by-layer processes, which makes it easy to build heterogeneously structured materials by varying the powder composition and process parameters. DED technology also shows great potential for improving the mechanical properties (e.g. strength or ductility) of metallic materials [Citation17]. DED techniques can be classified as homogeneous material deposition and heterogeneous material deposition, depending on the type of deposited powder and substrate [Citation2,Citation13,Citation16,Citation18]. For example, the microstructure and properties of homogeneous material deposition components [Citation2], i.e. H13 powders deposited on H13 steel substrates, were investigated. heterogeneous material deposition [Citation18] with DED techniques to obtain 304 stainless steel/IN738LC Ni-based superalloy bimetallic structures was completed. They performed a multi-scale investigation of the chemical inhomogeneity, grain structure, and crystal defects at the 304SS/IN738LC bimetallic interface and discussed the effect of interfacial architecture on mechanical properties. Furthermore, studies [Citation7,Citation19] demonstrated that the use of mixed powders provided great flexibility in the design of deposited alloy composition, which omitted the process of preparing pre-alloyed powders and effectively reduced the cost of DED. However, excessive differences in the thermal expansion coefficients and mechanical properties between the substrate and reinforced layers during deposition of heterogeneous materials can lead to high levels of residual stress and deformation at the bonding interface [Citation20] that reduce the bond strength and resistance to fatigue cracking. Therefore, more attention should be given to interfacial structure and bond strength during heterogeneous deposition.
4Cr5Mo2SiV1 steel, a modified H13 hot work tool steel with more Mo and less Si and V than H13 steel, is widely used for high-quality die casting molds because its better high-temperature toughness, plasticity, and thermal fatigue resistance are better than those of H13 [Citation1,Citation21]. Since there are no commercially available 4Cr5Mo2SiV1 steel powders, the use of mixed powders for deposition on 4Cr5Mo2SiV1 substrates is a good option according to previous studies [Citation7,Citation19]. M2 high-speed steel (HSS) has an excellent combination of hardness, wear and corrosion resistance properties. The higher Mo content and lower Si content in M2 HSS equalised the compositional differences between H13 steel powder and 4Cr5Mo2SiV1 substrate. So, it appears that the combination of H13 and M2 can be used in DED repair experiments on 4Cr5Mo2SiV1 substrates.
The microstructure and mechanical properties of laser-based DED-reinforced or repaired 4Cr5Mo2SiV1 steel molds are affected by laser processing parameters such as laser power and scanning speed. Density and porosity fraction maps of the H13 deposition layers processed by the laser-based powder bed fusion (PBF-LB) technique under various laser powers and scanning speeds were constructed [Citation22]. The effect of the microstructure of PBF-LB H13 on tensile strength and fracture resistance at different scanning speeds was investigated [Citation23]. However, fewer studies have considered the effects of process parameters on the mechanical properties of strengthened or repaired 4Cr5Mo2SiV1 steels fabricated by laser DED with mixed powders. Furthermore, in most of the published investigations, either individual parameter was varied or trends of the effects of the parameters on mechanical properties were evaluated [Citation22–24]. Therefore, there is an urgent need for a quantitative study that considers the effects of the interactions of parameters on the mechanical properties of 4Cr5Mo2SiV1 steels made by laser DED.
Response surface method (RSM) is an approach for the design of scientific experiments to establish mathematical correlations between multiple input factors and multiple outputs (responses) with a minimum number of experiments. It can be used to identify important interactions that may be missed in experiments where only a single factor changed [Citation25–27]. Therefore, RSM perfectly fits the needs of process parameter optimisation for laser-based DED repair of 4Cr5Mo2SiV1 steel. Different from multi-objective parameter optimisation methods such as neural networks, which require a large amount of experimental data to construct the correlation between parameters and responses, RSM requires fewer experiments, which is obviously more appropriate for the needs in the field of additive manufacturing. RSM has been successfully applied to geometry path optimisation for additive manufacturing [Citation28], print quality control for Aerosol jet printing [Citation29], and optimisation of porosity of additively manufactured aluminum porous materials [Citation30].
In this study, reinforced 4Cr5Mo2SiV1 steels were prepared by laser DED with a mixture of H13 and M2 powders for 13 groups of laser powers and scanning speeds. The objectives of the present study were 1) to evaluate the 4Cr5Mo2SiV1 substrate/deposited steel alloy interfacial structure and bond strength, 2) to establish quantitative correlations among process parameters, microstructure and mechanical properties and to obtain a process window for multi-objective optimisation. For this purpose, quantitative statistics of microstructural characteristics and mechanical property tests were obtained. In addition to the microstructure and properties of the deposited layers, the interfacial structure and bond strengths of the steel alloys deposited on 4Cr5Mo2SiV1 substrates were described specifically. The response surfaces of microstructural characteristics and mechanical properties were constructed based on these test data. Multi-objective parameter optimisation was achieved with process windows obtained through response surfaces. Finally, the contributions of several strengthening mechanisms to the yield strength of the DED steel alloy in the deposited layers were calculated and discussed to better characterise the strengthening effect.
2. Experiment
2.1. Materials
The substrate used in this study was quenched and tempered 4Cr5Mo2SiV1 steel, and the deposited material was a mixture of air atomised powders consisting of 70 wt.% H13 and 30 wt.% M2. The chemical compositions of the substrate and powders are listed in and Table S1. More information about the materials and purpose of selecting H13 and M2 powders for mixing can be found in the supplementary material.
Table 1. Chemical compositions of substrate and powders (wt.%).
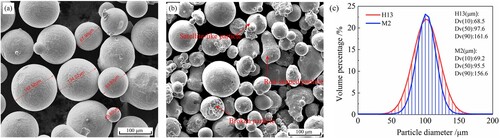
As shown in , the morphology of the H13 powders were nearly spherical, while the M2 powders were satellite- and rod-shaped. The distribution of the powder particle size is measured by laser diffraction. The distribution of H13 powders ranged from 50 to 150 μm, with D10, D50, and D90 values of 68.5, 97.6, and 161.6 μm, respectively. M2 powders had a particle size distribution of 50–150 μm, with D10, D50, and D90 values of 69.2, 95.5, and 156.6 μm, respectively. The substrate was ground and cleaned in anhydrous ethanol before deposition. The two kinds of powders were mixed in a cylinder mixer at a rate of 60 rpm for 4 h. Then, the mixed powder was dried at 80 °C for 8 h before being used for deposition.
Figure 1. Morphology of (a) H13 and (b) M2 powders and (c) particle size distribution of H13 and M2.
2.2. Design of DED parameters
When the powder composition was determined, the microstructure and properties of the deposited specimen were mainly determined by the thermal history of the DED process. The equations for the cooling rate and laser energy density during deposition were proposed as follows [Citation31,Citation32]:
(1)
(1)
(2)
(2) where
is the cooling rate;
is the thermal conductivity;
and
are the peak surface temperature and initial temperature, respectively;
is the surface absorption rate;
is the laser energy density;
is the scanning speed;
is the laser power; and
is the laser spot radius. According to equations (1) and (2), the energy input and cooling rate can be manipulated by controlling the laser power and scanning speed, and thus, the microstructure and properties of the deposited specimen can be regulated.
In this study, to obtain the response surfaces of microstructural characteristics and mechanical properties, the central composite design (CCD)-type RSM was used in Design-Expert software to prepare a combination plan with 2 factors, 3 levels and a total of 13 test points. Thus, the experimental design is shown in . The ranges of 2600–3000 W and 400–600 mm/min used for optimisation were derived from pre-exploratory experiments.
Table 2. DED experimental design.
2.3. DED experiment
shows a photograph of the equipment and schematic diagrams of the DED experiment. The DED system consisted of robotic manipulator (KUKA KR30HA), disc-type laser (Trumpf 6006), and three coaxial powder feeders (GTV PF2/2). Argon and helium were used for powder feeding and protective media, and the gas flow rates were 6 and 10 slpm, respectively. The powder feeding flow rate was 13.3 g/min, and the scanning hatch was 2 mm. The powder mixture was deposited on the 4Cr5Mo2SiV1 steel substrate with a snake-shaped scanning strategy and the 13 combinations of parameters of different laser powers and scanning speeds shown in until the deposited height reached 16 mm.
Figure 2. Photograph and schematic diagrams of the DED experiment and specimen processing.
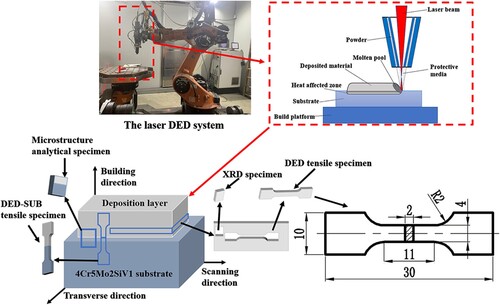
Since this study was oriented to the application of mold repair, subsequent heat treatment operations were not considered in order to ensure the shape and dimensional accuracy, surface roughness, etc. of the molds. The microstructure and property of as-built specimens are considered. The electric discharge machining was used to process specimens. For microstructural analysis, specimens with dimensions of 10 mm*10 mm*15 mm were cut from the deposited steel alloy, as shown in . At least three microstructural analysis specimens were cut for each process parameter. To evaluate the strength of the deposited steel alloy and the bond strength between it and the substrate, DED tensile specimens and DED-SUB specimens were machined according to the structure and dimensions shown in . The DED specimens for tensile testing were prepared entirely from the deposition layers. Half of each DED-SUB tensile specimen consisted of the deposited layers, and the other half was the substrate along the tensile direction. These two types of tensile specimens had the same dimensions.
2.4. Microstructural analysis
The composition of the deposited layers was analyzed by Zetium X-ray fluorescence spectrometer (XRF) after the DED experiments. The specimens for microstructural observations were ground, mechanically polished and etched with 4 vol% nitric alcohol solution. The microstructure was observed with optical microscopy (OM, Leica DM3000M) and scanning electron microscopy (SEM, ZEISS Sigma 500). The observation plane was the cross section where the building direction and transverse direction were located. The porosity fraction (%), pore count density (mm−2) of the DED steel alloy were estimated by processing OM images with a field of view of 2.4*1.9 mm in ImageJ software, while the carbide content (%) was obtained from SEM images with a field of view of 4.2*2.9 um. The accuracies of these data were improved by measuring the pores and carbide of at least 10 images (acquired from different random locations in the deposition layers) and then calculating the average. X-ray diffraction (XRD) spectroscopy patterns were recorded by a Panalytical X-Pert-Pro X-ray polycrystalline diffractometer with Cu radiation (Kα1 = 1.5406 Å) operating at 40 kV. The martensite content (wt%) was determined by XRD patterns with Rietveld method, and the accuracy was improved by averaging the martensite content of three specimen. Specimens for the electron backscatter diffraction (EBSD) investigation were polished by an electrolytic polishing machine. The EBSD data were collected by an Oxford EBSD C-nano detector. The area of the EBSD maps is 576 um × 432 um, and the step size is 1 um. Transmission electron microscopy (TEM) specimens were prepared by a Helios G4 CX focused ion beam (FIB) device. A specimen with a thickness of 1.5∼2.0 μm was cut out from the selected area using the FIB, and then the specimen was fixed onto a molybdenum wire mesh. Finally, a TEM specimen with a thickness of 30∼50 nm was obtained by thinning using the FIB. Bright field-TEM (BF-TEM) observations and selected area electron diffraction (SAED) analysis were performed with a Talos F200x G2 TEM. The compositional analysis was performed using a configured SDD super-X energy spectrum analyzer (EDS).
2.5. Mechanical property tests
The microhardness distribution across the deposition interface of each specimen was measured by a digital Vickers hardness tester (DHV-1000Z, Shanghai Shangcai Testing Machine Co., Ltd., Shanghai, China) with a 300 g load and held for 15 s. Figure S1 in the supplementary material shows a schematic of the microhardness measurements across the deposited layers. The macroscopic hardness of the deposited layers was additionally measured using a Rockwell Hardness Tester (KH3200A, Kingindent Test Instrument Ltd., Beijing, China) for better uniformity. Each specimen was tested ten times, and the results were averaged. Uniaxial tensile tests were performed by using a universal testing machine (SHIMADZ AG-X 100 kN) with a strain rate of 1 × 10⁻³ s−1. For the DED and DED-SUB tensile specimens, the tensile tests were repeated at least three times for each parameter condition.
3. Results
3.1. Chemical composition
and Table S1 lists the calculated and the measured (by XRF) chemical composition of the deposited layers. The theoretically calculated composition of the 70 wt.% H13 and 30 wt.% M2 powder mixtures show little difference from the composition of the 4Cr5Mo2SiV1 substrate in except the Si, V and W element. The XRF measurement results revealed that the C element was unincluded due to the limitations of the XRF measurement technique. The small difference between the measured content of other elements (Si, Mn, Cr, Mo, V, W) and the calculated composition indicated that the mixture of 70 wt.% H13 and 30 wt.% M2 powders matched the composition design expectations.
Table 3. Calculated and measured chemical compositions of deposited layers (wt.%).
3.2. Microstructure
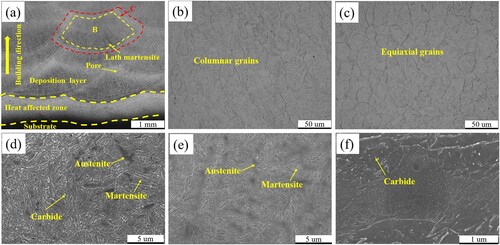
(a) shows the OM morphology of the cross section of the specimen that was deposited under 3000 W and 500 mm/min. It can be divided into three zones: substrate (SUB), heat affected zone (HAZ), and deposited layers (DL). The typical fish-scale-like structure of the DL formed by the melt pool was observed. The interior region B of the fish-scale-like structure in (b) was a martensitic structure with columnar crystals, and the exterior region C in (c) was an equiaxed crystal structure. The formation of columnar and equiaxed crystals was determined by the temperature gradient G and solidification rate R during the DED process, and the principles of their formation have been discussed in many studies of additive manufacturing [Citation33,Citation34]. The tempered 4Cr5Mo2SiV1 substrate contained tempered martensite, residual austenite and carbides ((d)). The SEM micromorphology of DL in (e) and (f) showed the presence of finer martensite, austenite and carbide, which was caused by the rapid nonequilibrium solidification during DED. In addition, pore defects were present in the DL. Pore defects were mainly formed by external gases entrapped in the liquid metal of the melt pool, gases generated by the reaction of some elements in the powder at high temperatures [Citation35], and incomplete fusion caused by insufficient energy input. In (a), the pores were mainly located at the bottom of the melt pool in region C.
Figure 3. Microstructure morphology of cross section prepared under 3000 W and 500 mm/min. OM morphology of (a) the cross section of the specimen, (b) interior region B and (c) exterior region C in (a). SEM morphology of (c) SUB and (e), (f) DL.
These microstructural characteristics, which have an impact on mechanical properties, were variable under different laser processing parameters. The microstructural characteristics data of DL for 13 groups of parameters are listed in . The data were used to perform response surface analysis in section 3.6.
Table 4. Microstructure content of DL for 13 groups of RSM parameters.
3.3. Phase analysis
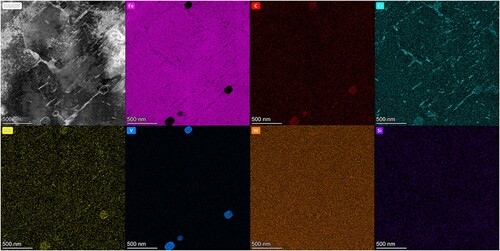
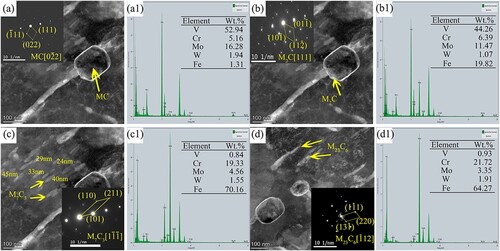
The TEM-EDS elemental distribution analysis of the DL at 3000 W and 500 mm/min in shows that the carbides were morphologically divided into block-like V-rich and Mo-rich carbides (size approximately 80–160 nm) and rod-like Cr-rich carbides (size approximately 30–50 nm). C, Cr and Mo were soluble solids in martensite and austenite in addition to being enriched in carbides. C formed a limited solid solution in martensite and austenite and more enriched in carbides, and V was almost completely enriched in the block carbide due to its strong carbide formation ability. Elements W and Si were uniformly distributed.
Figure 4. TEM-EDS maps of the DL under 3000 W and 500 mm/min.
shows the SAED and the corresponding EDS analysis of the four carbides present in the deposited layers at 3000 W and 500 mm/min. Based on the SAED and EDS results in (a), it was determined that the block-like carbides were MC-type carbides with the face-centered cubic (FCC) structure. Two sets of diffraction spots were present in the SAED data of the edge of the bulk carbide in (b). One set was an M2C-type carbide ((b)) with hexagonal closed-packed (HCP) structure, and the other set was an MC-type carbide (same as (a)). Studies [Citation36,Citation37] have shown that M2C-type carbides decompose and transform into MC-type and M6C-type carbides when heated to 900∼1150 °C. Therefore, it was presumed that the transformation of M2C-type carbides to MC-type carbides also occurred during the deposition process in this study. The rod-like carbides were identified as M7C3-type with HCP structure [Citation38] and M23C6-type carbides with FCC structure based on the SAED results in (c) and 5(d).
Figure 5. TEM images and SAED results for (a) MC, (b) M2C (c) M7C3, and (d) M23C6 and EDS data corresponding to (a1) MC, (b1) M2C (c1) M7C3, and (d1) M23C6 present in the DL.
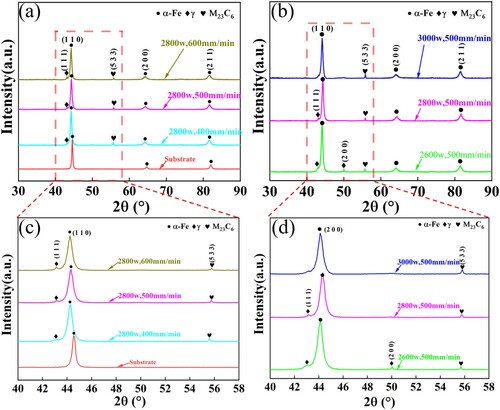
shows the XRD patterns of the DL at different scanning speeds and laser powers. Compared to the substrate, the diffraction peaks at all parameters of the DL were broadened, while the intensity of the martensite diffraction peak increased and the peak position shifted to the left. This indicated that the rapid solidification of the DED deposits promoted grain refinement and martensite formation, while the increased lattice spacing was inferred from the left shift of the peak position according to the Bragg diffraction law, which represented the distortion of the lattice due to the solid solution of more elements such as C, Cr, and Mo in the martensite of the DL as a result of rapid solidification. shows that as the scanning speed increases and the laser power decreases, i.e. the laser energy density decreases, there is no significant change in the martensite diffraction peaks, while the intensity of the austenite diffraction peaks increases and the diffraction peaks of the M23C6 carbides decrease in intensity. It indicates that as the cooling rate increases, the austenite increases, and the diffusion ability of the M23C6 carbide-forming elements decreases, resulting in a decrease in the content of the M23C6 carbide.
Figure 6. XRD patterns of the substrate and DLs at different (a) scanning speeds and (b) laser powers, (c) magnification of the dashed box in (a), (c) magnification of the dashed box in (b).
3.4. EBSD analysis
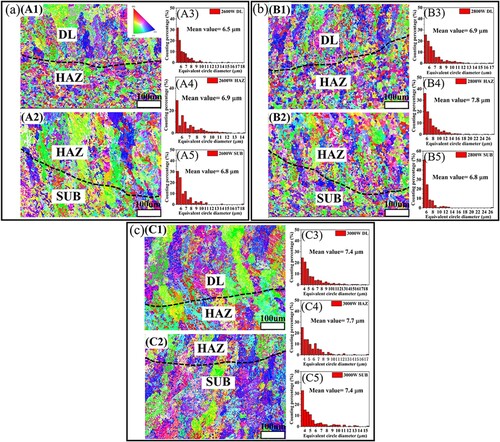
shows the inverse pole figure (IPF, constructed based on martensitic and austenitic phases) and grain distribution of the DL, HAZ and SUB at 500 mm/min with different laser powers: (a) 2600 W, (b) 2800 W, and (c) 3000 W. The black dashed lines were used to delineate the DL-HAZ and HAZ-SUB interfaces. The IPF revealed that the grains of the DL, HAZ and SUB at different powers had no significant selective orientation. The grain distribution map showed that the average grain sizes of SUB, HAZ and DL along the construction direction exhibited a tendency of first increasing and then decreasing at different laser powers, but the differences were not significant. As previously discussed, the small grain size of the DL was attributed to rapid solidification during the DED process, while the large grain size of the HAZ was caused by the grain growth of the SUB grains near the melt pool under the influence of the heat of the melt pool. In addition, with increasing laser power, the energy input increased and the cooling rate decreased, and the average grain size of grains increased in both the DL and HAZ. The analysis of the distribution of the corresponding geometrically necessary dislocations (GNDs) and Schmid factor was shown in the Supplementary Material.
Figure 7. IPF and grain distribution maps of the DL, HAZ and SUB at 500 min/min with (a) 2600 W, (b) 2800 W and (c) 3000 W. IPF of the DL/HAZ interface at (A1) 2600 W, (B1) 2800 W and (C1) 3000 W; IPF results for the HAZ/SUB interface at (A2) 2600 W, (B2) 2800 W and (C2) 3000 W. (A3), (B3) and (C3) are grain distribution maps of the DL; (A4), (B4) and (C4) are grain distribution maps of the HAZ; and (A5), (B5) and (C5) are grain distribution maps of the SUB.
3.5. Mechanical properties
The microstructural differences between the DL, HAZ and SUB of the deposited specimens were reflected in the variation in the cross-sectional hardness values. The Vickers hardness curves for different scanning speeds and laser powers, as functions of the distance from the SUB to the DL, are shown in . The microstructure of the DL had a large amount of lath martensite and a fine grain size, which resulted in a hardness of 610 HV-720 HV that was significantly larger than the substrate hardness of approximately 425 HV. Based on the temperature distribution patterns and different enrichment levels of solid solution elements, the hardness gradually decreased from the DL to the SUB [Citation2]. shows that as the scanning speed increased and the laser power decreased, the energy input decreased, the cooling rate increased and the hardness increased. The greatest DL hardness of approximately 720 HV was achieved at 2800 W and 600 mm/min.
Figure 8. Hardness distributions of deposited specimen cross sections at (a) different scanning speeds with 2800 W and (b) different laser powers with 500 mm/min.
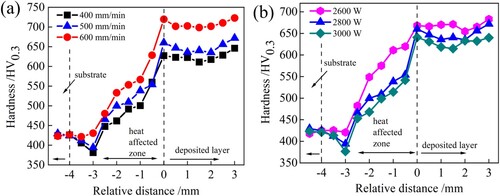
The width of the HAZ differed for different parameters. For example, in (b), the hardness of the HAZ at 2600 W decayed and stabilised to the substrate hardness within a relative distance of −3 mm, while at 2800 and 3000 W, it took a relative position of −4 mm before it decayed and stabilised to the substrate hardness. This implied that the width of the HAZ first increased with increasing energy input and then remained constant over a range of energy inputs.
lists the tensile properties of the DED-SUB specimens (DED-SUB YS, DED-SUB UTS and DED-SUB elongation), the tensile properties of the DED specimens (DED YS, DED UTS and DED elongation) and the hardness of the DED steel alloy at the DL (DED hardness) for 13 groups of RSM parameters. These mechanical property data were used to construct the regression equations and the corresponding response surfaces.
Table 5. Mechanical properties of deposited specimens for 13 groups of RSM parameters.
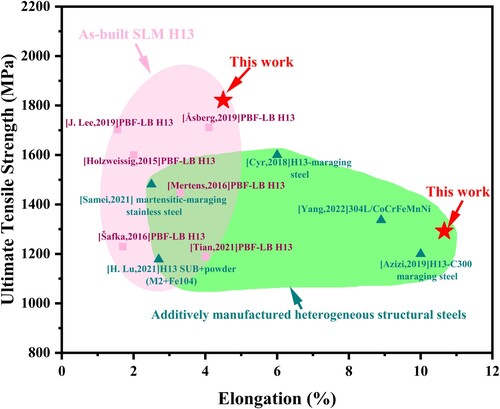
compares the mechanical properties of the DED steel alloy in this study to prior research [Citation7,Citation13,Citation23,Citation39–46]. In the present study, the highest UTS (1821 ± 30 MPa) for the DED specimen in the as-built state exceeded that of other hot work tool steels prepared by additive manufacturing (mainly PBF-LB H13 steel). It also maintained a reasonable elongation of approximately 4.5%. In addition, the DED-SUB specimen had excellent elongation (∼10.66%) and moderate bond strength (1329 ± 28 MPa) compared to other additively manufactured heterogeneous structural steels.
Figure 9. Comparison of the mechanical properties of the DED steel alloy in the current study with those of other work.
3.6. Response surface analysis
The quantitative functional relationships (3)-(13) were obtained with RSM based on the regression analysis of the microstructural characteristics in and the mechanical properties in . shows the ANOVA, F test, and P test values for the regression models (3)-(11). df is the degree of freedom of the model. The F value is the significance testing index, and the P value is the probability value that the model is not tenable [Citation47]. Generally, models that have an F value greater than unity are statistically significant. The models are significant if the P value is less than 0.05 with 95% confidence [Citation26]. If the F value is larger or the P value is smaller, the significance of the model is stronger. For example, the F value and P value for the porosity fraction model were 25.9 and 0.0001, respectively, which meant that there was only a 0.01% chance that the F value reached 25.9 due to noise. Therefore, the effect of the error on the porosity fraction model was small, and the model was significant. All of the regression models had strong significance as judged by the F and P values in .
(3)
(3)
(4)
(4)
(5)
(5)
(6)
(6)
(7)
(7)
(8)
(8)
(9)
(9)
(10)
(10)
(11)
(11)
(12)
(12)
(13)
(13)
Table 6. ANOVA, F test, and P test results for the microstructural characteristics and mechanical properties model.
The response surfaces and their contour graphs in and were constructed based on regression equations (3)–(11). (a) illustrates the laser energy density distribution established according to equation (2). Combined with (a)-(c), the results showed that as the energy density increased, it caused a decrease in the cooling rate, which weakened the transformation kinetics of martensite and caused the martensite content to decrease. The high energy input facilitated elemental diffusion, which enabled the carbide to precipitate more sufficiently during nonequilibrium solidification. Thus, the carbide content increased with increasing energy density. The response surfaces of the porosity fraction in (d) and pore count density in (e) had a similar tendency of first decreasing and then increasing with increasing energy density. Low energy density causes defects of lack of fusion; the melt pool entraps the gas produced by local evaporation of the melt or the protective gas and forms round pore defects at high energy density [Citation22,Citation35,Citation48], both of which increase the porosity fraction and pore count density. Therefore, the porosity fraction and pore count density were smaller in the laser energy density range of 80–105 J/mm2.
Figure 10. Response surfaces of (a) laser energy density, (b) martensite content, (c) carbide content, (d) porosity fraction, and (e) pore count density based on scanning speed and laser power.
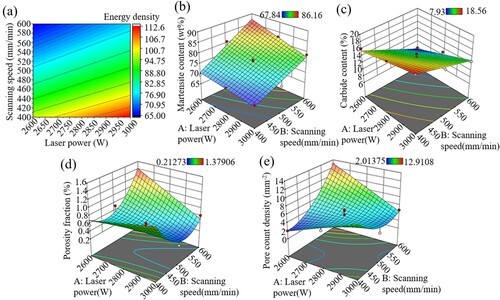
Figure 11. Response surfaces of the (a) DED-SUB YS, (b) DED-SUB UTS, (c) DED-SUB elongation, (d) DED YS, (e) DED UTS, (f) DED elongation and (g) DED hardness based on scanning speed and laser power.
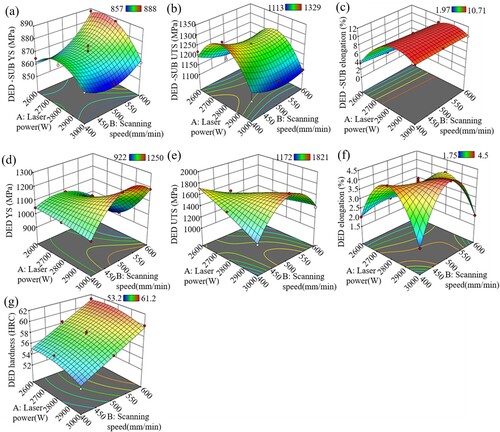
The response surfaces of the DED-SUB YS and DED-SUB UTS in (a) and (b) were shaped like saddle surfaces, while the response surface of the DED-SUB elongation in (c) was a parabolic surface. DED-SUB UTS and DED-SUB elongation did not vary significantly with scanning speed and had large values in the laser power range of 2700–2900 W. In (d)-(f), the DED YS, DED UTS and DED elongation of the DED steel alloy had larger values in the parameter ranges of 450–500 mm/min and 2700–2900 W, which corresponded to an energy density range of approximately 80–105 J/mm2. This parameter range was consistent with that of the low porosity fraction and low pore count density in (d) and (e). It indicated that the dominant microstructural characteristic affecting the tensile properties of DED steel alloy were pore defects. Optimal DED steel alloy tensile properties were obtained with a low porosity fraction value. (g) revealed that the DED hardness gradually decreased as the energy density increased, and the DED hardness showed a parabolic relationship with laser power and a linear positive correlation with scanning speed.
4. Discussion
4.1. Multi-objective parameter optimisation
Parameter optimisation for individual mechanical properties can be accomplished by a response surface. However, in a majority of cases, it is necessary to simultaneously optimise multi-objective mechanical properties. In this study, multiple sets of functional relationships between laser power and scanning speed were obtained by replacing multiple sets of mechanical performance target values in the corresponding regression equations. These multiple sets of function curves were plotted in a single graph, and the enclosed area became the process window for multi-objective parameters optimisation. The mechanical properties with an approximately 70% optimisation rate of DED-SUB UTS ≥ 1250 MPa, DED-SUB elongation ≥ 9.5%, DED UTS ≥ 1550 MPa, DED elongation ≥ 3.6%, and hardness ≥ 57.5 HRC were obtained when the laser parameters were in the pink region of (a). The 70% optimisation rate meant that the values of 1250 MPa, 9.5%, 1550 MPa, 3.6% and 57.5 HRC were better than approximately 70% of the current corresponding experimental values. (b)-(d) show representative tensile curves for the parameter locations in (a).
Figure 12. Process window for multi-objective parameters optimisation and representative engineering stress–strain curves: (a) process window; (b) engineering stress–strain curves for the DED and DED-SUB specimens at laser power of 2800 W and scanning speed of 500 mm/min; corresponding fracture morphology (B1) and (B2) in (b); (c) engineering stress–strain curve and (C1), (C2) corresponding fracture morphology for the DED specimen at low and high energy density; (d) engineering stress–strain curve and (D1),(D2) corresponding fracture morphology for the DED-SUB specimen at low and high laser power. (Colours version online)
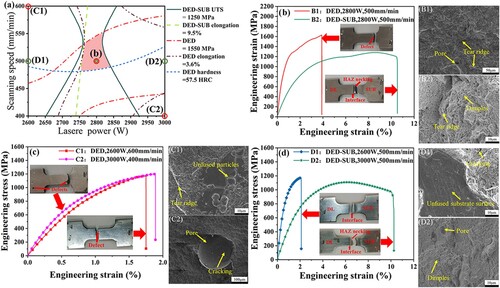
(c) present the DED tensile curves for the lowest and highest energy density specimens, both of which fractured at the defects, corresponding to the unfused defect in (C1) and the round pore defect in (C2), respectively, which caused stress concentration and poor strength and plasticity. In contrast, the DED steel alloy tensile curves of the moderate energy density specimens in (b) had increased strength and plasticity due to the smaller porosity fraction of the specimens, which corresponded to the quasi-dissociative fracture form of the fracture in (B1). The fracture morphology reconfirmed the conclusion reached in Section 3.6 that the performance of DED specimens is mainly affected by pore defects.
The tensile specimens of the DED-SUB at low laser power in (d) fractured at the bond interface, and the corresponding fracture morphology in (D1) showed unfused substrate surfaces with poor metallurgical bonding, which resulted in poor strength and plasticity. In contrast, the DED-SUB tensile specimen in (d) at high laser power fractured at the HAZ, where significant necking occurred, and the corresponding fracture in (D2) contained many fine dimples and exhibited good plasticity but lower strength. The DED-SUB tensile specimen in (b) with moderate laser power exhibited similar elongation and higher strength as at high laser power, and the corresponding fracture in (B2) also contained many fine dimples, but it had more step surfaces in the form of tearing ridges, which lengthened the fracture path and increased the energy required for fracture, and thus the strength increased.
Laser power had a greater impact on melt pool depth than scanning speed, while laser scan speed affected the width of the melt pool more [Citation49]. Obviously, the melt pool depth had a greater influence on the DED-SUB tensile properties. Poor strength at low laser power was due to poor metallurgical bonding. The deep melt pool at high laser power formed a larger and softer HAZ (as evidenced by the course HAZ grains at high laser power in and the hardness distribution in (b)), which shifted the fracture from the bond interface to the HAZ and resulted in good plasticity and poor strength. The moderate laser power had good metallurgical bond and HAZ properties, which ultimately resulted in superior strength and elongation of the DED-SUB specimens.
The desirability function is given below [Citation26]:
(14)
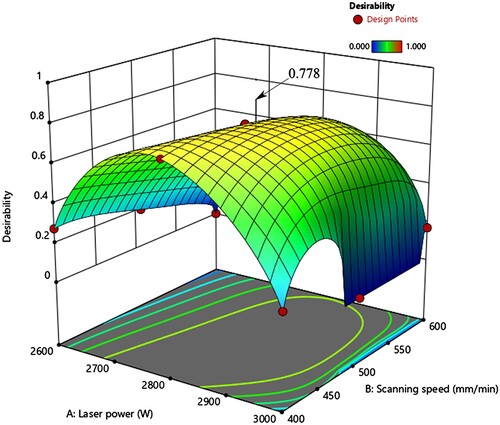
(14) where dj is the desirability, and D is the composite desirability and varies from 0 to 1. shows the response surface of the composite desirability. In the case of laser power of 2841 W and scanning speed of 484 mm/min, DED-SUB UTS = 1252 MPa, DED-SUB elongation = 11.1%, DED UTS = 1665 MPa, DED elongation = 4.1%, and DED hardness = 57.5 HRC could be simultaneously obtained with a composite desirability value of 0.778.
Figure 13. The response surface of the composite desirability.
4.2. Strengthening mechanism analysis
In the laser DED process, the strengthening mechanism of the DED steel alloy included grain-refinement strengthening, solid solution strengthening, dislocation strengthening and precipitation strengthening because of the rapid solidification of grains, solid solution of alloy elements in martensite and residual austenite, thermal deformation and precipitation of carbides. The corresponding strengthening mechanisms in the DED steel alloy at different laser powers are discussed as follows.
The contribution of grain-refinement strengthening to the DED YS was estimated by the Hall–Petch equation:
(15)
(15) where
is the Hall–Petch constant (
= 572 MPa μm1/2 [Citation50]), and
is the average grain size, which was 6.5 µm ((A3)), 6.9 µm ((B3)), and 7.4 µm ((C3)).
The contribution of solid solution strengthening to the DED YS depends on the mass fraction of solid solution alloying elements and is calculated by the empirical formula [Citation51]:
(16)
(16) The equilibrium concentration of the interstitial carbon content (0.02 wt% [Citation52]) was used for the calculation without considering the supersaturation of the nonequilibrium solidification of element C. The mass percentages of alloying elements (Mn, Si, V, Mo, Cr) used for the calculations were adopted from the XRF measurements in . In addition, the solid solution strengthening contribution of the W element was calculated with the method described by Li [Citation53].
The contribution from dislocation to the DED YS was calculated by a variant of the Taylor equation:
(17)
(17) where M is the Taylor factor, taken as 3 [Citation54], α is a material constant, taken as 0.33 [Citation54], G is the shear modulus, taken as 80 GPa [Citation54], b is the Burgers vector, taken as 0.25 nm [Citation54], and ρ is the dislocation density (the average GND density value of DL in Figure S2 was used here).
The contribution of carbide precipitation to the DED YS was calculated by the Orowan bypass mechanism [Citation51]:
(18)
(18) where
is the volume fraction of carbides, and
is the average size of carbides. The carbides in the DL were considered to be uniformly distributed, and the area fraction in was used to replace
. It can be estimated from Equation (18) that the more and finer the precipitated carbides are, the greater their contribution to the strength. The average sizes of carbides in the TEM results were 41 nm, 38 nm and 33 nm at laser powers of 2600 W, 2800 and 3000 W, respectively (Figure S3 of the supplementary material).
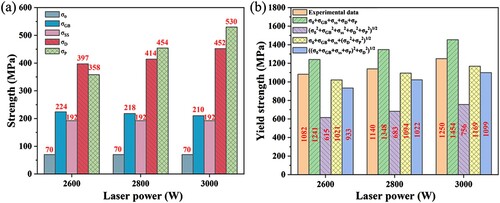
The results of the calculations of the contributions of the four strengthening mechanisms to the DED YS are shown in (a). The lattice friction stress = 70 MPa [Citation50] for iron is also included. The dominant strengthening mechanisms were dislocation strengthening and precipitation strengthening, and their strengthening effects were enhanced with increasing laser power. Various summation laws are described in the literatures [Citation50,Citation51,Citation54] for integrating the four strengthening mechanisms. The four summation laws were used in (b) to calculate the DED YS and compare them with the experimental values. The summation method
had the best match to the experimental DED YS for different laser powers with errors of 5.64%, 4.04%, and 6.48%.
Figure 14. (a) Contributions of different mechanisms to the DED YS and (b) the DED YS calculated with different summation laws under different laser power.
5. Conclusions
In this study, a multi-objective optimisation method based on response surfaces of microstructure characteristics and mechanical properties was presented and successfully applied to laser DED experiments where mixtures of H13 and M2 powders were deposited on 4Cr5Mo2SiV1 hot work die steel. The major conclusions were as follows:
The microstructure of the DED steel alloy contained martensite, residual austenite, carbides (block-like MC, M2C, rod-like M7C3, and M23C6) and pores. As the laser energy density increased, the martensite content decreased, the carbide content increased, and the porosity fraction first increased and then decreased. There were lower porosity fractions in the energy density range of 80–105 J/mm2. the average grain sizes of SUB, HAZ and DL along the construction direction exhibited a tendency of first increasing and then decreasing at different laser powers and the average grain sizes of SUB, HAZ and DL increased with increasing laser power.
The tensile properties of the DED specimens were primarily affected by the porosity fraction, with low values improving the tensile properties. The bond strength of the DED-SUB specimens was mainly affected by the laser power. The bond strength first increased and then decreased with increasing laser power because unfused defects appeared at the bond interface at low laser power. A larger and softer HAZ was produced at high laser power, which shifted the fracture from the bond interface to the HAZ and reduced the bond strength. The DED specimen had the highest UTS of 1821 ± 30 MPa while maintaining a reasonable elongation of approximately 4.5%. The DED-SUB specimen had excellent elongation (∼10.66%) and moderate bond strength (1329 ± 28 MPa).
A multi-objective optimisation of the process parameter window and a composite desirability response surface were established based on the mechanical properties under different parameters. For a laser power of 2841 W and scanning speed of 484 mm/min, DED-SUB UTS = 1252 MPa, DED-SUB elongation = 11.1%, DED UTS = 1665 MPa, DED elongation = 4.1%, and DED hardness = 57.5 HRC could be simultaneously obtained with a composite desirability value of 0.778.
Dislocation strengthening and precipitation strengthening were dominant strengthening mechanisms in the DED steel alloy, and their strengthening effects increased with increasing laser power. The summation law
for calculating DED YS at the three laser power levels was in good agreement with the experimental values with errors of 5.64%, 4.04%, and 6.48%.
Supplemental Material
Download MS Word (6 MB)Disclosure statement
The authors declare that they have no known competing financial interests or personal relationships that could have appeared to influence the work reported in this paper.
Data availability statement
The data that support the findings of this study are available from the corresponding author upon reasonable request.
Additional information
Funding
References
- Markežič R, Naglič I, Mole N, et al. Experimental and numerical analysis of failures on a die insert for high pressure die casting. Eng Fail Anal. 2019;95(January):171–180. doi:10.1016/j.engfailanal.2018.09.010
- Braga V, Siqueira RHM, Atilio I, et al. Microstructural and mechanical aspects of laser metal deposited H13 powder for die repair. Mater Today Commun. 2021;29(December):102945. doi:10.1016/j.mtcomm.2021.102945
- Lee JC, Kang HJ, Chu WS, et al. Repair of damaged mold surface by cold-spray method. CIRP Ann. 2007;56(1):577–580. doi:10.1016/j.cirp.2007.05.138
- Lu C-W, Wang H-S, Chen H-G, et al. Effects of heat treatment and Nd: YAG laser repair welding parameters on the microstructure and properties of a Cu–Ni–Si–Cr mold alloy. Mater Sci Eng A. 2021a;799(January):140342. doi:10.1016/j.msea.2020.140342
- Cong D, Zhou H, Ren Z, et al. The thermal fatigue resistance of H13 steel repaired by a biomimetic laser remelting process. Mater Des. 2014;55(March):597–604. doi:10.1016/j.matdes.2013.09.076
- Chen H, Lu Y, Sun Y, et al. Coarse TiC particles reinforced H13 steel matrix composites produced by laser cladding. Surf Coat Technol. 2020;395(August):125867. doi:10.1016/j.surfcoat.2020.125867
- Lu H, Cai J, Luo K, et al. Thermal fatigue life and improvement mechanism of Fe-based coatings on H13 extrusion die by laser additive remanufacturing. Surf Coat Technol. 2021b;408(February):126808. doi:10.1016/j.surfcoat.2020.126808
- Jhavar S, Paul CP, Jain NK. Causes of failure and repairing options for dies and molds: a review. Eng Fail Anal. 2013;34(December):519–535. doi:10.1016/j.engfailanal.2013.09.006
- Preciado WT, Niño Bohorquez CE. Repair welding of polymer injection molds manufactured in AISI P20 and VP50IM steels. J Mater Process Technol. 2006;179(1–3):244–250. doi:10.1016/j.jmatprotec.2006.03.101
- Wu H, Liu S, Xie X, et al. A framework for a knowledge based cold spray repairing system. J Intell Manuf. 2022;33(6):1639–1647. doi:10.1007/s10845-021-01770-7
- Rabiey M, Schiesser P, Maerchy P. Direct metal deposition (DMD) for tooling repair of DIN 1.2343 steel. Procedia CIRP. 2020;95:23–28. doi:10.1016/j.procir.2020.01.151
- Zhan X, Lin X, Gao Z, et al. Modeling and simulation of the columnar-to-equiaxed transition during laser melting deposition of invar alloy. J Alloys Compd. 2018;755(July):123–134. doi:10.1016/j.jallcom.2018.04.313
- Samei J, Asgari H, Pelligra C, et al. A hybrid additively manufactured martensitic-maraging stainless steel with superior strength and corrosion resistance for plastic injection molding dies. Addit Manuf. 2021;45(September):102068. doi:10.1016/j.addma.2021.102068
- Franz M, Bliedtner J, Haupt C. Laser metal deposition welding in the field of tool and mould making. Procedia Eng. 2014;69:237–240. doi:10.1016/j.proeng.2014.02.227
- Shah M, Patel DR, Pande S. Additive manufacturing integrated casting- A review. Mater Today Proc. 2022;62:7199–7203. doi:10.1016/j.matpr.2022.03.413
- Zhang X, Sun C, Pan T, et al. Additive manufacturing of copper – H13 tool steel Bi-metallic structures via Ni-based multi-interlayer. Addit Manuf. 2020;36(December):101474. doi:10.1016/j.addma.2020.101474.
- Kim RE, Kim ES, Karthik GM, et al. Heterostructured alloys with enhanced strength-ductility synergy through laser-cladding. Scr Mater. 2022;215(July):114732. doi:10.1016/j.scriptamat.2022.114732
- Dang X, Li Y, Chen K, et al. Insight into the interfacial architecture of a hybrid additively- manufactured stainless steel/Ni-based superalloy bimetal. Mater Des. 2022;216(April):110595. doi:10.1016/j.matdes.2022.110595
- Chen M, Van Petegem S, Zou Z, et al. Microstructural engineering of a dual-phase Ti-Al-V-Fe alloy via in situ alloying during laser powder bed fusion. Addit Manuf. 2022;59(November):103173. doi:10.1016/j.addma.2022.103173
- Fathi P, Rafieazad M, Mohseni-Sohi E, et al. Corrosion performance of additively manufactured bimetallic aluminum alloys. Electrochim Acta. 2021;389(September):138689. doi:10.1016/j.electacta.2021.138689
- Yuan M, Karamchedu S, Fan Y, et al. Study of defects in directed energy deposited vanadis 4 extra tool steel. J Manuf Process. 2022;76(April):419–427. doi:10.1016/j.jmapro.2022.02.014
- Fonseca EB, Gabriel AHG, Araújo LC, et al. Assessment of laser power and scan speed influence on microstructural features and consolidation of AISI H13 tool steel processed by additive manufacturing. Addit Manuf. 2020;34(August):101250. doi:10.1016/j.addma.2020.101250
- Lee J, Choe J, Park J, et al. Microstructural effects on the tensile and fracture behavior of selective laser melted H13 tool steel under varying conditions. Mater Charact. 2019;155(September):109817. doi:10.1016/j.matchar.2019.109817
- Zhang J, Yu M, Li Z, et al. The effect of laser energy density on the microstructure, residual stress and phase composition of H13 steel treated by laser surface melting. J Alloys Compd. 2021;856(March):158168. doi:10.1016/j.jallcom.2020.158168
- Fatemi SA, Zamani Ashany J, Jalali Aghchai A, et al. Experimental investigation of process parameters on layer thickness and density in direct metal laser sintering: a response surface methodology approach. Virtual Phys Prototyp. 2017;12(2):133–140. doi:10.1080/17452759.2017.1293274
- Basavarajappa M, Bhatta D. Heat and mass transfer of a molten polymer conveying nanoparticles in a wire coating process with temperature-dependent fluid properties: optimization using response surface method. Int Commun Heat Mass Transfer. 2022;133(April):105941. doi:10.1016/j.icheatmasstransfer.2022.105941
- Gurrala PK, Regalla SP. Multi-Objective optimisation of strength and volumetric shrinkage of FDM parts. Virtual Phys Prototyp. 2014;9(2):127–138. doi:10.1080/17452759.2014.898851
- Li R, Wang G, Ding Y, et al. Optimization of the geometry for the end lateral extension path strategy to fabricate intersections using laser and cold metal transfer hybrid additive manufacturing. Addit Manuf. 2020;36(December):101546. doi:10.1016/j.addma.2020.101546
- Zhang H, Choi JP, Moon SK, et al. A hybrid multi-objective optimization of aerosol jet printing process via response surface methodology. Addit Manuf. 2020;33(May):101096. doi:10.1016/j.addma.2020.101096
- Shim D-s. Effects of process parameters on additive manufacturing of aluminum porous materials and their optimization using response surface method. J Mater Res Technol. 2021;15(November):119–134. doi:10.1016/j.jmrt.2021.08.010
- Goodarzi DM, Pekkarinen J, Salminen A. Analysis of laser cladding process parameter influence on the clad bead geometry. Weld World. 2017;61(5):883–891. doi:10.1007/s40194-017-0495-0
- Ashby MF, Easterling KE. The transformation hardening of steel surfaces by laser beams—I. hypo-eutectoid steels. Acta Metall. 1984;32(11):1935–1948. doi:10.1016/0001-6160(84)90175-5
- Ma G, Liu X, Song C, et al. Ticp reinforced Ti6Al4V of follow-up synchronous electromagnetic induction-laser hybrid directed energy deposition: microstructure evolution and mechanical properties. Addit Manuf. 2022;59(November):103087. doi:10.1016/j.addma.2022.103087
- Hao J, Hu F, Le X, et al. Microstructure and high-temperature wear behaviour of inconel 625 multi-layer cladding prepared on H13 mould steel by a hybrid additive manufacturing method. J Mater Process Technol. 2021;291(May):117036. doi:10.1016/j.jmatprotec.2020.117036
- Wolff SJ, Lin S, Faierson EJ, et al. A framework to link localized cooling and properties of directed energy deposition (DED)-processed Ti-6Al-4 V. Acta Mater. 2017;132(June):106–117. doi:10.1016/j.actamat.2017.04.027
- Boccalini M, Goldenstein H. Solidification of high speed steels. Int Mater Rev. 2001;46(2):92–115. doi:10.1179/095066001101528411
- Chaus AS, Bračík M, Sahul M, et al. Microstructure and properties of M2 high-speed steel cast by the gravity and vacuum investment casting. Vacuum. 2019;162(April):183–198. doi:10.1016/j.vacuum.2019.01.041
- Xie J-y, Chen N-x, Shen J, et al. Atomistic study on the structure and thermodynamic properties of Cr7C3, Mn7C3, Fe7C3. Acta Mater. 2005;53(9):2727–2732. doi:10.1016/j.actamat.2005.02.039
- Holzweissig MJ, Taube A, Brenne F, et al. Microstructural characterization and mechanical performance of hot work tool steel processed by selective laser melting. Metall Mater Trans B. 2015;46(2):545–549. doi:10.1007/s11663-014-0267-9
- Šafka J, Ackermann M, Voleský L. Structural properties of H13 tool steel parts produced with use of selective laser melting technology. J Phys Conf Ser. 2016;709(April):012004. doi:10.1088/1742-6596/709/1/012004
- Tian Y, Chadha K, Kim SH, et al. Strengthening mechanisms in a heatvar hot work tool steel fabricated by laser powder bed fusion. Mater Sci Eng A. 2021;805(February):140801. doi:10.1016/j.msea.2021.140801
- Åsberg M, Fredriksson G, Hatami S, et al. Influence of post treatment on microstructure, porosity and mechanical properties of additive manufactured H13 tool steel. Mater Sci Eng A. 2019;742(January):584–589. doi:10.1016/j.msea.2018.08.046
- Mertens R, Vrancken B, Holmstock N, et al. Influence of powder bed preheating on microstructure and mechanical properties of H13 tool steel SLM parts. Phys Procedia. 2016;83:882–890. doi:10.1016/j.phpro.2016.08.092
- Azizi H, Ghiaasiaan R, Prager R, et al. Metallurgical and mechanical assessment of hybrid additively-manufactured maraging tool steels via selective laser melting. Addit Manuf. 2019;27(May):389–397. doi:10.1016/j.addma.2019.03.025
- Cyr E, Asgari H, Shamsdini S, et al. Fracture behaviour of additively manufactured MS1-H13 hybrid hard steels. Mater Lett. 2018;212(February):174–177. doi:10.1016/j.matlet.2017.10.097
- Yang Y, Hu J, Liu XY, et al. Post treatment of an additively manufactured composite consisting of 304L stainless steel and CoCrFeMnNi high-entropy alloy. Mater Sci Eng A. 2022;831(January):142104. doi:10.1016/j.msea.2021.142104
- He H, Cheng S, Chen Y, et al. Compression performance analysis of multi-scale modified concrete based on response surface method. Case Stud Constr Mater. 2022;17(December):e01312. doi:10.1016/j.cscm.2022.e01312
- Sanaei N, Fatemi A. Defects in additive manufactured metals and their effect on fatigue performance: a state-of-the-art review. Prog Mater Sci. 2021;117(April):100724. doi:10.1016/j.pmatsci.2020.100724
- Guo Q, Zhao C, Qu M, et al. In-Situ characterization and quantification of melt pool variation under constant input energy density in laser powder bed fusion additive manufacturing process. Addit Manuf. 2019;28(August):600–609. doi:10.1016/j.addma.2019.04.021
- Mao W-w, Ning A-g, Guo H-j. Nanoscale precipitates and comprehensive strengthening mechanism in AISI H13 steel. Int J Miner Metall Mater. 2016;23(9):1056–1064. doi:10.1007/s12613-016-1323-z
- Yan J, Song H, Dong Y, et al. High strength (∼2000MPa) or highly ductile (∼11%) additively manufactured H13 by tempering at different conditions. Mater Sci Eng A. 2020;773(January):138845. doi:10.1016/j.msea.2019.138845
- Hutchinson B, Hagström J, Karlsson O, et al. Microstructures and hardness of as-quenched martensites (0.1–0.5%C). Acta Mater. 2011;59(14):5845–5858. doi:10.1016/j.actamat.2011.05.061
- LI Q. Modeling the microstructure–mechanical property relationship for a 12Cr–2W–V–Mo–Ni power plant steel. Mater Sci Eng A. 2003;361(1–2):385–391. doi:10.1016/S0921-5093(03)00565-3
- Mazaheri Y, Kermanpur A, Najafizadeh A. Strengthening mechanisms of ultrafine grained dual phase steels developed by new thermomechanical processing. ISIJ Int. 2015;55(1):218–226. doi:10.2355/isijinternational.55.218