
 ?Mathematical formulae have been encoded as MathML and are displayed in this HTML version using MathJax in order to improve their display. Uncheck the box to turn MathJax off. This feature requires Javascript. Click on a formula to zoom.
ABSTRACT
A three-dimensional thermofluidic coupling transport model is proposed to investigate the influences of different spatial laser intensity profiles (SLIPs), including circular super-Gaussian profile (C-SGP), transverse elliptical Gaussian profile (TE-GP) and longitudinal elliptical Gaussian profile (LE-GP), on the thermofluidic transport characteristics within the melt pool. The results demonstrate that the SLIPs dramatically influence the melt pool geometries, temperature gradient (both in magnitude and direction) at the solidification interface, and fluid flow dynamics. Under the TE-GP strategy, the highest average temperature gradients are observed at the solidification interface. The LE-GP strategy yields the smallest magnitudes and narrowest variation range of the temperature gradient direction angles. The heat transport of the melt pool under the C-SGP and TE-GP strategies are jointly dominated by convective and conductive heat transfer, while those under the LE-GP strategy are dominated by convective heat transfer. Marangoni convection is strongest in the LE-GP strategy and weakest in the TE-GP strategy.
Introduction
Laser-based directed energy deposition (L-DED) belongs to a laser-based additive manufacturing technique characterised by laser cladding and synchronous material feeding. Due to its exceptional advantages including high building rates, wide range of compatible materials, capability for large-scale part production, and high-efficient part repair [Citation1], L-DED has emerged as a highly promising advanced near-net forming technology that enjoys significant popularity in the aerospace, automotive, energy, and biomedical sectors [Citation2]. It is an interactive process that integrates the laser, materials, and environment as multiple process variables, accompanied by extraordinary thermophysical metallurgical phenomena (including ultrahigh thermal gradient and ultrafast cooling rate), various physical events, and multiphysics field coupling [Citation3, Citation4].
The melt pool created in the L-DED process represents the region where powder material is captured and thermophysical metallurgy is implemented. The thermofluidic transport events occurring within the melt pool significantly influence surface quality, metallurgical defects, and microstructures in the solidification region [Citation5]. Moreover, the melt pool facilitates laser energy transfer to the solid phase zone through conduction and convection modes. This induces thermal stress, deformation, and can lead to cracking under severe conditions. In summary, elucidating the thermofluidic coupling transport mechanism within the melt pool serves as a crucial foundation for discovering novel approaches to control microstructure and mechanical performance of metal parts fabricated using L-DED.
Spatial laser intensity profile (SLIP) refers to the distribution of laser beam intensity across its cross-section [Citation6]. It is a crucial processing parameter that significantly affects the printing properties of L-DED, including surface quality, solidification structure, and mechanical properties [Citation7]. Consequently, shaping the spatial distribution of laser intensity has emerged as a novel means for controlling the structure and performance in L-DED parts. Circular super-Gaussian profile (C-SGP) is a top-hat SLIP, and can be achieved by adjusting the defocus amount of the focused fiber laser beam [Citation8]. Compared to Gaussian profile, the C-SGP has uniform energy distribution within the laser spot, which can produce lower thermal gradient, more moderate melt flow, more homogeneous metallic bond, and higher density parts [Citation9, Citation10]. In addition, the C-SGP can promote the formation of uniformly distributed long columnar grains and strong fiber crystal texture [Citation11]. Due to these significant advantages, the C-SGP has gained widespread attention. Elliptical Gaussian profile is a type of SLIP with elliptical beam spot and Gaussian energy distribution. According to the relationship between the major axis of the ellipse beam spot and scanning direction, the elliptical Gaussian profile can be divided into transverse elliptical Gaussian profile (TE-GP) and longitudinal elliptical Gaussian profile (LE-GP). Here, the major axes of the LE-GP and TE-GP are respectively parallel and perpendicular to scanning direction. Compared with circular Gaussian profile, the elliptical Gaussian profile can control the ratio of equiaxed and columnar grains over a much larger parameter range [Citation12], which provides new grain control strategy for L-DED process. However, the high laser intensity used in laser-based powder bed fusion can induce the keyhole effect, resulting in complex solid/liquid interface morphology, and strong melt flow and convective heat transfer. Compared with the laser-based powder bed fusion, the lower laser intensity of L-DED leads to significantly different thermofluidic transport behaviours and solid/liquid interface morphology. More importantly, the influence of the elliptical Gaussian profile on the melt pool thermofluidic transport behaviours of the L-DED still requires systematic investigation. In summary, in order to guide the design or selection of SLIP, it is necessary to compare the effects of the C-SGP, LE-GP, and TE-GP on the melt pool thermofluidic transport of L-DED process.
In the L-DED process, the SLIP serves as the processing variable, while the heat and fluid transport characteristics act as state parameters, and the forming quality, solidification structure, and mechanical properties are considered as manufacturing characteristics of parts. The state parameters act as crucial links connecting processing variables with manufacturing characteristics [Citation13]. Therefore, establishing a quantitative relationship between the SLIPs and thermofluidic transport characteristics is essential for employing a laser intensity spatial shaping strategy to enhance the L-DED manufacturing attributes.
Experimental observations and physics-driven theoretical simulations are the primary methods employed to investigate the thermofluidic coupling transport process within the melt pool. However, due to the extreme conditions such as high temperatures, intense light irradiation, and wide temperature range in the L-DED process, long with technical limitations of observation instruments, experimental methods are generally characterised by high costs, low efficiency, long durations, complex measurement procedures, and limited measurement accuracy [Citation14, Citation15]. Additionally, observing thermofluidic transport behaviours inside the melt pool poses significant challenges for experimental methods. Unfortunately, although experimental observations can capture heat transfer and fluid flow phenomena while collecting data on them; they fail to elucidate the underlying physical mechanisms of thermofluidic coupling transport. On the other hand, theoretical simulations based on physical principles, mathematical models, and mechanical theories utilise commercial software or open-source programs to solve high-fidelity mathematical models. This approach enables easy acquisition of state parameters at any location and time under different processes, materials and environmental conditions, thereby revealing evolution laws and formation governing various physical events. Consequently, physics-driven theoretical simulation has emerged as an efficient and reliable method for studying thermofluidic coupling transport process within melt pools.
Numerous investigations have been conducted on simulating the thermofluidic coupling transport in L-DED. Based on the laws of conservation of mass, momentum and energy, Li et al. developed a three-dimensional transport model to forecast molten pool behaviour, heat transport, and melt flow during pulsed-wave L-DED [Citation16]. They employed a level set method to track the melt pool surface. Wu et al. proposed a comprehensive whole-phase heat transport model covering laser-powder interaction and melt pool thermofluidic transport processes for L-DED with multichannel coaxial powder feeding using an arbitrary Lagrangian–Eulerian framework with dynamic mesh representation of the melt pool surface [Citation14]. Notably, they introduced a laser-powder coupling submodel to provide more accurate boundary heat flux for the melt pool thermofluidic transport model. Bayat et al. fabricated a multiphysics numerical model of the L-DED process using volume-of-fluid method to determine the melt pool surface [Citation17]. Surprisingly, powder particle motion equations were added to uncover the effects of the powder particle velocities on thermofluidic dynamics conditions within the melt pool. However, accounting for the influence from the laser-powder interaction could improve the accuracy of their results.
Because of the intricate thermophysical nature of the L-DED process, which involves multiple physical events and multiphysics field interactions influenced by materials, processes, environment, and structures, it is extremely challenging to establish a mathematical model that accurately represents the actual processing conditions. In this context, several scholars have proposed valuable solutions. For example, Wu et al. proposed a beam characteristic parameter identification method based on experimental data to develop an accurate SLIP model, with the aim of enhancing the accuracy of their laser-powder coupling heat transfer model for filler powder laser welding [Citation8]. Brent et al., on the other hand, emphasised that in considering the solid/liquid interface as a mushy zone where both solid dendrites and liquid coexist [Citation18], they treated this zone as porous media using an enthalpy–porosity approach to model the thermofluidic transport process. The thermophysical properties of this mushy zone were described as a linear function of either liquid or solid fraction [Citation19]. Overall, these modelling strategies and models for thermofluidic coupling transport have provided a robust theoretical foundation for the present study.
This study aims to comparatively investigate the thermofluidic transport characteristics of L-DED under three different SLIPs, including C-SGP, TE-GP and LE-GP, which can provide a theoretical foundation for improving the manufacturing properties through laser intensity spatial shaping strategy. Firstly, a three-dimensional numerical model is built to investigate the thermofluidic coupling transport of the L-DED, utilising the commercial software COMSOL as the simulation platform. Subsequently, validation experiments are conducted to validate the predicated accuracy of the model. Finally, comprehensive simulations are performed to analyze and discuss the thermofluidic transport characteristics of the melt pools under three SLIPs.
Modelling of thermofluidic coupling transport
Basic assumptions
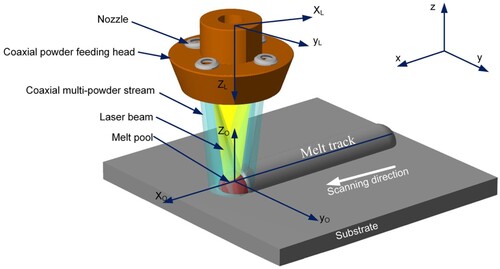
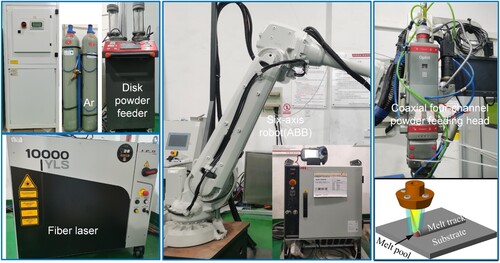
In the present study, the powder material is delivered to the pool in the L-DED process through a coaxial powder feeding head equipped with four identical nozzles and a carrier gas, as illustrated in . The four nozzles eject components of the powder stream, forming a coaxial multi-powder stream. The laser beam rapidly melts the local region of top layer of the substrate to create a melt pool during the L-DED process. Simultaneously, the coaxial multi-powder stream is delivered towards and into the melt pool. As the laser moves, solidification occurs rapidly at the solidification interface of the melt pool, resulting in a melt track formation. Due to strong coupling interactions among various factors including laser beam, powder stream, and substrate, numerous complex physical events (e.g. laser attenuation, powder heating, multiple heat transport patterns, and thermofluidic coupling transport) occur simultaneously during the L-DED process. These factors significant challenges for establishing an accurate thermofluidic coupling transport model with high fidelity while also potentially impacting solving efficiency and convergence of such model. Therefore, it becomes crucial to make certain assumptions.
For the L-DED process, the Reynolds number (Re) of the melt pool is significantly below the critical value of 5 × 10⁴, indicating that the flow pattern within the melt pool can be considered as laminar flow [Citation20]. The velocity of fluid flow typically ranges between 0.2 and 1.2 m/s [Citation21]. Furthermore, considering that the Mach number is considerably lower than the critical value of 0.3, so the melt pool fluid is assumed as an incompressible medium [Citation6].
The experiment employs a micron-scale stainless-steel powder with a Biot number (Bi) far below 0.1, implying that there is minimal temperature difference between its interior and exterior (< 5%) [Citation8]. Therefore, it is reasonable to assume instantaneous melting of the powder upon contacting with the melt pool.
The laser energy carried by powders accounts for approximately 5% of total laser energy [Citation22], thus negligible and disregarded.
Figure 1. Schematic of L-DED with multichannel coaxial powder feeding.
Governing equations
The melt flow behaviours are governed by the law of conservation of mass and momentum, which are expressed as [Citation23]:
(1)
(1)
(2)
(2) where
refers to the melt flow velocity vector,
is time,
stands for the dynamic viscosity,
indicates the melt density,
and
are separately transient temperature and liquidus temperature,
and
are the melt density corresponding to the liquidus temperature and static pressure, separately,
stands for the acceleration of gravity,
refers to the thermal expansion coefficient, and
represents the resistance of dendrites in the mushy zone to fluid, which can be expressed as [Citation24]:
(3)
(3)
(4)
(4) where
stands for the laser scanning speed,
is the dendrite morphology constant,
is the dendrite size with a value of approximately 100 μm, and
is a constant of 0.001 [Citation14].
is the volume fraction of the liquid phase. In order to mitigate potential computational nonconvergence resulting from abrupt solid/liquid phase transitions, a step function is adopted for smoothing
and is expressed as follows [Citation20]:
(5)
(5) where
,
represents the arithmetic mean of the solidus and liquidus temperatures and can be described by
,
denotes the solidus temperature,
stands for the difference between the solidus and liquidus temperatures, and is defined as
.
The heat transport behaviours are expressed by the energy balance equation [Citation17, Citation25]:
(6)
(6) in which
stands for the thermal conductivity and
is the enthalpy, including sensible enthalpy and latent enthalpy, which can be written as [Citation26]:
(7)
(7) where
represents the specific heat capacity and
represents the latent heat of fusion.
Laser beam
The spatial intensity profile of the fiber laser beam follows a super-Gaussian distribution and is described by [Citation27]:
(8)
(8)
(9)
(9) in which
is the laser power,
represents the Gamma function,
stands for the equivalent beam radius, and xL, yL and zL represent the coordinates in the laser coordinate system
, as depicted in .
is the super-Gaussian order. When
>1, the laser beam exhibits a C-SGP with a flat center region, as shown in (a); when
= 1, the laser beam assumes a circular Gaussian profile [Citation27].
indicates the focus radius;
and
are the defocusing amount and Rayleigh range, respectively.
Figure 2. C-SGP features: (a) spatial intensity profile for = 4.2, and (b) relationship between the super-Gaussian order
and defocusing amount
.
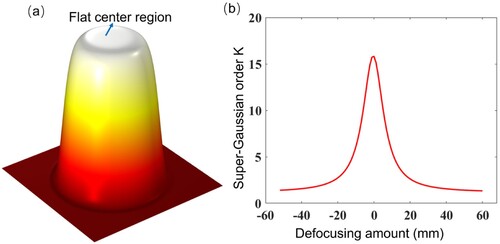
Based on the experimental intensity data from the laser beam cross-sections, a method for identifying beam characteristic parameters is adopted to establish the correlation between the super-Gaussian order and defocusing amount
[Citation8], as presented in (b). Under the actual processing conditions, the substrate top surface is positioned at a defocusing amount of 11 mm, where the SLIP becomes C-SGP;
and
are 1.2 mm and 4.2, respectively.
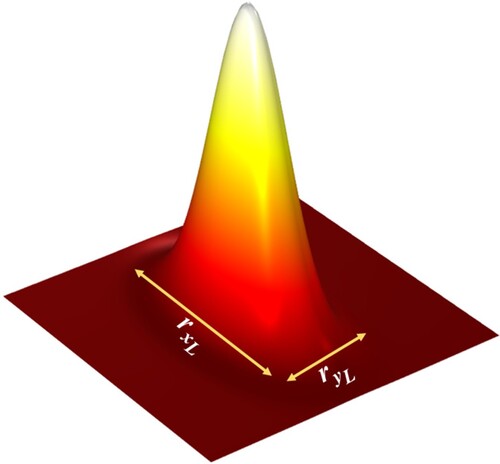
The elliptical Gaussian spatial profile of the laser beam can be expressed by:
(10)
(10) where
and
are the major and minor semiaxes of the elliptical Gaussian laser beam, respectively. According to previous literature [Citation12], the aspect ratio of the elliptical Gaussian laser beam is set to 3.7:1, and the intensity spatial profile is depicted in . Therefore, for comparative purposes, both elliptical Gaussian and circular super-Gaussian laser beams possess equivalent spot areas, namely,
. Then,
and
are calculated to be 2.31 and 0.62 mm, respectively.
Figure 3. Elliptical Gaussian intensity profile.
Coaxial multi-powder stream
The powder mass flux at the cross-sections of the coaxial multi-powder stream follows a Gaussian distribution [Citation28] and is represented by:
(11)
(11) where
stands for the powder feeding rate,
is the spot radius of the coaxial multi-powder stream, and
,
and
denote the coordinates of the deposition coordinate system
, as seen in .
Gas/liquid interface
The evolution behaviour of the gas/liquid interface is tracked using an dynamic mesh based on an arbitrary Lagrangian–Eulerian frame, and the normal velocity of this interface is described by [Citation14]:
(12)
(12) where
stands for the unit normal vector,
stands for the unit vector in the z-direction,
represents the powder catchment efficiency of the melt pool and is equal to 0.9 [Citation29], and
is the powder density.
Equivalent thermophysical properties of mushy zone
The equivalent thermophysical properties of the mushy zone can be described as [Citation24]:
(13)
(13)
(14)
(14)
(15)
(15)
(16)
(16)
(17)
(17)
(18)
(18)
in which ,
and
are respectively the equivalent density, equivalent thermal conductivity and equivalent specific heat.
is the distribution function of the phase change latent heat.
and
stand for the mass fractions of the liquid and solid phases, respectively, and obey
.
Boundary conditions
The total heat flux at the melt pool surface is depicted as follows:
(19)
(19) where
denotes the convective coefficient,
refers to the ambient temperature,
stands for the laser energy absorptivity.
denotes the laser attenuation rate induced by the coaxial multi-powder stream, which can be estimated to be 0.11 at a powder feeding rate of 10.2 g/min according to the published literature [Citation14].
is the heat flux of the coaxial multi-powder stream without laser irradiation, which plays the role of a heat sink and can be given by [Citation14]:
(20)
(20)
(21)
(21)
(22)
(22)
in which refers to the powder enthalpy and
represents the smooth step function.
To improve computational efficiency, the side and bottom surfaces of the substrate are treated as hypothetical cross-sections, where heat fluxes can be mathematically expressed as follows [Citation20]:
(23)
(23) in which
stands for the heat transfer coefficient and is equal to 1250
.
The surface tension of the melt pool is described as [Citation21]:
(24)
(24) where the first term on the right-hand side in the equation represents the normal surface tension force, and the second term is the Marangoni shear stress.
denotes the normal vector of the melt pool surface,
is the curvature of the melt pool surface, and
refers to the surface tension coefficient, and
stand for thermocapillary coefficient. For 316L stainless steel,
and
are as follows [Citation14]:
(25)
(25)
(26)
(26)
(27)
(27)
The initial values in the thermofluidic coupling transport model are listed in .
Table 1. Initial values used in the simulation.
Methods and experiments
Numerical solution method
The three-dimensional thermofluidic coupling transport model is solved using COMSOL software. To optimise the simulation time, the simulated physical model was limited to half of the substrate and a single melt track along one side of the longitudinal central cross-section aligned with the laser beam scanning line (). The computational domain dimensions for this physical model were 14 mm × 4 mm × 3 mm.
Figure 4. Schematic of the simulated physical model and its computational mesh.
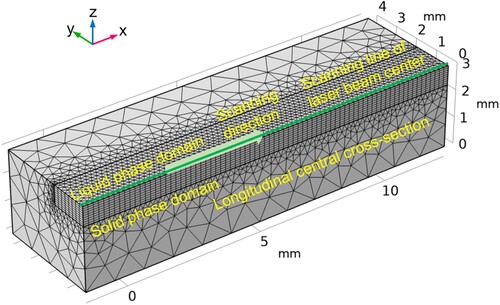
To achieve a balance between solution efficiency, accuracy, and convergence, the computational domain was partitioned into liquid and solid phase domains. The width and height of the liquid phase domain were determined through experiments. However, considering the influence of experimental errors, the width and height of the liquid phase domain should be appropriately larger than the actual width and penetration depth of the melt pool, respectively. The length of the liquid phase domain was consistent with that of the physical model. To sum up, the liquid phase domain dimensions were 14 mm × 2 mm × 1 mm. Except for the liquid phase domain, the remaining region was the solid phase domain.
A tetrahedral mesh was chosen as the computational mesh. Considering the thermofluidic coupling transport phenomenon, a finer tetrahedral mesh was employed for the liquid phase domain to ensure computational accuracy and convergence, with maximum and minimum mesh sizes of 0.128 and 0.0139 mm, respectively. On the other hand, since only heat transport occurred in the solid phase domain, a coarser tetrahedral mesh was utilised to reduce computational time, with maximum mesh of 1.14 mm and minimum mesh of 0.242 mm. The substrate and powder consist of 316L stainless steel, with their equivalent thermophysical properties, physical parameters, and constants presented in and [Citation6].
Table 2. Equivalent thermophysical properties.
Table 3. Physical parameters and constants.
Experiments
To validate the thermofluidic coupling model, single-track single-layer deposition experiments were conducted using an L-DED additive manufacturing system, as illustrated in . The laser employed was a YLS-10000 fiber laser manufactured by IPG Photonics, boasting a maximum power of 10 kW and a wavelength of 1.07 μm. An ECPF2-2 LC-type disk powder feeder was used for material supply. For delivering the laser beam and powder material to the melt pool, an Ophit ECA312KW coaxial four-channel powder feeding head was adopted, with collimating and focusing lenses featuring focal lengths of 100 and 300 mm, respectively. The motion actuator employed was a six-axis robot provided by ABB. Argon gas with purity reaching 99% served as both shielding and carrier gas.
Figure 5. L-DED additive manufacturing system based on six-axis robot.
The powder material used in the L-DED experiments consisted of 316L stainless steel powder, exhibiting diameters ranging from 53 to 105 μm. Before the experiment, the powder was subjected to a 30-minute drying at 120 °C in a vacuum dryer. The substrate employed was a hot-rolled plate of 316L stainless steel measuring 120 mm × 120 mm × 10 mm. The substrate surface was meticulously treated using sandpapers to eliminate any oxide layer present. The experimental setup and parameters employed are detailed in . These experimental parameters were determined by previous process experiments, aiming to fabricate melt tracks with good surface and metallurgical quality.
Table 4. Processing parameters used in the L-DED experiment.
After completing the L-DED experiment, the specimens were prepared according to a specific procedure. Firstly, the as-deposited melt tracks were cut into small specimens using wire-EDM. Subsequently, these specimens underwent a step-by-step rough polishing process with 400–5000# sandpaper and then received a fine polishing treatment utilising a diamond grinding paste. Finally, the polished specimens were etched by aqua regia. Once prepared, cross-sectional images of the specimens were captured using an XD30M optical microscope. The melt track geometries including height, width, and penetration depth were measured using image measurement software (Image-Pro Plus).
Results and discussion
Model validation
shows the predicted and experimental cross-sectional profile of the melt pool under the C-SGP with different laser powers. It can be observed that the predicted and experimental cross-sections exhibit the same saucer shaped profile, and the saucer shaped profile inside the substrate varies with increasing laser power.
Figure 6. Cross-sectional profiles of the melt pool under the C-SGP with different laser powers: (a) 600 W, (b) 700 W, and (c) 800 W.
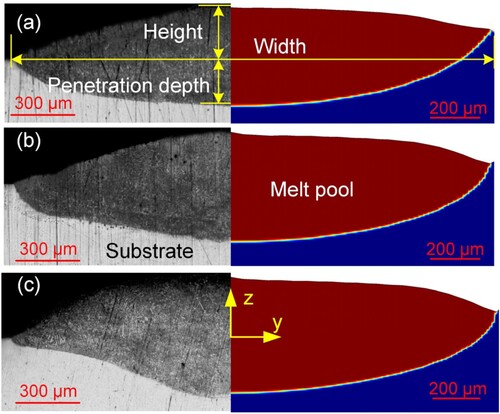
For further quantitative analysis, the height, width, and penetration depth of the melt pool were measured, as shown in . The measured and predicted values for these parameters all increased with increasing in laser power. This is primarily attributed to an increase in heat input and laser intensity on the melt pool surface resulting from higher laser power, which leads to a longer, wider, and deeper melt pool that can capture more powder and thus increase melt track height.
Figure 7. Measured and predicted melt pool sizes: (a) height; (b) width; (c) penetration depth.
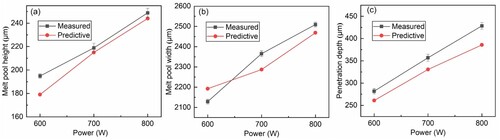
Compared with the experimental results shown in , simulation results show a maximum error of approximately 10% for melt pool height, width, and penetration depths; while the average error for melt pool height, width, and penetration depths is lower than 4.95%. Simulation errors may be attributed to three important factors. Firstly, although the basic assumptions in Section 2.1 are reasonable, there is still some deviation from the actual conditions. Secondly, the thermophysical properties of the materials used in the simulation are treated equivalently, resulting in deviations. Thirdly, some approximations can also lead to additional errors, for example, there is an error in the approximately estimated laser attenuation rate and the powder catchment efficiency. Considering these unavoidable factors, the prediction accuracy of the thermofluidic coupling transport model should be sound. Thus, it is reasonable and feasible to use this model to investigate the effects of different SLIPs on the thermal and fluid transport behaviours within the melt pool.
Heat transport characteristics
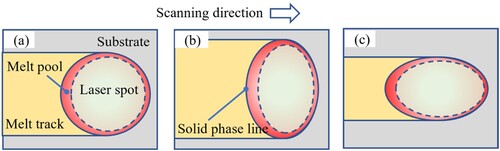
Considering the effects of conductive and convective heat transfer, a portion of the laser energy within the laser spot is transported radially outward towards the solid phase region, which resulted in the width of the melt pool slightly larger than the laser spot size perpendicular to the scanning direction, as shown in . In scanning direction, the scanning speed caused the solid-phase line at the rear edge of the melt pool to be elongated, while the opposite is true for the solid-phase line at the front edge of the melt pool. Strikingly, three SLIPs constructed the melt pool geometries on the substrate surface similar to their laser spots. And due to different laser spot geometries, three SLIPs produced significantly different melt pools and melt tracks on the substrate surfaces ().
Figure 8. Schematics of melt pool geometries under three SLIPs: (a) C-SGP, (b) TE-GP, and (c) LE-GP.
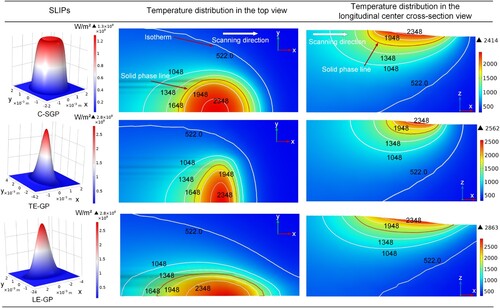
For quantitative comparison, plots the temperature fields in the L-DED process under different SLIPs (i.e. C-SGP, TE-GP and LE-GP) with the laser power of 700 W, laser scanning speed of 600 mm/min, and powder feeding rate of 10.2 g/min at 1 s. The red solid line represents the solidification interface (solid phase line) in the melt pool. It can be fund that the melt pools under the C-SGP, TE-GP and LE-GP possess medium, minimum and maximum aspect ratios, respectively, as depicted in the top view of the melt pool in . Additionally, based on the longitudinal center cross-section view of the melt pool, it is evident that the curvature of the solid phase line constructed by the LE-GP is minimal and that constructed by the C-SGP and TE-GP are comparable. Further examination reveals that the peak temperature of the melt pool under the C-SGP (2414 K) is around 6% and 19% lower than that under the TE-GP (2562 K) and LE-GP (2863 K), respectively. This discrepancy can be attributed to a lower peak intensity of the C-SGP compared to the TE-GP and LE-GP. Interestingly, despite the identical power, spot size, and spatial profile, the peak temperature induced by the LE-GP is approximately 12% higher compared to that of the TE-GP. This disparity arises from the alignment of the major axis of the LE-GP parallel to the laser scanning direction (), resulting in an extended duration of laser heating on the melt pool.
Figure 9. Temperature fields under the three SLIPs.
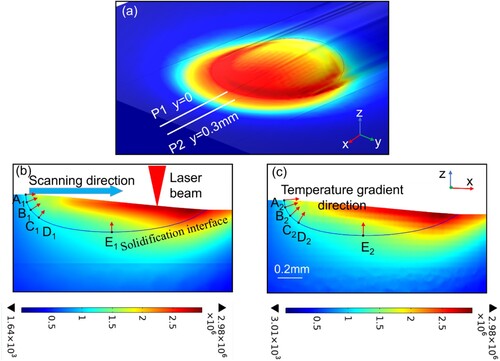
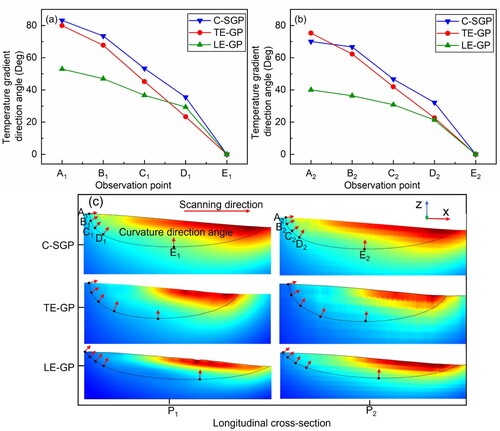
The temperature gradient at the solidification interface plays a crucial role in determining the grain morphology and size. Therefore, the temperature gradients at the solidification interface on longitudinal cross-sections P1 and P2 at y = 0 and y = 0.3 were taken as our analysis objects (). Five locations A, B, C, D, and E were selected as observation points, along the solidification interface for further analysis. These points were equally spaced by 0.1 mm in the height direction with locations A and E representing the top and bottom of the melt pool, respectively. The subscripts 1 and 2 in A∼E corresponded to the longitudinal cross-sections P1 and P2, respectively ().
Figure 10. Temperature gradient under C-SGP: (a) 3D view, (b) longitudinal cross-section P1, and (c) longitudinal cross-section P2.
plots the temperature gradients at points A∼E under the C-SGP, TE-GP, and LE-GP. The temperature gradients at these points under the different SLIPs increase sequentially, and those under the TE-GP are the highest. The important reason will be analyzed in the next section.
Figure 11. Temperature gradients at five observation points under the three SLIPs: (a) longitudinal cross-section P1, and (b) longitudinal cross-section P2.
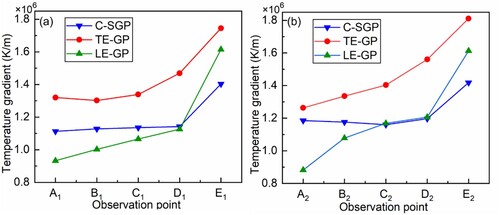
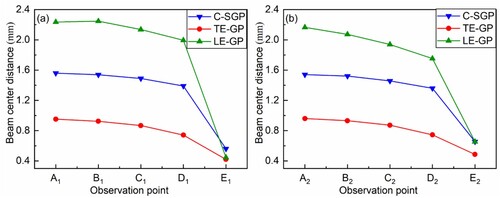
Therefore, for comparative purposes, the distance from the observation point to the laser center on the surface of the melt pool is defined as the beam center distance. illustrates that a smaller the beam center distance corresponds to a denser isotherm, indicating a higher temperature gradient. demonstrate a sequential increase in temperature gradients at locations A∼E due to their gradually decreasing beam center distances (). More importantly, under the TE-GP, A1∼E1 () and A2∼E2 () exhibit significantly higher temperature gradients due to their smallest beam center distances, as seen in . The calculation results reveal that under the TE-GP, the average temperature gradient at locations A1∼E1 is 22.03% and 25.40% higher compared to the C-SGP and LE-GP, respectively, while that at positions A2∼E2 is respectively elevated by 19.51% and 23.59% compared to the C-SGP and LE-GP. Furthermore, it can be deduced that the average temperature gradient under the TE-GP is respectively increased by 20.77% and 24.50% in comparison with the C-SGP and LE-GP. On the basis of the columnar-to-equiaxed transition mechanism [Citation25], it can be inferred that a high temperature gradient promotes columnar grain formation. Therefore, the TE-GP can create thermodynamic conditions that are more conducive to the formation of columnar grains.
Figure 12. Beam center distance at the five observation points under three SLIPs: (a) longitudinal cross-section P1, and (b) longitudinal cross-section P2.
The direction of the temperature gradient is a crucial heat transport parameter that dominates the growth angle of columnar grain. Specifically, the growth direction of columnar grains aligns with the local temperature gradient at the solidification interface [Citation30]. To enable quantitative analysis, the temperature gradient direction angle is introduced by EquationEq. 29(29)
(29) , which represents the angle
between the temperature gradient vector and the build direction (z-direction).
(28)
(28) where
,
and
stand for the magnitudes of the temperature gradient vectors in the x, y and z directions, respectively.
show the temperature gradient direction angles at locations A∼E under the C-SGP, TE-GP and LE-GP. Under the three SLIPs, the sequential decrease in temperature gradient direction angles at locations A∼E suggests a gradual alignment of columnar grain growth towards the z-direction. Notably, the consistency between the temperature gradient direction angle and curvature direction angle at the solidification interface allows for quick identification of trends based on the morphology of the solidification interface, as depicted in (c). It can be fund from that the temperature gradient direction angles exhibit the smallest magnitudes and the narrowest variation ranges under the LE-GP, while those under TE-GP and C-SGP demonstrate comparable magnitudes and variation ranges. It can also be discovered that under the LE-GP, the average magnitude of the temperature gradient direction angles at locations A∼E is respectively 48.80% and 56.48% lower than that of the TE-GP and C-SGP, while the average variation range of the temperature gradient direction angles at locations A∼E is 66.82% and 64.69% smaller in comparison with the TE-GP and C-SGP, separately. The above results implies that the LE-GP exhibit a greater potential for generating quasidirectional columnar grains along the build direction.
Figure 13. Temperature gradient direction angle at the five observation points under three SLIPs: (a) longitudinal cross-section P1, (b) longitudinal cross-section P2, and (c) morphology of solidification interface.
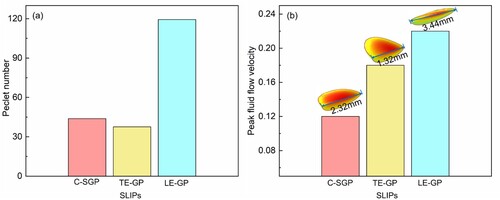
The Peclet number (Pe) belongs to a dimensionless number that can be applied to evaluate the significance of convection and conduction patterns in heat transport within the melt pool. When Pe < 5, the conduction pattern governs the heat transport; when Pe > 100, the convection pattern dominates the heat transport. The Peclet number is expressed as [Citation31]:
(29)
(29) where
is the thermal diffusivity and is defined by
;
and
are the peak fluid flow velocity and melt pool length, respectively.
plots the Peclet number of the melt pool under the C-SGP, TE-GP and LE-GP at 1 s. The Peclet numbers under the three SLIPs are 43.86, 37.59 and 119.35, respectively, all of which exceed the lower critical value of 5. However, only the Peclet number under the LE-GP surpasses the upper critical value of 100. Therefore, it can be inferred that the heat transport processes within the melt pool under the C-SGP and TE-GP are predominately governed by convection and conduction patterns in conjunction, whereas those under the LE-GP are primarily influenced by convection patterns. According to , the length and peak fluid flow velocity of the melt pool reach their maximum values under the LE-GP. Although the peak fluid flow velocity under the TE-GP is higher than that under the C-SGP, the length of the melt pool is significantly smaller. It can be observed from EquationEq. 28(28)
(28) that, with a given material, there exists a positive correlation between the Peclet number and the product of the length and peak fluid flow velocity of the melt pool. The Peclet number under the LE-GP exhibits the highest value (119.35) as determined by computation, followed by the Peclet numbers under the C-SGP and TE-GP with values of 43.86 and 37.59, respectively. Notably, the disparity in Peclet numbers under the identical processing parameters, materials, and environments can be attributed to the SLIP and its positional relationship with respect to the laser moving direction. Specifically, when the major axis aligns parallel to the laser moving direction, a longer melt pool is more likely to form along with higher peak fluid flow velocity, thereby increasing the Peclet number and enhancing the heat convection effects.
Figure 14. The fluid flow characteristics of the melt pool under three SLIPs: (a) Peclet number, and (b) melt pool length and peak fluid flow velocity.
In summary, SLIPs can exert a significant influence on the thermodynamic conditions governing grain morphology and growth direction, including the magnitude and direction of the temperature gradient at the solidification interface, due to their significant distinct energy distribution. Consequently, it is anticipated that tailoring specific grain structures could be achieved by utilising the C-SGP, TE-GP and LE-GP.
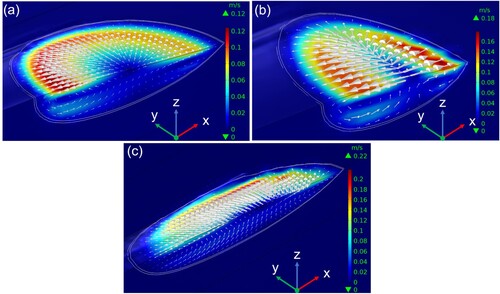
Fluid flow characteristics
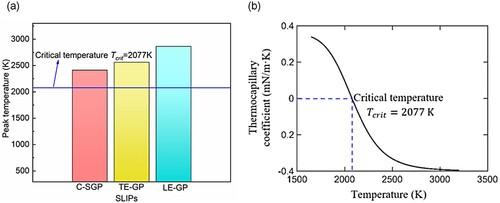
The velocity fields within the melt pools under the C-SGP, TE-GP and LE-GP at processing conditions (P = 700 W, V = 600 mm/min and = 10.2 g/min) are plotted in . A comparison of the velocity fields under three SLIPs reveals an outward flow vortex pattern in the melt pool. Specifically, the melts at the surface layer of the melt pool flow from the middle to the edge, while those at the bottom layer flow from the edge to the middle. This phenomenon can be attributed to a peak temperature exceeding 2077K (the critical temperature
of the thermocapillary coefficient for 316L stainless steel) in the middle of each melt pool under the C-SGP, TE-GP, and LE-GP (Figure 17(a)). When this temperature surpasses
, it causes a transition in thermocapillary coefficient from positive to negative as shown in Figure 17(b) [Citation6]. In case of a negative thermocapillary coefficient, Marangoni shear stress (
) aligns with heat flow direction, inducing melts at the surface layer to move toward edges. Owing to momentum conservation, the melts at the surface layer of the melt pool induce a flow towards the middle of the melt pool in the bottom layer.
Figure 15. Velocity fields of the melt pool under three SLIPs: (a) C-SGP, (b) TE-GP, and (c) LE-GP.
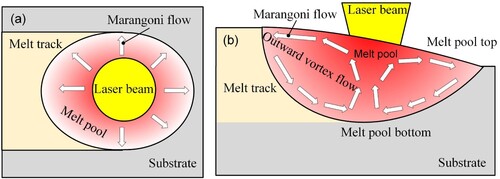
In case where an outward vortex flow pattern () is observed, Marangoni flow facilitates the transport of laser energy from near the laser axis to outside of the melt pool, thereby expanding its top area [Citation32], as shown in . However, the melt above the melt pool bottom flows upwards, which prevents the laser energy carried by the melt from reaching the melt pool bottom by heat convection, resulting in a reduction in melt pool depth, as depicted in .
Figure 16. Schematics of Marangoni flow and its driven outward vortex flow within melt pool under different views: (a) top view and (b) longitudinal center cross-section view of melt pool.
shows that the highest peak fluid flow velocity (0.22 m/s) is observed under the LE-GP, followed by the TE-GP (0.18 m/s) and C-SGP (0.12 m/s). Obviously, the peak fluid flow velocity under the LE-GP is elevated by 18.18% and 45.45% when compared to the TE-GP and C-SGP, separately. This can be attributed to the dominant influence of Marangoni shear stress as a key driving force for melt flow, while the thermocapillary coefficient plays an important role. As depicted in , when the peak temperature of the melt pool exceeds the critical temperature of the thermocapillary coefficient, both absolute value of the thermocapillary coefficient and Marangoni shear stress increases with increasing the peak temperature. According to , all the SLIPs have peak temperatures above this critical temperature, indicating that the deviation from this threshold is a crucial factor affecting the peak fluid flow velocity within the melt pool.
Figure 17. (a) Peak temperatures of melt pool under three SLIPs; (b) the temperature-dependent thermocapillary coefficient.
The Marangoni number (Ma) is a dimensionless parameter that can be adopted to estimate the impact of Marangoni effect on the fluid dynamics within the melt pool. When Ma >1, Marangoni effect dominates the fluid flow. Marangoni number Ma can be expressed as [Citation33]:
(30)
(30) where
refers to the difference between the solidus temperature and the peak temperature of the melt pool.
shows the Marangoni numbers under the C-SGP, TE-GP and LE-GP using laser power of 700 W, laser scanning speed of 600 mm/min, and powder feeding rate of 10.2 g/min. The Marangoni numbers for the three SLIPs are approximately 1.87 × 10⁴, 1.27 × 10⁴, and 4.39 × 10⁴, respectively, all significantly exceeding 1. This finding indicates that the dominant fluid flow within the pool is governed by the Marangoni effect for all three SLIPs; however, among them, the LE-GP exhibits the strongest Marangoni convection due to maximum melt pool length ().
Figure 18. The Marangoni numbers under three SLIPs.
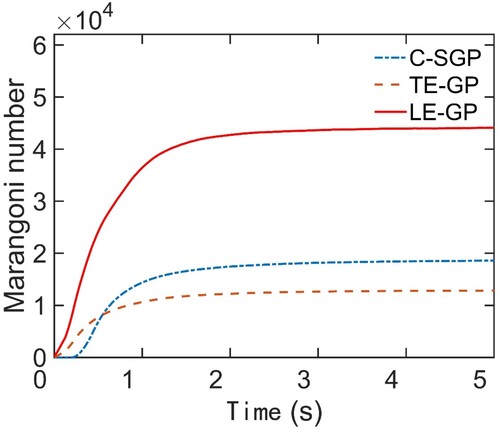
Due to the positive correlation between Marangoni convection and convective heat transport [Citation34], the LE-GP can effectively utilise laser energy to enlarge the surface area of the melt pool under the outward flow vortex pattern, albeit at a reduced penetration depth. This scenario not only enhances the power capture efficiency of the melt pool but also proves more suitable for laser cladding processes with low dilution. In practical terms, the major factor influencing variations in Marangoni numbers is the SLIP and its positional relationship with respect to the laser moving direction. Specifically, when the major axis aligns parallel to the laser moving direction, the LE-GP is more likely to obtain a longer melt pool and higher peak temperature, thereby increasing the Marangoni number and enhancing the Marangoni convection effects.
Conclusions
A three-dimensional thermofluidic coupling transport model of L-DED is developed, and the solution procedure is proposed using the commercial software COMSOL. The model incorporates key physical phenomena, including laser attenuation induced by powder, solid/liquid phase change, evolution of gas/liquid interface, and the Marangoni effect. Single-track single-layer L-DED experiments validate the thermofluidic coupling transport model, demonstrating excellent agreement between the predicted and experimental melt pool morphologies.
The melt pool geometries under three different SLIP conditions, including the C-SGP, TE-GP and LE-GP, are investigated. The aspect ratios of the melt pools fabricated by these conditions vary significantly, with the TE-GP having a minimum aspect ratio while the LE-GP exhibits the maximum aspect ratio among them. The curvature of the solidification interface fabricated using the LE-GP is found to be the smallest compared to that fabricated using the C-SGP and TE-GP, which exhibit comparable curvatures.
In terms of the thermodynamic conditions at the solidification interface, the average temperature gradient under the TE-GP is separately 20.77% and 24.50% higher than that under the C-SGP and LE-GP, which may favour columnar grain formation. In comparison with the TE-GP and C-SGP strategies, the LE-GP yields 48.80% and 56.48% lower the average magnitude of the temperature gradient direction angles separately, and the average variation range of the temperature gradient direction angles is reduced by 66.82% and 64.69%, respectively. The results indicates that the LE-GP potentially facilitate the formation of quasidirectional columnar grains along the building direction. The heat transport processes within the melt pool under both C-SGP and TE-GP are jointly dominated by heat convection and conduction, while those under the LE-GP are dominated by heat convection.
The fluid flow characteristics within the melt pool under the three SLIPs are investigated. The results demonstrate that all three SLIPs exhibit a circular vortex pattern with outward flow in the melt pool. Compared to the TE-GP and C-SGP, the LE-GP yields 18.18% and 45.45% higher the peak fluid flow velocity, respectively. The Marangoni convection effect dominates the fluid flow in all three SLIPs, but it is strongest in the LE-GP and weakest in the TE-GP.
Disclosure statement
No potential conflict of interest was reported by the author(s).
Data availability statement
The data that support the findings of this study are available from the corresponding author, [Jiazhu Wu], upon reasonable request.
Additional information
Funding
References
- Laleh M, Sadeghi E, Revilla RI, et al. Heat treatment for metal additive manufacturing. Prog Mater Sci. 2023;133:101051.
- Li X, Dai RL, Chen SB, et al. Offline planning optimization and formation prediction of laser directed energy deposition process. Opt Laser Technol. 2023;164:109510.
- Yan ZR, Liu WW, Tang ZJ, et al. Review on thermal analysis in laser-based additive manufacturing. Opt Laser Technol. 2018;106:427–441.
- Song M, Wu L, Liu J, et al. Effects of laser cladding on crack resistance improvement for aluminum alloy used in aircraft skin. Opt Laser Technol. 2021;133:106531.
- Kaikai X, Yadong G, Qiang Z. Numerical simulation of dynamic analysis of molten pool in the process of direct energy deposition. Int J Adv Manuf Technol. 2023;124(7-8):2451–2461. doi:10.1007/s00170-022-10271-7
- Wu JZ, Ren S, Zhang Y, et al. Influence of spatial laser beam profiles on thermal-fluid transport during laser-based directed energy deposition. Virtual Phys Prototyp. 2021;16(4):444–459.
- Galbusera F, Caprio L, Previtali B, et al. The influence of novel beam shapes on melt pool shape and mechanical properties of LPBF produced Al-alloy. J Manuf Process. 2023;85:1024–1036.
- Wu JZ, Wei H, Yuan F, et al. Effect of beam profile on heat and mass transfer in filler powder laser welding. J Mater Process Technol. 2018;258:47–57.
- Huang S, Narayan RL, Tan JHK, et al. Resolving the porosity-unmelted inclusion dilemma during in-situ alloying of Ti34Nb via laser powder bed fusion. Acta Mater. 2021;204:116522.
- Bi J, Wu LK, Li SD, et al. Beam shaping technology and its application in metal laser additive manufacturing: a review. J Mater Res Technol. 2023;26:4606–4628.
- Cheng M, Xiao X, Luo G, et al. Effect of laser intensity profile on the microstructure and texture of Inconel 718 superalloy fabricated by direct energy deposition. J Mater Res Technol. 2022;18:2001–2012.
- Roehling TT, Wu SSQ, Khairallah SA, et al. Modulating laser intensity profile ellipticity for microstructural control during metal additive manufacturing. Acta Mater. 2017;128:197–206.
- Zhao Y, Sun W, Wang Q, et al. Effect of beam energy density characteristics on microstructure and mechanical properties of Nickel-based alloys manufactured by laser directed energy deposition. J Mater Process Technol. 2023;319:118074.
- Wu JZ, Zheng XQ, Zhang Y, et al. Modeling of whole-phase heat transport in laser-based directed energy deposition with multichannel coaxial powder feeding. Additive Manuf. 2022;59:103161.
- Lian YP, Wang PD, Gao J, et al. Fundamental mechanics problems in metal additive manufacturing: a state-of-art review. Adv Mech. 2021;51(3):648–701.
- Li S, Xiao H, Liu K, et al. Melt-pool motion, temperature variation and dendritic morphology of Inconel 718 during pulsed-and continuous-wave laser additive manufacturing: a comparative study. Mater Des. 2017;119:351–360.
- Bayat M, Nadimpalli VK, Biondani FG, et al. On the role of the powder stream on the heat and fluid flow conditions during directed energy deposition of maraging steel—multiphysics modeling and experimental validation. Additive Manuf. 2021;43.
- Brent AD, Voller VR, Reid KJ. Enthalpy-porosity technique for modeling convection-diffusion phase change: application to the melting of a pure metal. Numer Heat Transf. 1988;13(3):297–318. doi:10.1080/10407788808913615
- Han L, Phatak KM, Liou FW. Modeling of laser cladding with powder injection. Metallurg Mater Transactions B. 2004;35(6):1139–1150.
- Wirth F, Wegener K. A physical modeling and predictive simulation of the laser cladding process. Additive Manuf. 2018;22:307–319.
- Song J, Chew YX, Bi GJ, et al. Numerical and experimental study of laser aided additive manufacturing for melt-pool profile and grain orientation analysis. Mater Des. 2018;137:286–297.
- Xi MZ, Yu G, Zhang YZ, et al. Interaction of the laser beam and the metal powder conveyed by coaxial powder feeder. Chin J Lasers. 2005;32(4):562–566.
- Ai Y, Jiang P, Shao X, et al. The prediction of the whole weld in fiber laser keyhole welding based on numerical simulation. Appl Therm Eng. 2017;113:980–993.
- Wang Y, Tsai HL. Impingement of filler droplets and weld pool dynamics during gas metal arc welding process. Int J Heat Mass Transfer. 2001;44(11):2067–2080.
- Wei HL, Mukherjee T, Zhang W, et al. Mechanistic models for additive manufacturing of metallic components. Prog Mater Sci. 2021;116:100703.
- Cook PS, Murphy AB. Simulation of melt pool behaviour during additive manufacturing: underlying physics and progress. Additive Manuf. 2020;31:100909.
- Wu JZ, Liu T, Chen H, et al. Simulation of laser attenuation and heat transport during direct metal deposition considering beam profile. J Mater Process Technol. 2019;270:92–105.
- Wu JZ, Zhao PH, Wei HY, et al. Development of powder distribution model of discontinuous coaxial powder stream in laser direct metal deposition. Powder Technol. 2018;340:449–458.
- Gan ZT, Yu G, He XL, et al. Surface-active element transport and its effect on liquid metal flow in laser-assisted additive manufacturing. Int Commun Heat Mass Transfer. 2017;86:206–214.
- Debroy T, Wei HL, Zuback JS, et al. Additive manufacturing of metallic components-process, structure and properties. Prog Mater Sci. 2017;92:112–224.
- Lee Y, Farson DF. Simulation of transport phenomena and melt pool shape for multiple layer additive manufacturing. J Laser Appl. 2016;28(1):4935711.
- Kumar A, Roy S. Effect of three-dimensional melt pool convection on process characteristics during laser cladding. Comput Mater Sci. 2009;46(2):495–506.
- DebRoy T, Wei HL, Zuback JS, et al. Additive manufacturing of metallic components – process, structure and properties. Prog Mater Sci. 2018;92:112–224.
- Bayat M, Mohanty S, Hattel JH. A systematic investigation of the effects of process parameters on heat and fluid flow and metallurgical conditions during laser-based powder bed fusion of Ti6Al4 V alloy. Int J Heat Mass Transfer. 2019;139:213–230.