
 ?Mathematical formulae have been encoded as MathML and are displayed in this HTML version using MathJax in order to improve their display. Uncheck the box to turn MathJax off. This feature requires Javascript. Click on a formula to zoom.
ABSTRACT
Microstructural defects in laser powder bed fusion (LPBF) metallic materials are correlated with processing parameters. A multi-physics model and a crystal plasticity framework are employed to predict microstructure growth in molten pools and assess the impact of manufacturing defects on plastic damage parameters. Criteria for optimising the LPBF process are identified, addressing microstructural defects and tensile properties of LPBF Hastelloy X at various volumetric energy densities (VED). The results show that higher VED levels foster a specific Goss texture {110} <001>, with irregular lack of fusion defects significantly affecting plastic damage, especially near the material surface. A critical threshold emerges between manufacturing defects and grain sizes in plastic strain accumulation. The optimal processing window for superior Hastelloy X mechanical properties ranges from 43 to 53 J/mm3. This work accelerates the development of superior strength-ductility alloys via LPBF, streamlining the trial-and-error process and reducing associated costs.
1. Introduction
In the rapidly evolving domains of aviation, aerospace, and advanced manufacturing, there have been substantial transformations in the structural elements employed in aerospace applications and crafted from superalloys. These components have experienced a shift towards more intricate and sophisticated designs. Nevertheless, conventional manufacturing methods are confronting difficulties in efficiently producing small, intricate, and precise structural components [Citation1, Citation2]. Concurrently, there is an imperative to expedite the development and on-site repair of superalloy structural components using advanced manufacturing technologies [Citation3]. Considering these factors, the broad suitability of laser powder bed fusion (LPBF) for superalloys in engineering realms has become a subject of considerable interest and concern [Citation4, Citation5]. The intricate reaction dynamics within the molten pool, along with the high-temperature gradient and rapid cooling rates experienced during the LPBF of superalloys, give rise to prominent microstructural defects [Citation6, Citation7]. Notably, the printing defects that possess the potential to substantially influence the durability and service life of the material during application are of particular concern [Citation8]. In recent years, significant advancements have been made in the process and post-treatment of nickel-base superalloy manufactured via LPBF [Citation9, Citation10].
Nonetheless, achieving defect-free and high-quality components via LPBF remains an enduring challenge [Citation11, Citation12]. Moreover, particular post-treatment techniques, such as hot isostatic pressing, frequently result in extended processing durations and increased final product costs [Citation13]. Furthermore, the microstructural changes arising from post-heat treatments fundamentally alter the material's mechanical properties, encompassing its strength and ductility [Citation14]. Exacerbating the matter, applying heat treatment to larger-sized formed parts proves infeasible [Citation15]. Exclusive reliance on heat treatment is not a viable approach, necessitating a comprehensive evaluation of defect tolerance to concentrate on monitoring critical regions [Citation16]. Simultaneously, the study of defective damage behaviour serves as a guiding principle for process optimisation.
The Laser energy density constitutes a pivotal process parameter that significantly impacts the quality of LPBF products [Citation17–19]. Its impact is primarily evident in the alteration of the temperature and dimensions of the molten pool, potential loss of elements through evaporation, melt fluidity, viscosity, solidification rate, and grain size [Citation20, Citation21]. Additionally, it initiates cyclic heat treatment of solidified metals, leading to potential phase precipitation and internal stresses within the matrix [Citation22, Citation23]. Previous studies have conclusively demonstrated that laser energy density profoundly influences the microstructure, metallurgical conditions, and properties of LPBF components [Citation24]. These effects include the formation of pores, generation of internal stresses, modifications in alloy composition due to element evaporation, the emergence of precipitates, and the development of high-density dislocation cells [Citation25]. Consequently, gaining a comprehensive understanding of how processing parameters impact the physical melting process and microstructural defects provides a more holistic insight into the intrinsic relationship between microstructural defects and the manufacturing process. Such insights serve as a robust theoretical foundation for advancing research and development endeavours aimed at producing cost-effective, high-quality printed components.
Utilising the FLOW-3D multi-physics field simulation to model the dynamic process within the molten pool, this study quantifies the influence of laser energy density on the evolution of microstructural defects via parameter indexing. Concurrently, the crystal plastic finite element software assists in predicting defect damage tolerance, with experimental results employed for comparative analysis to enhance prediction accuracy. Process optimisation guidelines, rooted in thermal field analysis and crystal plasticity, are simultaneously developed to provide guidance for producing high-quality LPBF printed components.
2. Experimental details
2.1. Materials and LPBF process
The LPBF Hastelloy X alloys employed in this study were manufactured using an EOS M290 system equipped with a 200 W fiber laser. The preparation involved the use of aerosolized Hastelloy X superalloy powders sourced from the Shanghai Institute for Materials Research. These powders exhibited nominal particle sizes ranging from 20 to 60 µm, facilitating the production of printed components with dimensions measuring 60 mm × 50 mm × 20 mm. To explore the correlation between process parameters and microstructural defects, various laser energy densities (31, 43, 53, 67, 91 J/mm3) were employed for sample printing in the experimental setup. The laser energy densities were primarily controlled by varying the scanning speed and fine-tuning the scanning spacing (550 mm/s, 0.125 mm; 750 mm/s, 0.11 mm; 950 mm/s, 0.176 mm; 1150 mm/s, 0.146 mm; 1600 mm/s, 0.22 mm) to achieve the desired manipulation of the volumetric energy density. Moreover, a 67° interlayer scanning strategy was adopted, scanning the powder bed layer by layer in continuous laser mode while preheating the substrate to 80°C to mitigate the generation of residual stresses during fabrication. The printing cavity was maintained in a protective Ar atmosphere with the oxygen content regulated below 200 ppm.
2.2. Microstructural characterisation
The printed samples were sequentially ground with SiC sandpaper until achieving a grit size of 3000#. Subsequently, mechanical polishing was performed using a diamond suspension with particles smaller than 1 μm, followed by vibration polishing with a colloidal suspension of 20 nm SiO2 to eliminate scratches and stress layers. To ensure comprehensive cleaning, the samples were subjected to ultrasonic treatment in alcohol for 15 min. For microstructural observation, the samples underwent etching in a solution comprising 5 g FeCl3, 50 ml HCl, and 50 ml deionised water for 30 s. Subsequently, the Quanta 500 FEG SEM was employed to examine the microstructure and morphology of the samples. To determine specific characteristics, including grain size, grain boundary distribution, and kernel average misorientation (KAM), the printed samples were subjected to an Electron Backscatter Diffraction (EBSD) test utilising a scanning step of 1 μm. To detect defects in the LPBF products, which possessed dimensions of 10 × 10 × 2 mm, an X-5000 CT device was utilised. Subsequently, CT data analysis and image reconstruction were performed using Avizo 9.0 software.
2.3. Tensile tests
The tensile samples were prepared following the ASTM E8 standard, ensuring their adherence to precise sizing specifications. Prior to testing, the surface of the samples underwent polishing. Subsequently, room temperature tensile tests were carried out utilising an electronic universal testing machine, with a constant tensile rate set at 10−3 s−1. To guarantee reliability and statistical significance, a minimum of three valid results were carefully selected for each sample prepared under distinct fabrication parameters. Upon completion of the tensile tests, the samples underwent fractographic examination to observe the tensile fracture morphology.
2.4. LPBF simulation
This investigation developed a comprehensive multi-physics field model using Flow 3D software, encompassing vital aspects such as molten metal flow, phase transitions (melting, solidification, vaporisation, and solid-state phase transformation), Marangoni effect, recoil pressure, surface tension, and laser-material interactions [Citation26]. The detailed methodology for calculations and initial inputs is presented below.
The powder deposition process was subject to numerical simulation utilising the discrete element method (DEM). Initially, powder of the desired layer thickness was generated from a plane positioned above the substrate, following which, under the influence of gravity, the powder descended freely onto the substrate. To accurately replicate the packing density of the powder bed observed during the actual printing process, a rigid plane was employed to compress the powder bed, simulating the pressure exerted by the platen in experimental conditions. Simultaneously, this ensures a slight deviation in the particle size distribution and apparent density of the powder bed from the actual system [Citation27]. The occurrence of recoil, Marangoni force, and capillary force on the liquid metal surface induced significant deformation of the powder at the free surface. Furthermore, the simulations accounted for the laser absorption efficiency and multiple reflections of the powder to obtain precise outcomes. It is essential to highlight that the density and viscosity of the molten metal were considered temperature-dependent variables rather than fixed values to ensure realistic representations in the model. The simulation domain encompasses two distinct regions: the gas-phase and solid-phase regions. Solving the continuity and momentum transfer equations specific to the metallic phase determines the velocity and pressure fields. The temperature fields during the LPBF process are acquired through the solution of the energy transport equation and the coupled momentum transport equation. The surfaces of the metallic phases are effectively tracked and identified using the split Lagrangian method. In line with Fourier's law of thermal conductivity, a Gaussian-type surface heat source model was adopted to represent the heat source. The simulation area was defined as 800 × 800 × 260 μm and discretized into 1312000 meshes to ensure improved accuracy in the results. The physical parameters of Hastelloy X were sourced from literature and official manuals, as presented in . The simulated laser parameters were meticulously aligned with the experimental control for consistency.
Table 1. Thermal properties of Hastelloy X used in this work [Citation28–30].
2.5. Crystal plasticity finite element simulation
The crystal plastic finite element method (CPFEM) constitutes a numerical simulation approach employed to model the elastic-plastic behaviour of crystals [Citation31]. This method amalgamates the dislocation theory of material science with the continuum theory of solid mechanics, effectively integrating it with the finite element method. By conducting crystal plasticity calculations, this approach enables a comprehensive understanding of the plastic deformation mechanism and damage evolution in materials in tandem with macroscopic mechanical responses. Employing the finite element software ABAQUS and the user-defined material subroutine (UMAT) specifically tailored for crystal plasticity, the crystal plasticity is computed based on the finite element framework of Huang et al. [Citation32]. The investigation explores the impact of defects on variable localisation during the loading process. The input parameters include elastic matrix elements, plastic parameters derived from room temperature tensile test results, and orientation angle data acquired from Electron Backscatter Diffraction (EBSD) findings. The rate correlation coefficient and reference shear strain rate are set to 20 and 0.001, respectively. The output results consist of von Mises equivalent stress and cumulative plastic strain (SDV121).
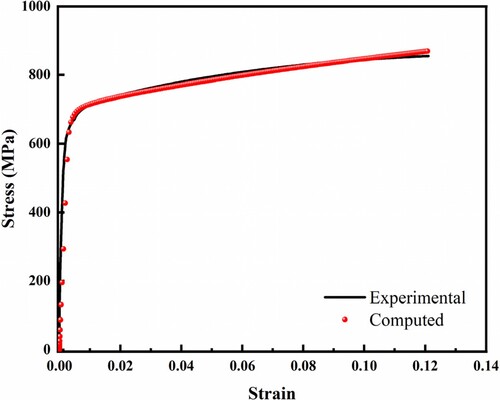
The state variable SDV121 represents the cumulative shear plastic strains across 12 slip systems. To investigate the influence of defect size, type, and location, representative volume element (RVE) models are generated using open-source Homtools plug-ins and Neper software. illustrates the model and boundary conditions. For 2D and 3D models, CPS4R and C3D4 elements are employed, respectively. The modeling dimensions closely align with the actual EBSD size and orientation distribution characteristics. The equation constraint function of Abaqus is utilised to ensure periodic boundary conditions. The elastic matrix data within the model are derived from reference [Citation33], while the plastic parameters are determined via the ‘trial and error method’ based on experimental data. Comparison of the calculated stress–strain curve with experimental results, as depicted in , reveals a favourable agreement between the simulation and test outcomes.
Figure 1. Model and boundary conditions of LPBF Hastelloy X alloy for crystal plasticity simulation: (a) 2D model; (b) 3D model.
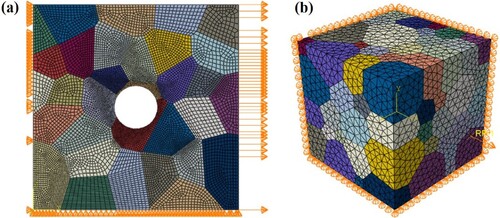
Figure 2. Comparison between the calculated results of stress-strain curves and the experimental results.
3. Results and discussions
3.1. Multi-track simulation
The LPBF single-layer multi-track process was simulated using a combination of the discrete element method (DEM) and computational fluid dynamics (CFD) techniques. The relevant results of these simulations are presented in , , . displays the temperature field of the LPBF Hastelloy X alloy at various Volumetric Energy Density (VED) values. The temperature extraction was performed at the coordinates (0.005, 0.01, −0.003) located at the bottom of the powder bed. The resulting temperature-versus-time graph is depicted in a, indicating the melting point of Hastelloy X (1628 K) with a magenta dashed line. The temperature values above the magenta dashed line represent the liquid phase, and their intersection point indicates the duration of the liquid phase lifetime. The results reveal notable trends associated with the increase in VED value. Notably, the duration of the liquid phase increases from 1.5 × 10⁻⁴ to 3.8 × 10⁻⁴ s. Concurrently, the width of the temperature influence expands, and the maximum temperature also rises. The three-dimensional morphology and temperature profile of the melting trajectory provide valuable insights into the dynamic process. It is observed that the laser is deactivated at the 0.012 s mark, and the subsequent natural cooling leads to the formation of a completely solidified trajectory. When the laser spot approaches the powder, rapid melting of the powder occurs, causing the molten liquid to swiftly spread due to surface tension, ultimately forming an initial molten pool. The molten pool exhibits rapid growth in width, depth, length, and temperature. When reaching the center of the molten pool, the temperature peaks and remains relatively stable afterward.
Figure 3. The simulated temperature distribution and single-layer multi-track isothermograms of LPBF Hastelloy X, located at the bottom of the powder bed, are presented for various laser energy densities. (a) depicts the single-point temperature distribution at the bottom of the powder bed, followed by the isothermograms corresponding to laser energy densities of (b) 31 J/mm3, (c) 43 J/mm3, (d) 53 J/mm3, (e) 67 J/mm3, and (f) 91 J/mm3.
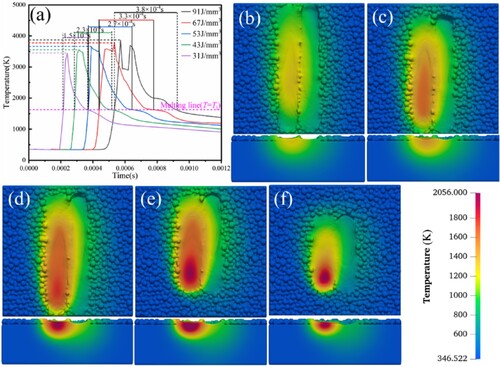
Figure 4. The simulation outcomes elucidate the temperature gradient and cooling rate observed within the LPBF Hastelloy X molten pool under varying VED.
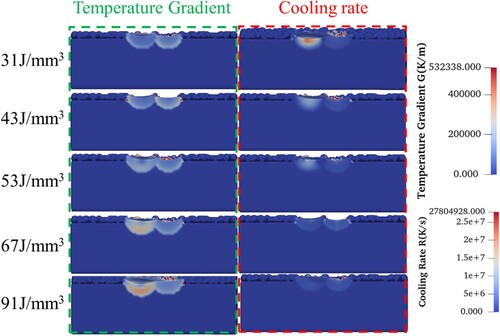
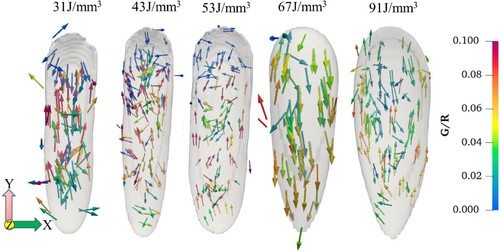
Figure 5. The simulation results illustrate the distribution of the G/R vector within the single-track liquid region of LPBF Hastelloy X, as influenced by different VEDs.
The temperature profile of the molten pool reveals the existence of slightly depressed spots at the top. Remarkably, this tendency for depression becomes more pronounced with the increase in laser energy density. These findings indicate that at higher VED values, the peak temperature of the molten pool can reach the evaporation temperature of the metal, resulting in the generation of recoil pressure. This, in turn, enhances the fluidity of the melt, enabling the depression at the top of the molten pool to be filled, leading to a relatively smooth overall appearance. Moreover, the examination of the molten pool’s behaviour also reveals the formation of ripples at the tail section. Such ripples are attributed to Marangoni convection, driven by surface tension gradients. These complex fluid dynamics phenomena contribute to the overall thermal behaviour within the molten pool, affecting its shape and stability during the LPBF process.
The LPBF process involves a complex thermal history marked by rapid cooling and cyclic reheating, leading to a unique microstructure in the material of the printed component. presents the spatial distribution of critical parameters within the molten pool, specifically the temperature gradient G and cooling rate R. Notably, the temperature gradient G increases gradually from the top to the bottom of the molten pool. In contrast, the cooling rate R displays a decline from the top to the bottom and from the inside to the edge of the molten pool. The growth rate of grains exhibits a strong correlation with the cooling rate. Additionally, with an increase in the VED value, the temperature gradient of the molten pool undergoes a substantial increase, while the cooling rate exhibits the opposite trend. The distinctive behaviour stems from various factors. Firstly, the relatively short duration of the liquid-phase region within the molten pool and the corresponding low energy input per unit time contribute to a lower peak temperature at lower VED values, resulting in a higher cooling rate. Conversely, at higher VED values, the liquid-phase zone within the molten pool exhibits a lengthier lifetime and reaches a higher peak temperature, resulting in a more pronounced temperature gradient.
Following the classical solidification theory, the G/R ratio is employed to elucidate the disparities in solidification microstructure, as depicted in . This visualisation presents the G/R vector values within the single-pass liquid-phase zone at varying VED values. The analysis reveals intriguing patterns in the distribution of the G/R ratio. Within the laser front region, the G/R ratio appears relatively small, with the vector direction pointing towards the rear end of solidification. Conversely, the G/R ratio exhibits a larger value on both sides of the liquid-phase zone, with the vector direction pointing towards the laser front region. Notably, both G/R vectors mainly have a YZ component, particularly along the centerline of the molten pool, with the X component noticeably absent. However, the rear end of the molten pool exhibits a distinct behaviour, with the curved molten pool shape resulting in thermal gradient vectors that have dispersed X components. These regions with dispersed thermal gradient vectors promote more pronounced epitaxial grain growth in random directions, inevitably compromising the material texture. This observation provides insights into the gradual enhancement of the texture with increasing VED values. Furthermore, the G/R values are generally higher in the lateral and bottom regions of the molten pool, establishing a favourable environment for epitaxial growth. These insights into the distribution of the G/R ratio contribute to an enhanced understanding of the solidification process and its influence on the microstructural development of the printed material.
3.2. Damage response of defects in crystal plasticity
To further investigate the impact of defects on local damage behaviour, the crystal plasticity finite element method was employed to simulate the internal stresses and strains within the polycrystalline model during stretching. Within the microstructure of LPBF Hastelloy X containing pores, fracture failure may initiate at grain boundaries, twin boundaries, or manufacturing defects. While previous research has established that defects exhibit heightened sensitivity to ductility loss, the primary objective of this key study is to ascertain the specific types of print defects, explore their size effect, and analyze their spatial distribution's impact on cumulative plastic damage.
In this study, microstructures displaying defects will be termed defective models, while those lacking holes will be designated as fully dense microstructures. The pores within the model were generated by removing cells from the grid model, and local mesh refinement was applied in the vicinity around the hole’s center. Specifically, three gradients of pore equivalent diameter were established, using the average grain size (40 μm) as a reference, covering values larger than, smaller than, and close to the average grain size. In this investigation, defect types were categorised as spherical and irregular shapes, with the latter considered as Lack of Fusion (LOF) defects. In the analysis considering the spatial location of the pores, a fixed single pore of 40 μm was primarily integrated into the model. This approach enabled the elimination of the pore-pore interaction effect and the influence of varying pore sizes. Additionally, the positioning of pores was restricted to the main body of the microstructure, thereby preventing any interaction effects between pore boundaries and main structure boundaries. Simulations in this study are based on an ideal microstructure, and residual stresses were not considered in the analysis. This decision is attributed to their negligible impact on crack initiation and the substantial reduction of residual stresses through heat treatment during post-processing.
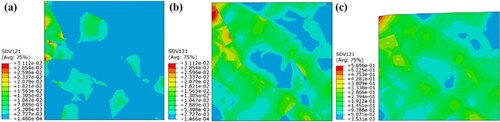
As illustrated in , without defects in the model, the plastic strain accumulates primarily in specific grains with larger Schmid factors, indicating a preference for shear strain along the dislocation slip planes within these grains. As the strain load intensifies, the accumulation of shear strain progresses, resulting in the generation of more dislocations within the grains. This phenomenon gradually forms a ‘shear strain band’ oriented along the 45° direction. Furthermore, the process of grain rotation influences the localisation of the most severe strain, causing a shift in its location within the microstructure. Microcracking occurs when the accumulation of plastic strain reaches a critical level within specific regions of the strain band. This process involves plastic deformation and the initiation of cracks within ductile metallic materials.
Figure 6. Evolution of cumulative plastic strain of defect-free model during loading: (a) 0.5%, (b) 3.4%, (c) 6%.
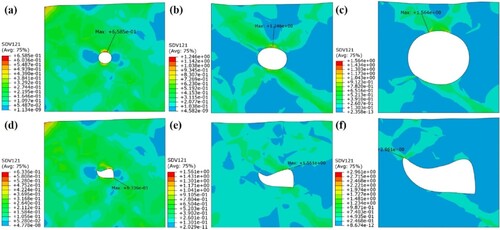
With defects present in the model, the stress–strain response within the polycrystal markedly deviates from that of the fully dense microstructure. Both stress and strain exhibit a preference to concentrate near the defects, forming shear slip bands that align at a 45° angle along the loading direction. This pronounced strain localisation significantly fosters crack initiation and precipitates early fracture of the specimen. However, when the defect size is smaller than the grain size, the influence of the defect on the distribution of cumulative plastic strain decreases, resulting in the emergence of multiple shear slip bands similar to those observed in the fully dense microstructure model. Consequently, the degree of stress concentration is dispersed, and strain localisation is mitigated. As a result, it is reasonable to posit that, in cases where the defect size in the model is sufficiently small, the numerical accumulation of plastic strain in certain slip systems within matrix grains that are distant from the defects may exceed that in the grains proximate to the defects. This behaviour primarily depends on the Schmid factor of these slip systems in the corresponding matrix grains. Notably, primary cracks are expected to manifest and propagate at locations of maximum stress concentration, with secondary cracks potentially forming in the remaining shear zones. However, when the defect size approaches the grain size, a more pronounced accumulation of shear-induced plastic strain occurs in the vicinity of the defect, worsening the inhomogeneous deformation characteristics. Particularly, this inhomogeneous plastic deformation accumulation registers a numerical magnitude approximately one order of magnitude higher compared to the defect size less than the grain size model. The defects hinder the coordinated deformation between grains and disrupt stress transfer within the grains. Conversely, when the defect size exceeds the grain size, the impact of the plastic transfer becomes more significant, resulting in abnormal accumulation of plastic strain within the local region and further intensifying cumulative plastic deformation. As a result, a more significant loss of plasticity in the material is observed. Concerning the defect type, when the defect size is smaller than or similar to the grain size, the difference in plastic strain accumulation between spherical defects and LOF defects is not notably significant. However, once the defect diameter exceeds the grain size, the plastic strain accumulation of LOF defects is roughly twice that of spherical defects. Furthermore, the maximum value of plastic damage shifts from smooth, rounded corners of the defects to sharp corners, indicating that LOF defects have a greater tendency for plastic loss than spherical defects. Additionally, the degree of plastic damage sensitivity of LOF defects is significantly greater than that of spherical defects. Moreover, the initiation of cracks is more likely to occur at the sharp corners of larger-sized defects, thereby leading to early fracture of the samples ().
Figure 7. The cumulative plastic strain distribution of different defect sizes and defect types under 6% strain. (a, d) pore equivalent diameter <40 μm; (b, e) pore equivalent diameter close to 40 μm; (c, f) pore equivalent diameter >40 μm.
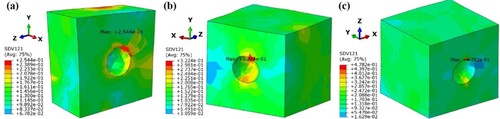
On the contrary, the position of defects significantly influences mechanical properties. illustrates the impact of defects’ spatial location on the distribution of plastic strain accumulation. It is evident that defects located within the material’s interior exhibit relatively small plastic strain accumulation. Conversely, defects on the material’s surface demonstrate more pronounced localised plastic strain accumulation than internal defects. Moreover, variations in shear plastic strain accumulation are observed on different surfaces of the defects. Specifically, the parallel direction of the printing direction plane displays higher shear plastic strain accumulation than the plane perpendicular to the printing direction. This difference is primarily attributed to the fact that the XZ plane exhibits a greater localised accumulation of shear plastic strain in comparison to the perpendicular plane. The reason for this discrepancy lies in the larger grain size and orientation variation on the XZ surface than on the XY surface, leading to a comparatively weaker coordinated deformation capability of the grains on the XZ surface as opposed to the XY surface.
Figure 8. Different defect locations correspond to cumulative plastic strain distribution in the 6% strain state: (a) inside the model; (b) on the XY plane; and (c) on the XZ plane.
3.3. Microstructural defects and mechanical properties
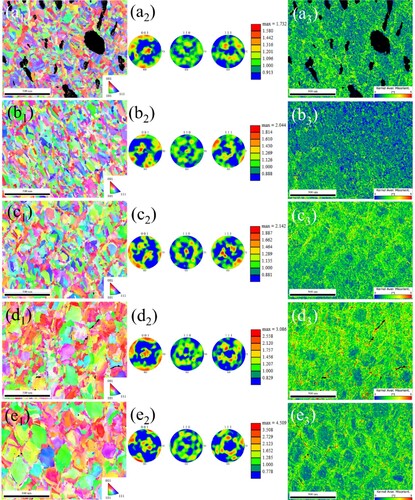
To validate the impact of kinetic mechanisms within the molten pool on microstructural imperfections, a series of LPBF Hastelloy X alloy samples were fabricated using the same process parameters as those employed in the simulation. The combined influence of the printing parameters was assessed by utilising energy input per unit volume. The EBSD results along the vertical printing orientation, achieved at varying laser energy densities, are presented in . The crystallographic structure of FCC was employed for quantifying the diffraction patterns. The three principal crystal directions of FCC, namely <001>, <101>, and <111>, are colour-mapped in red, green, and blue tones on these orientation maps, respectively. In the IPF pattern, the grain configuration mainly displays irregular shapes with a lower occurrence of elongated grains. Remelting of subsequent layers in the cross regions of the laser scan trajectory leads to the formation of small equiaxed grains. Moreover, an increase in laser energy density corresponds to an increase in grain size. The corresponding polar plots for these three observation surfaces are depicted in b. It is noteworthy that, even though the EBSD results within the scanned regions may not precisely capture the ultimate texture of the completed component, the shift in colour patterns of the pole figures can be indicative of the textural alterations between varying vertical energy density fabrication conditions. Prominent crystal texture is discernible in the crystal orientation charts for specimens produced at VEDs, displaying a preponderance of polar densities surpassing 4 M.R.D. (in the context of multiple random distributions). The strengthening of the Goss texture {110}<001> is similarly noted with elevated VEDs, aligning well with the predictions outlined in . This augmentation in Goss texture concurs with its observed prevalence in superalloys and LPBF-fabricated stainless steels, supporting its correlation with specific heat flow directions [Citation34, Citation35]. Conversely, lower VED values reveal crystal orientation characterised by a broader random distribution. In the corresponding Kernel Average Misorientation (KAM) plots, an observable trend is the heightened stress concentration around defects and in cross regions of the scanning trajectory. This stress accentuation becomes more pronounced as VED values increase. Importantly, KAM sensitively reflects the stress concentration at this point, attributed to the inconsistency arising from the LPBF grain growth process. Figure S2 illustrates the distribution of grain boundaries in the EBSD image, where the high-angle grain boundaries (HAGB) are defined by orientation angles exceeding 15°, and the low-angle grain boundaries (LAGB) range from 2° to 15°. Notably, from the EBSD analyses, it is apparent that the variations in VED parameter values exhibit a significant distinction in the LAGB. Simultaneously, the length of HAGB gradually decreases with an increase in the VED value. This observation implies that during the solidification phase, increasing the VED value initiates a decrease in non-uniform nucleation rates, thus promoting grain recrystallization and growth. Specifically, the energy density of 91 J/mm3 emerges as a predominant factor stimulating grain growth and convergence of grain boundaries.
Figure 9. Inverse pole figure, pole figure, and KAM figure perpendicular to the printing direction plane under different laser energy densities: (a) 31 J/mm3, (b) 43 J/mm3, (c) 53 J/mm3, (d) 67 J/mm3, (e) 91 J/mm3.
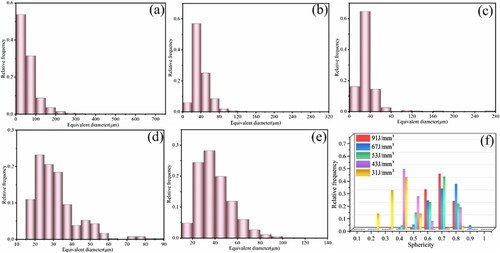
This section involves a comprehensive examination of pore characterisation to gain a deeper understanding of the distribution pattern and its dependence on VED. A thorough evaluation of pore dimensions and shapes in LPBF-fabricated Hastelloy X samples was primarily conducted by extracting XCT dimensional data from each reconstructed pore, as depicted in Figure S3. The distribution of defect-equivalent diameters in samples produced at varying VED values is illustrated in . In samples with higher laser energy density, the majority of pore defects exhibit equivalent diameters ranging between 10 and 40 μm, with over 80% of pore defects having equivalent diameters below 50 μm. Moreover, within the range of VED values from 31 to 43 J/mm3, more than 10% of pore defects were found to have equivalent diameters exceeding 80 μm. This phenomenon can be primarily attributed to the relatively low energy input and incomplete melting during LPBF, resulting in an increased lack of fusion and balling defects, a phenomenon validated by certain LPBF simulation studies [Citation36]. Samples with a nearly fully dense structure exhibit residual pores characterised by equivalent diameters below 40 μm, with an average equivalent pore diameter of 28 μm. Conversely, more than 70% of pores in the 67 J/mm3 samples have equivalent diameters less than 35 μm. The sphericity distributions of pore defects with respect to equivalent diameters are illustrated in f. Notably, in samples subjected to higher laser energy density, the majority of pore defects exhibit equivalent diameters less than 40 μm, accompanied by sphericity values ranging from 0.7 to 0.9. These elevated sphericity values indicate specific characteristics of the gas pore defects. Conversely, specimens produced at relatively lower VED values exhibit a broader range of sphericity distribution from 0.25 to 0.95. In this part, larger defects tend to show smaller sphericity values, reflecting their irregular and elongated nature. The distributions of both sphericity (0.6–0.9) and equivalent diameters gradually narrow as VED values increase, indicating pronounced elemental evaporation and the formation of near-spherical defective pores at elevated VED values, primarily attributed to the full melting of the powder bed.
Figure 10. The relative frequency of the pore defects with a specific equivalent diameter and sphericity within samples fabricated at different laser energy densities: (a) 31 J/mm3, (b) 43 J/mm3, (c) 53 J/mm3, (d) 67 J/mm3, (e) 91 J/mm3, (f) the distribution of the sphericity coefficient
3.4. Processing optimisation
Collectively, the strong correlation between microstructural defects and VED values is evident, emphasised by the temperature gradient within the molten pool and the influence of cooling rate on structural arrangement, as illustrated in . This shift in microstructure is discernible in both and Figure S1, particularly about the changes in dendrite growth direction and the influence of cellular structure size, primarily driven by the G/R ratio. Notably, in the context of nickel-based superalloys, crystal orientation predominantly aligns along with the <001> direction. The distribution of thermal gradient vectors within the liquid phase area, as illustrated in , facilitates the prediction of the effects of distinct process parameters on material fabrication. This predictive capability ultimately emphasises the strengthening of Goss orientation {110}<001> with elevated VED values, as elucidated in .
The crystal plasticity finite element methodology exhibits notable predictive capabilities concerning plastic damage, particularly when factoring in defect characteristics such as location, type, and size. The analysis of manufacturing defect equivalent diameters is presented in . Notably, at a VED value of 31 J/mm3, defect equivalents are significantly larger than the grain size, with defect sphericity primarily below 0.4. As depicted in , computational results emphasise an unusual accumulation of plastic strain in localised regions, magnifying cumulative plastic deformation. This worsens the susceptibility of sharp-edged larger defects to initiate cracks, consequently intensifying severe plastic loss. Beyond the impact of defect diameter, the defect location, especially near-surface defects, exerts a more pronounced influence on localised plastic strain accumulation than internal defects, as delineated in . Owing to the relatively low density of the near-surface curve at this point, enhanced ductility properties are consequently evident.
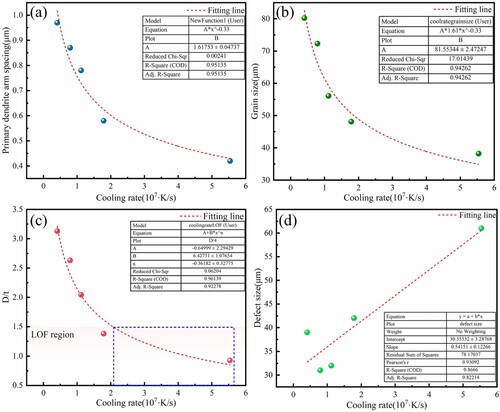
Considering the benefits of employing crystal plasticity and computational fluid dynamics simulations for assessing microstructural defect damage in additively manufactured components, a connection has been established using the intermediary parameter of grain size, primarily influenced by the cooling rate, as illustrated in . The primary dendrite arm spacing data is extracted from Figure S1, grain size is determined through statistical analysis of EBSD results, and the corresponding cooling rate is inferred from the findings presented in . Notably, a clear relationship exists between the cooling rate, primary dendrite arm spacing, and grain size, as indicated by the fitted curves depicted in a, b. To identify LOF defects, the criterion proposed by Johnson [Citation37], D/T < 1.5, is employed, where D represents the molten pool depth, and T is the layer thickness. It is further evident from c that the cooling rate range conducive to LOF defects exceeds 20.84 × 10⁶ K/s. The defect dimensions are determined based on XCT statistical results, revealing a discernible linear correlation between defect size and the cooling rate.
Figure 11. Cooling rate versus primary dendrite arm spacing (a), grain size (b), D/t (c), and (d) defect size.
By integrating the insights derived from crystal plasticity simulations, it is evident that the localised accumulation of plastic strain is less pronounced when the defect size is smaller than the grain size. This observation is substantiated by the critical relationship depicted in . When the cooling rate exceeds 2.6 × 10⁷ K/s, the cumulative plastic strain surpasses 1.24. To account for the influence of unfused defects and avoid rapid failure due to localised stress concentration, the cooling rate should be limited to less than 2.084 × 10⁷ K/s, equivalent to a VED value greater than 43 J/mm³.
Figure 12. Window interval of process optimisation for LPBF Hastelloy X.
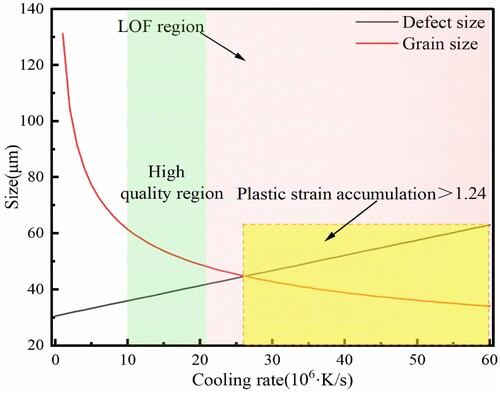
It is important to avoid a low cooling rate to prevent excessive porosity, and excessively high cooling rates are also undesirable. The work of Sanchez [Citation4], Mostafaei [Citation2], and Wang [Citation38] has guided the selection of an upper limit for VED at 53 J/mm³ to mitigate the impact of porosity-type defects. Thus, the optimal processing window in this study falls within the range of 43–53 J/mm³. As illustrated in , the results emphasise the synergistic enhancement of the plasticity of the printed components within this range.
3.5. Model validation
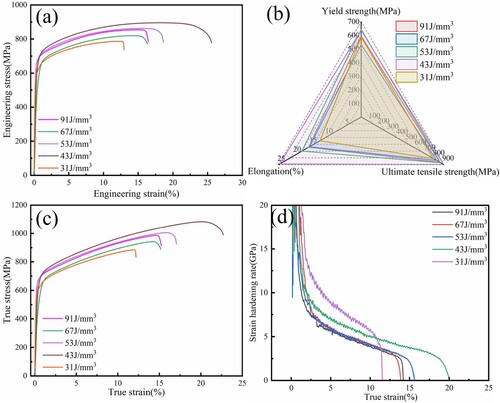
To validate the multi-scale model, tensile tests were conducted on specimens fabricated at varying VED values within the plane perpendicular to the printing direction. The results are displayed in . The tensile properties, including yield strength, tensile strength, and elongation, are thoroughly depicted in b. Observably, the specimens achieve their maximum yield strength at a VED value of 91 J/mm3. However, the peak is reached at 43 J/mm3 in terms of ultimate tensile strength. Indeed, a substantial variance exists in the elongation of specimens prepared at varying VED values compared to their strength. This difference is primarily associated with the density of the specimens. Specifically, the elongation of specimens exceeds 20% for both the 43 and 53 J/mm3 ranges, a crucial factor for maintaining the fracture toughness of superalloys. Conversely, the elongation remains predominantly within the range of 15%–20% for lower VED, lower than that observed in conventionally manufactured specimens. The results in align well with these projections, showing a maximum elongation at a VED value of 43 J/mm3, significantly surpassing other specimens prepared with different parameters. Additionally, Figure S2 confirms that the LAGB represents a substructural boundary with significant misorientation, while the HAGB exhibits a markedly planar nature. During tensile tests, when slip bands cross this substructural boundary, the LAGB exerts a pronounced pinning effect on dislocation motion. It has also been noted that these slip bands can be effectively blocked by the HAGB, indicating substantial dislocation resistance in dealing with stress incompatibility at these boundaries [Citation39]. This observation further clarifies the ability to maintain high yield strength at lower values of VED. The true stress–strain curves show that a lower laser energy density results in a higher strain hardening rate, attributed to the rapid accumulation of geometrically necessary dislocations (GND) at smaller cellular boundaries. Concurrently, research suggests that GND accumulation at grain boundaries necessitates a larger strain, implying a comparatively lower strain hardening rate induced by cellular boundaries than grain boundaries [Citation40]. This could be attributed to the weaker regulation of GND at cellular boundaries compared to grain boundaries. However, it should be noted that the larger size and irregular shape of defects at lower energy densities may introduce additional stress concentrations, accelerating crack initiation and subsequently contributing to rapid specimen failure after necking. This phenomenon also clarifies that the extra strain hardening at lower energy density does not enhance strength, as depicted in d.
Figure 13. Mechanical properties of LPBF Hastelloy X alloy under different laser energy densities: (a) engineering stress-strain curve, (b) mechanical property statistics, (c) true stress-strain curve, and (d) the corresponding strain hardening rate curve.
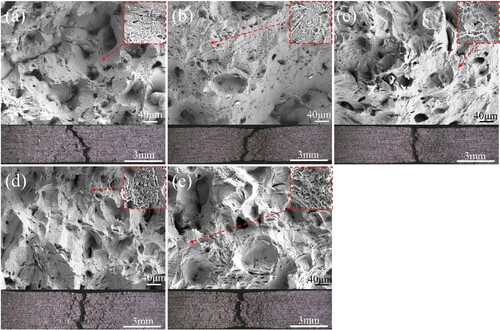
displays the tensile fracture morphology of LPBF Hastelloy X samples prepared using varying fabrication parameters. Notably, the fracture surfaces reveal undulations that correspond to the increased porosity observed in the XCT analyses. At high laser energy densities, micro-porosity becomes discernible on the fracture surfaces of the manufactured components. Among the specimens prepared under diverse conditions, the fracture surfaces consistently manifest indications of brittle damage in the vicinity of ductile microporous accumulations and proximity to the LOF voids. It is noteworthy that crack initiation primarily originates from manufacturing defects.
Figure 14. The frontal and lateral fracture morphology of LPBF Hastelloy X with different laser energy densities: (a) 31 J/mm3, (b) 43 J/mm3, (c) 53 J/mm3, (d) 67 J/mm3, and (e) 91 J/mm3.
Slip evidence becomes prominent along the inner edges of micropores on the fracture surface, particularly at elevated VED values. For the face-centered cubic metal, the active slip and twinning systems are {111}<110> and {111}<112>, respectively. Utilising the fracture EBSD results, the Schmid factors pertinent to plastic slip and deformation twinning of the fracture surface grains are succinctly presented in . Notably, the Schmid factors associated with deformation twinning are lower than the peak value of the plastic slip {111}<110> system in both {111}<112> twinning configurations. This indicates the grains’ preference for complete dislocation slip along the {111}<110> orientation. Concurrently, the slip Schmidt factor gradually decreases with increasing VED values, thereby elevating the critical shear stress for slip. This explains the increased yield strength observed in specimens exposed to high-energy-density conditions.
Table 2. Average Schmid factor results for plastic slip near the cross-section of LPBF Hastelloy X with different laser energy densities.
Numerous investigations have validated the linear influence of solid solution strengthening and grain refinement on the observed yield strength in Hastelloy X specimens produced via LPBF at varying scanning speeds. However, this principle does not apply to specimens with porosity and incomplete fusion defects. Considering that the impact of solid solution strengthening remains relatively consistent across various laser energy densities, the primary factors governing yield strength encompass Taylor hardening (ΔσTaylor) and grain boundary strengthening (Δσgb), as elaborated in the Supplementary Material. Calculations reveal grain boundary strengthening contributions of 142.3 MPa, 126.8 MPa, 117.5 MPa, 103.5 MPa, and 98.3 MPa (in ascending order of VED values) while corresponding contributions from Taylor hardening are 135.7 MPa, 163.2 MPa, 158.6 MPa, 145.1 MPa, and 168.4 MPa (also in ascending order of VED values). Notably, at laser energy densities of 43 and 53 J/mm3, ΔσTaylor, and Δσgb exert the most substantial influence on yield strength, corroborating the higher yield strengths achieved within this process. This further corroborates that the optimal trade-off between strength and plasticity can be achieved in this process.
3. Conclusions
In the present work, an integrated multiscale simulation was conducted to investigate the dynamic evolution process within the molten pool of LPBF Hastelloy X alloy, considering various values of VED. The research explored the impact of manufacturing defects on plastic damage through the utilisation of crystal plasticity. The quasi-quantification of process optimisation is introduced, relying on the thermal field and crystal plasticity. The main findings are drawn as follows:
The lifetime of the liquid phase increased with higher VED values. resulting in a wider temperature spread and reaching higher maximum values. The temperature difference within the molten pool increased with VED, while the cooling rate decreased. At the trailing section of the molten pool, the shape caused uneven temperature distribution, leading to less ordered grain orientation and reduced material texture.
Shear-induced plastic strain accumulation is observed near manufacturing defects, especially larger defects. Irregular defects, such as lack of fusion, have a stronger impact on strain localisation when their size is similar to or larger than the average grain size. Surface defects have a more noticeable effect on localised plastic strain accumulation compared to internal defects.
The optimal processing range, guided by the fusion of crystal plasticity and computational fluid dynamics simulation, spans from 43 to 53 J/mm3. Within this interval, the material exhibits remarkable properties, with a maximum strength of 895 MPa and an elongation of 25%. The advantageous contributions of Taylor hardening and grain boundary strengthening are prominently observed.
Supplemental Material
Download MS Word (4 MB)Disclosure statement
No potential conflict of interest was reported by the author(s).
Data availability statement
Data will be available upon reasonable request.
Correction Statement
This article has been corrected with minor changes. These changes do not impact the academic content of the article.
Additional information
Funding
References
- DebRoy T, Wei HL, Zuback JS, et al. Additive manufacturing of metallic components – process, structure and properties. Prog Mater Sci. 2018;92:112–224. doi:10.1016/j.pmatsci.2017.10.001
- Mostafaei A, Ghiaasiaan R, Ho IT, et al. Additive manufacturing of nickel-based superalloys: A state-of-the-art review on process-structure-defect-property relationship. Prog Mater Sci. 2023;136:101108. doi:10.1016/j.pmatsci.2023.101108
- Akande IG, Oluwole OO, Fayomi OSI, et al. Overview of mechanical, microstructural, oxidation properties and high-temperature applications of superalloys. Mater Today Proc. 2021;43:2222–2231. doi:10.1016/j.matpr.2020.12.523
- Sanchez S, Smith P, Xu Z, et al. Powder bed fusion of nickel-based superalloys: a review. Int J Machine Tools Manuf. 2021;165:103729. doi:10.1016/j.ijmachtools.2021.103729
- Xie Y, Teng Q, Shen M, et al. The role of overlap region width in multi-laser powder bed fusion of Hastelloy X superalloy. Virtual Phys Prototyp. 2023;18(1):e2142802. doi:10.1080/17452759.2022.2142802
- Yuan W, Chen H, Cheng T, et al. Effects of laser scanning speeds on different states of the molten pool during selective laser melting: simulation and experiment. Mater Des. 2020;189:108542. doi:10.1016/j.matdes.2020.108542
- He X, Kong D, Zhou Y, et al. Powder recycling effects on porosity development and mechanical properties of Hastelloy X alloy during laser powder bed fusion process. Addit Manuf. 2022;55:102840. doi:10.1016/j.addma.2022.102840
- Sanaei N, Fatemi A. Defects in additive manufactured metals and their effect on fatigue performance: a state-of-the-art review. Prog Mater Sci. 2021;117:100724. doi:10.1016/j.pmatsci.2020.100724
- Pourbabak S, Montero-Sistiaga ML, Schryvers D, et al. Microscopic investigation of as built and hot isostatic pressed Hastelloy X processed by selective laser melting. Mater Charact. 2019;153:366–371. doi:10.1016/j.matchar.2019.05.024
- He X, Wang L, Kong D, et al. Recrystallization effect on surface passivation of Hastelloy X alloy fabricated by laser powder bed fusion. J Mater Sci Technol. 2023;163:245–258. doi:https://doi.org/10.1016/j.jmst.2023.06.003.
- Sabzi HE, Maeng S, Liang X, et al. Controlling crack formation and porosity in laser powder bed fusion: alloy design and process optimisation. Addit Manuf. 2020;34:101360. doi:10.1016/j.addma.2020.101360
- Yu C, Chen N, Li R, et al. Selective laser melting of GH3536 superalloy: microstructure, mechanical properties, and hydrocyclone manufacturing. Adv Powder Mater. 2023: 100134. doi:10.1016/j.apmate.2023.100134
- Ye C, Zhang C, Zhao J, et al. Effects of post-processing on the surface finish, porosity, residual stresses, and fatigue performance of additive manufactured metals: a review. J Mater Eng Perform. 2021;30(9):6407–6425. doi:10.1007/s11665-021-06021-7
- Zhang W, Zheng Y, Liu F, et al. Effect of solution temperature on the microstructure and mechanical properties of Hastelloy X superalloy fabricated by laser directed energy deposition. Mater Sci Eng A. 2021;820:141537. doi:10.1016/j.msea.2021.141537
- Lehmann T, Rose D, Ranjbar E, et al. Large-scale metal additive manufacturing: a holistic review of the state of the art and challenges. Int Mater Rev. 2021;67(4):410–459. doi:10.1080/09506608.2021.1971427
- Wu S, Hu Y, Yang B, et al. Review on defect characterization and structural integrity assessment method of additively manufactured materials. J Mech Eng. 2021;57(22):3–34. doi:10.3901/JME.2021.22.003
- Keller C, Mokhtari M, Vieille B, et al. Influence of a rescanning strategy with different laser powers on the microstructure and mechanical properties of Hastelloy X elaborated by powder bed fusion. Mater Sci Eng A. 2021;803:140474. doi:10.1016/j.msea.2020.140474
- Keshavarzkermani A, Marzbanrad E, Esmaeilizadeh R, et al. An investigation into the effect of process parameters on melt pool geometry, cell spacing, and grain refinement during laser powder bed fusion. Optics & Laser Technol. 2019;116:83–91. doi:10.1016/j.optlastec.2019.03.012
- Watring DS, Benzing JT, Hrabe N, et al. Effects of laser-energy density and build orientation on the structure-property relationships in as-built Inconel 718 manufactured by laser powder bed fusion. Addit Manuf. 2020;36:101425. doi:10.1016/j.addma.2020.101425
- Xiao H, Liu X, Xiao W, et al. Influence of molten-pool cooling rate on solidification structure and mechanical property of laser additive manufactured Inconel 718. J Mater Res Technol. 2022;19:4404–4416. doi:10.1016/j.jmrt.2022.06.162
- Wang J, Zhu R, Liu Y, et al. Understanding melt pool characteristics in laser powder bed fusion: An overview of single- and multi-track melt pools for process optimization. Adv Powder Mater. 2023;2(4):100137. doi:10.1016/j.apmate.2023.100137
- Li Z, Deng Y, Yao B, et al. Effect of laser scan speed on pool size and densification of selective laser melted CoCr alloy under constant laser energy density. Laser Optoelectronics Progress. 2022;59(7):0736001. doi:10.3788/LOP202259.0736001
- Zhang J, Yuan W, Song B, et al. Towards understanding metallurgical defect formation of selective laser melted wrought aluminum alloys. Adv Powder Mater. 2022;1(4):100035. doi:10.1016/j.apmate.2022.100035
- Rui H, Meiping W, Chen C, et al. Effects of laser energy density on microstructure and corrosion resistance of FeCrNiMnAl high entropy alloy coating. Optics & Laser Technol. 2022;152:108188. doi:https://doi.org/10.1016/j.optlastec.2022.108188.
- Zhao Y, Sun W, Wang Q, et al. Effect of beam energy density characteristics on microstructure and mechanical properties of nickel-based alloys manufactured by laser directed energy deposition. J Mater Process Technol. 2023;319:118074. doi:10.1016/j.jmatprotec.2023.118074
- Tan P, Zhou M, Tang C, et al. Multiphysics modelling of powder bed fusion for polymers. Virtual Phys Prototyp. 2023;18(1):e2257191. doi:10.1080/17452759.2023.2257191
- Tan P, Shen F, Shian Tey W, et al. A numerical study on the packing quality of fibre/polymer composite powder for powder bed fusion additive manufacturing. Virtual Phys Prototyp. 2021;16(sup1):S1–S18. doi:10.1080/17452759.2021.1922965
- Kusano M, Watanabe M. Microstructure control of Hastelloy X by geometry-induced elevation of sample temperature during a laser powder bed fusion process. Mater Des. 2022;222:111016. doi:10.1016/j.matdes.2022.111016
- Lee YS, Zhang W. Modeling of heat transfer, fluid flow and solidification microstructure of nickel-base superalloy fabricated by laser powder bed fusion. Addit Manuf. 2016;12:178–188. doi:10.1016/j.addma.2016.05.003
- Lv F, Liang HX, Xie DQ, et al. On the role of laser in situ re-melting into pore elimination of Ti-6Al-4V components fabricated by selective laser melting. J Alloys Compd. 2021;854:156866. doi:10.1016/j.jallcom.2020.156866
- Prithivirajan V, Sangid MD. The role of defects and critical pore size analysis in the fatigue response of additively manufactured IN718 via crystal plasticity. Mater Des. 2018;150:139–153. doi:10.1016/j.matdes.2018.04.022
- Huang Y. A user-material subroutine incroporating single crystal plasticity in the ABAQUS finite element program. Cambridge: Harvard University Press; 1991.
- Pilgar CM, Fernandez AM, Lucarini S, et al. Effect of printing direction and thickness on the mechanical behavior of SLM fabricated Hastelloy-X. Int J Plasticity. 2022;153:103250. doi:10.1016/j.ijplas.2022.103250
- Garlea E, Choo H, Sluss CC, et al. Variation of elastic mechanical properties with texture, porosity, and defect characteristics in laser powder bed fusion 316L stainless steel. Mater Sci Eng A. 2019;763:138032. doi:10.1016/j.msea.2019.138032
- Sanchez-Mata O, Wang X, Muñiz-Lerma JA, et al. Dependence of mechanical properties on crystallographic orientation in nickel-based superalloy Hastelloy X fabricated by laser powder bed fusion. J Alloys Compd. 2021;865:158868. doi:10.1016/j.jallcom.2021.158868
- Gu H, Wei C, Li L, et al. Multi-physics modelling of molten pool development and track formation in multi-track, multi-layer and multi-material selective laser melting. Int J Heat Mass Transf. 2020;151:119458. doi:10.1016/j.ijheatmasstransfer.2020.119458
- Johnson L, Mahmoudi M, Zhang B, et al. Assessing printability maps in additive manufacturing of metal alloys. Acta Mater. 2019;176:199–210. doi:10.1016/j.actamat.2019.07.005
- Wang S, Ning J, Zhu L, et al. Role of porosity defects in metal 3D printing: formation mechanisms, impacts on properties and mitigation strategies. Mater Today. 2022;59:133–160. doi:10.1016/j.mattod.2022.08.014
- Guo Y, Collins DM, Tarleton E, et al. Measurements of stress fields near a grain boundary: exploring blocked arrays of dislocations in 3D. Acta Mater. 2015;96:229–236. doi:10.1016/j.actamat.2015.05.041
- Kong D, Dong C, Ni X, et al. Hetero-deformation-induced stress in additively manufactured 316L stainless steel. Mater Res Lett. 2020;8(10):390–397. doi:10.1080/21663831.2020.1775149