
 ?Mathematical formulae have been encoded as MathML and are displayed in this HTML version using MathJax in order to improve their display. Uncheck the box to turn MathJax off. This feature requires Javascript. Click on a formula to zoom.
ABSTRACT
Synchrotron X-ray imaging has been utilised to detect the dynamic behaviour of molten pools during the metal additive manufacturing (AM) process, where a substantial amount of imaging data is generated. Here, we develop an efficient and robust deep learning model, AM-SegNet, for segmenting and quantifying high-resolution X-ray images and prepare a large-scale database consisting of over 10,000 pixel-labelled images for model training and testing. AM-SegNet incorporates a lightweight convolution block and a customised attention mechanism, capable of performing semantic segmentation with high accuracy (∼96%) and processing speed (< 4 ms per frame). The segmentation results can be used for quantification and multi-modal correlation analysis of critical features (e.g. keyholes and pores). Additionally, the application of AM-SegNet to other advanced manufacturing processes is demonstrated. The proposed method will enable end-users in the manufacturing and imaging domains to accelerate data processing from collection to analytics, and provide insights into the processes’ governing physics.
1. Introduction
Laser additive manufacturing (AM), such as laser powder bed fusion (LPBF) [Citation1–2] and directed energy deposition (DED) [Citation3–4], has attracted a great deal of interest from both academia and industry, offering extraordinary advantages over traditional manufacturing methods. However, some features, e.g. lack of fusion [Citation5,Citation6] and residual porosity [Citation7–9], restrict its application in the manufacturing of safety-sensitive components. With the development of synchrotron facilities, it has been possible to exploit in situ high-speed X-ray imaging to gain insights into the complex physical phenomena during the AM process [Citation10–12], such as powder melting and solidification, keyhole fluctuation, as well as defect formation. The dynamic behaviour of melt pool and critical features have been studied and revealed using synchrotron imaging results. For example, power-velocity process maps [e.g. Citation13–15] have been defined to directly relate the product quality, e.g. porosity, to the process parameters in LPBF experiments.
Generally, in situ synchrotron experiments are performed at ultra-high temporal and spatial resolutions [Citation16,Citation17], thus generating a large volume of X-ray imaging data and making manual data processing time-consuming and impractical. In this case, it becomes essential to propose an efficient and reliable approach to performing image segmentation and analysis. For example, an automatic detection algorithm [Citation18] involving quotient, intensity difference calculations, and numerical shaping was proposed to detect the melt pool boundaries during the LPBF process of aluminium alloys. Apart from the melt pool boundary, it is of great importance to identify and classify the component defects in an efficient and reliable manner. Recently, machine learning techniques, such as support vector machine [Citation19,Citation20], Bayesian classifier [Citation21] and K-means clustering [Citation8,Citation22,Citation23], have been applied for the detection and classification of manufacturing defects in metal AM processes. Due to the stochastic nature of melt pool dynamics, it is challenging for traditional machine learning approaches to provide accurate and reliable detection results.
With the rapid advances in computational resources, deep learning methods, especially convolutional neural networks (CNN), are starting to play an important role in the monitoring and quantification of surface defects and other critical features during metal AM processes. For example, CNN models have been used for porosity detection [Citation24], anomaly monitoring [Citation25], and surface quality improvement [Citation26], etc. However, these studies focus on optical or acoustic signals rather than in situ X-ray imaging results, failing to reveal the dynamic behaviour beneath the component surface. On the other hand, pixel-wise segmentation models, such as U-Net [Citation27] and its variants [Citation28,Citation29], have been used to perform semantic segmentation on synchrotron X-ray images [Citation30,Citation31]. For example, an automatic deep learning segmentation model using U-Net was proposed for the segmentation and annotation of melt pools [Citation32]. However, the U-Net and its variants exhibit complicated model architectures and high latency, restricting their potential applications in real-time detection and monitoring of the AM processes. Moreover, the diversity of X-ray image datasets used in existing studies is limited, as these datasets only cover a single synchrotron facility, Advanced Photon Source [Citation30–32] and three materials, including Ti-6Al-4V [Citation30], aluminium alloy [Citation30–32]. As a result, the trained segmentation models are not generalisable for a range of manufacturing processes, process parameters, materials, and synchrotron facilities, e.g. beam energy, insertion devices, etc. The attempt to create a generalisable machine-learning (ML) segmentation model for AM X-ray images has not been explored yet. Lastly, none of the existing models can provide direct quantification results which is an unexplored area.
In this study, we develop a novel generalised lightweight neural network, AM-SegNet, to perform semantic segmentation and feature quantification on time-series X-ray images collected from various AM beamtime experiments. For the comprehensive model training and testing, we have established a large-scale benchmark database consisting of more than 10,000 pixel-labelled X-ray images. Experimental results indicate that AM-SegNet outperforms other state-of-the-art segmentation models in terms of accuracy, speed and robustness. A well-trained AM-SegNet has been adopted to expedite the quantification of critical features and conduct correlation analysis in the LPBF experiments. The accuracy and efficiency of AM-SegNet are further validated across different types of AM experiments, and for another advanced manufacturing technique, high-pressure die casting (HPDC) [Citation33], making it closer to achieving real-time automatic segmentation and quantification of X-ray images captured by high-speed synchrotron experiments.
2. Methodology
2.1. Architecture of AM-Segnet
To expedite the segmentation and quantification of X-ray images collected from high-speed synchrotron experiments, we propose a novel lightweight network AM-SegNet (see (a)) with the purpose of improving computation efficiency and segmentation speed without compromising model performance. The AM-SegNet adopts an encoder-decoder architecture in which a customised lightweight convolution block (see (b)) and the attention mechanism (see (c)) are utilised.
Figure 1. Schematic workflow of AM-SegNet designed for automatic segmentation and quantification of high-resolution X-ray images: (a) the architecture of AM-SegNet using a lightweight convolution block and attention mechanism: Hn × Wn correspond to the input sizes in different layers, and Hn = H0/2n and Wn = W0/2n, where H0 and W0 refer to the size of raw X-ray images; (b) structure of the lightweight convolution block based on separable convolution, residual convolution, and squeeze-expand operations; and (c) structure of the attention mechanism adopted in the standard convolution layers.
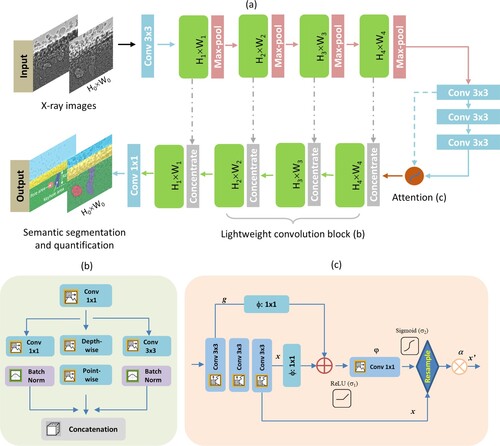
The lightweight convolution block begins with a squeeze convolution layer (1 × 1 kernels) that limits the number of input channels, denoted as n1, to be processed by the following expand module. The expand module includes: (1) separable convolutions, (2) residual convolution with 1 × 1 kernels and (3) expand convolution with 3 × 3 kernels. Specifically, separable convolution decomposes a regular convolution operation into two separate steps: depth-wise convolution and point-wise convolution. Depth-wise convolution applies a single filter to individual input channels, bringing about a feature map for each input channel separately. All the resulting feature maps are concatenated into a single output tensor and processed by the following point-wise convolution with 1 × 1 filters. Three sets of outputs from the expand layer are concatenated in the concatenation layer, increasing the channel number from n1 to 4 × n1. The capability and efficiency of such squeeze-expand operations has been successfully validated in the task of image classification and defect detection [Citation34]. In the last encoder step, standard convolutional layers are retained in order to ensure the model’s robustness and generalisation and mitigate over-fitting problems.
For better model sensitivity and higher segmentation accuracy, the attention mechanism [Citation35,Citation36] has been introduced to deep neural networks. It has been found that attention gates can help to disambiguate irrelevant and noisy responses and update the model parameters based on spatial regions that are more relevant to the given task. Inspired by this, a customised attention gate is proposed in this study (see (c)). The purpose is to highlight the salient features in the last encoding stage without consuming excessive computation resources. The output x’ after the attention gate can be updated by attention coefficient α, given by:
(1)
(1)
(2)
(2) where
and
are linear transformations implemented as 1 × 1 convolutions, and σ1 and σ2 refer to ReLU (Rectified Linear Unit) and sigmoid activations, respectively. Here, the ReLU function outputs the input for positive values and zero for negative values, while the sigmoid function transforms input values into a smooth S-shaped curve, mapping them to a range from 0 to 1.
In this study, AM-SegNet is proposed to perform semantic segmentation on synchrotron X-ray images. Semantic segmentation results can provide detailed understanding and analysis by assigning a specific label to each pixel within the image. Once a well-trained AM-SegNet is ready, it will be feasible to perform feature quantification and correlation with high confidence, minimising the time-consuming and subjective problems related to manual analysis.
2.2. Benchmark dataset
In this study, we build a large-scale benchmark database for model training and testing. The database encompasses a broad range of synchrotron experiments, incorporating various synchrotron beamlines, powder materials and process parameters. Details of synchrotron beamlines and X-ray imaging settings are available in Section 2.3. As a result, it can be utilised by other researchers to benchmark their models’ performance against others and to develop novel algorithms or techniques for image segmentation in this domain.
(a) presents the pipeline of semantic pixel-labelling of X-ray images, in which flat field correction, background subtraction, image cropping and pixel labelling are executed step by step. Here, background subtraction will be applied only if it is difficult to segment the regions of interest from raw X-ray images. In the pixel-labelling stage, each pixel in the image has its own corresponding pixel label, i.e. keyhole, pore, substrate, background or powder. (b) presents some examples of manually pixel-labelled X-ray images, which are used as ground-truth in the following model training and testing steps. Additionally, more in situ synchrotron imaging data from recent studies [Citation8,Citation11,Citation13] are incorporated into the benchmark database in order to improve its universality and generalisation. In the end, a variety of metal materials, process parameters and synchrotron beamlines are covered by the benchmark database, as listed in . We have also used random cropping – a data augmentation technique to minimise over-fitting and class-imbalance issues during model training. For data augmentation, a random 10% of X-ray images are selected and cropped. Then the newly-generated images are added to the benchmark database to further improve data diversity and generalisation.
Figure 2. X-ray imaging benchmark database for model training and testing: (a) pipeline of image processing, including: flat field correction, background subtraction, image cropping, and pixel labelling; (b) examples of manually pixel-wise labelled X-ray images collected from LPBF and welding experiments; (c) distributions of X-ray images related to different substrate and powder materials; and (d) percentages of individual pixel labels in the benchmark database.
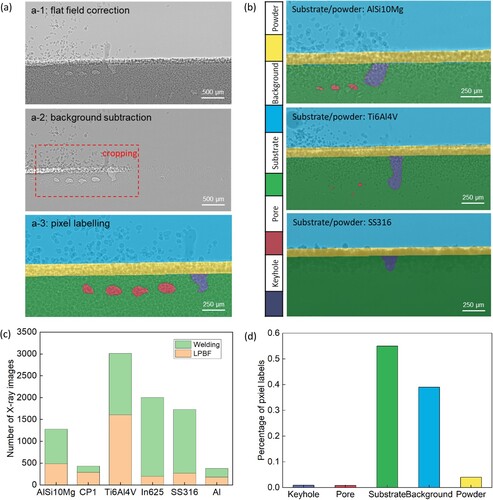
Table 1. Synchrotron facilities, metal materials, and process parameters during LPBF and welding synchrotron experiments covered by the benchmark database
(c,d) present the distributions of X-ray images and pixel labels in the benchmark database related to LPBF and welding processes. It can be found that the percentages of two critical features, keyhole and pore, are significantly lower than the other three. Therefore, class weighting will be applied for balancing in the training of AM-SegNet and other CNN models. During the preparation of the benchmark database, some simplification operations are adopted, which can introduce minor errors to the ground-truth pixel labels. For example, the spatter ejected from the melt pool during laser scanning is treated as background and the gaps between large powder particles are ignored. These errors only occur in a few cases and do not affect the overall accuracy and reliability of pixel-labelling results in the benchmark database. Furthermore, X-ray imaging results collected during DED and HPDC experiments were subsequently added to the database and utilised in Section 3.3 to demonstrate the extended application of AM-SegNet in different advanced manufacturing processes.
2.3. Synchrotron beamlines and imaging settings
In this study, the benchmark database consists of over 10,000 X-ray images collected from various AM beamtime experiments, involving three synchrotron beamlines:
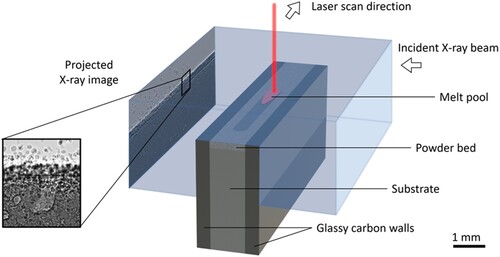
European Synchrotron Radiation Facility (ESRF): In situ operando synchrotron imaging of LPBF and welding experiments (see ) was performed at ESRF, and the in situ X-ray imaging setup is illustrated in . The dynamic behaviour of molten pool and relevant critical features was imaged at high spatial (4.31 µm) and temporal (frame rate of 40 kHz) resolutions. Synchrotron experiments were carried out using a custom-designed replicator [Citation8,Citation10], which can provide an environmental chamber to accommodate laser scanning and synchrotron X-ray imaging at the same time.
Diamond Light Source (DLS): The fast synchrotron imaging of DED experiments was conducted on the DLS I12 beamline. A replicator of the DED process was integrated with the beamline for in situ synchrotron X-ray experiments. Radiographic images were obtained with a pixel size of 6.67 μm at a frame rate of 1 kHz.
Advanced Photon Source (APS): This study utilises published X-ray imaging data [Citation11,Citation13] from other synchrotron experiments to validate the segmentation performance of AM-SegNet. The relevant synchrotron experiments were performed at APS 32-ID-B beamline in the Argonne National Laboratory. Operando X-ray imaging data were collected with a frame rate of 50 kHz and a spatial resolution of ∼2.0 μm/pixel.
Figure 3. In situ X-ray imaging setup for capturing time-series radiographs during LPBF synchrotron experiments performed at ESRF. X-ray imaging was performed at high spatial (4.31 µm/pixel) and temporal (frame rate of 40 kHz) resolutions.
3. Results and discussion
3.1. Model training and testing
In this study, AM-SegNet and other widely used CNN models, i.e. U-Net and its variants (Res-U-Net and Squeeze-U-Net), are trained and evaluated. In the variants of U-Net, the standard convolution layer is substituted with an equivalent convolution block, e.g. the residual block [Citation37,Citation38] in Res-U-Net. Additionally, access to source codes for AM-SegNet and other CNN models is provided in Codes and Videos. In this study, all the CNN models are developed in TensorFlow, and model training and evaluation are carried out on a Windows workstation with an AMD CPU (3975WX, 3.5 GHz) and an NVIDIA GPU (RTX A6000, 48 GB). For model tuning, X-ray images obtained from different synchrotron experiments are randomly divided into training, testing and validation datasets with a ratio of 4:1:1.
In general, a large learning rate enables the model to learn faster but brings with it a risk of sub-optimal results [Citation39]. When the learning rate becomes smaller, the convergence speed becomes lower in the initial stage, and it takes a longer time to reach the stable stage. To achieve a smooth learning process, we adopt a novel training strategy of learning rate scheduling, called annealing learning [Citation40,Citation41], to automatically anneal the learning rate during the training process. In the early stage of network training, a higher learning rate, e.g. 1 × 10⁻³, is used to allow the model to explore a larger portion of the parameter space and embrace a higher convergence speed. However, as the training progresses and the model gets closer to its optimal solution, a lower learning rate is adopted for the further fine-tuning of model parameters. In this section, all the segmentation models are trained for 100 epochs with an initial learning rate of 1 × 10⁻³ and a batch size of 16 using the Adam solver [Citation42,Citation43]. In the model compile, the Dice loss and Categorical Focal Loss are combined to measure the model loss [Citation44], and the F1-score and Jaccard index, also known as Intersection over Union (IoU), are selected as model metrics [Citation45,Citation46]. Here, the loss function is designed to help address the issue of class imbalance, as it can lead the model to achieve better discrimination between foreground and background classes. Additionally, the IoU score serves as a key metric for evaluating the quality of segmentation results by accounting for localisation accuracy, handling class imbalance and enabling fair comparisons. The relevant results of model training and testing are presented in . The training and testing of different segmentation models are repeated 20 times and the average values are calculated for further comparison and analysis.
Figure 4. Training and testing of five different CNN semantic segmentation models for X-ray images: (a) comparison analysis of training and segmentation time related to different models; (b) transition process of mean IoU scores over training time; (c) comparison of mean IoU values within specified training duration; and (d) comparison between AM-SegNet and standard U-Net in terms of IoU values of individual pixel labels after model training. All IoU scores related to AM-SegNet are higher, especially those of keyhole and pore.
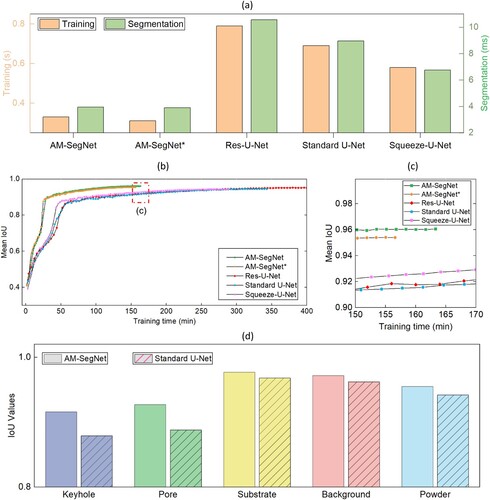
presents the training and testing results of different CNN models for semantic segmentation of X-ray images. (a) focuses on the model’s computation efficiency, in which AM-SegNet realises the shortest training and segmentation time compared with U-Net and its variants. As a result, AM-SegNet is the first one to finish the whole training process when the maximum training epoch is set to be the same (see (b)). Here, the segmentation time refers to the time taken by a CNN model to generate segmentation results after an input image is fed into the network. On the other hand, the training time is related to the iteration process when the neural network computes the network error and adjusts its weights and biases accordingly to minimise the loss function. Specifically, the minimal training and segmentation time associated with AM-SegNet indicates that the lightweight convolutional block proposed in this study can bring about remarkable computation efficiency and propagation speed. Compared with the standard U-Net, both training and segmentation time is reduced by around 50%. When it comes to the IoU scores of individual pixel labels, the model testing results (see (d)) indicate that AM-SegNet is able to produce reliable segmentation results for two critical features, i.e. keyhole and pore, while the IoU scores related to the standard U-Net drop considerably. Ablative analysis was performed to clarify the impacts of the customised attention block on the AM-SegNet. AM-SegNet* is developed in which the attention block was removed from the AM-SegNet architecture. The comparison results (see ) indicate that the attention block improves the model’s accuracy and robustness. The segmentation time and trainable parameters of the two models are very close, as listed in , which means the usage of the attention block does not consume excessive computation resources.
Table 2. Comparison of different segmentation models
lists the numbers of trainable parameters related to different segmentation models. It can be found that AM-SegNet* has the smallest number (1.63 × 10⁷), which should be attributed to its lightweight design. Besides, the influence of adding the attention block to AM-SegNet on the trainable parameters is negligible whilst improving the F1 and IoU scores. Comparing AM-SegNet and another lightweight model – Squeeze-U-Net, both models have similar trainable parameters, however AM-SegNet can provide higher segmentation accuracy while reducing the segmentation time by more than 40%.
Additionally, the Grad-CAM (gradient-weighted class activation mapping) [Citation47,Citation48] technique is adopted for interpreting and visualising the decision mechanism of AM-SegNet after model tuning. It computes the gradient of the output class score with respect to the feature maps of the specific convolutional layer in a CNN model. The resulting gradients are then used to generate a weighted activation map, highlighting the regions of the image that make great contributions to the network's decision. Here, we present Grad-CAM results related to the pixel labels of keyhole and pore to examine the network responses of the AM-SegNet after model tuning (see (a)). The blue regime corresponds to a condition of low influence, whereas the red regime indicates high impact. For example, the red zones in (a) have the greatest impact on classifying the relevant image pixels as keyhole or pore, which agrees well with the ground truth and thereby indicates excellent segmentation performance.
Figure 5. Examination and application of the trained AM-SegNet: (a) Grad-CAM results of keyhole and pore associated with the trained AM-SegNet. The blue regime corresponds to a condition of low influence, whereas the red regime indicates high impact; and (b) comparison between ground-truth and AM-SegNet segmentation results of time-series X-ray images in the LPBF experiments.
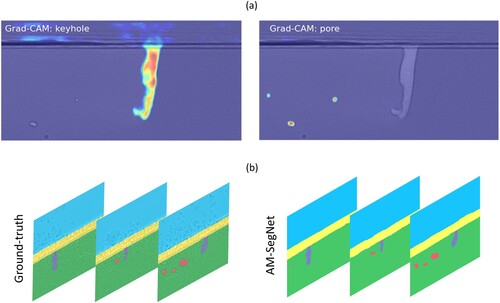
Overall, the AM-SegNet proposed in this study can perform semantic segmentation on X-ray images with excellent accuracy and processing speed. A well-trained AM-SegNet has been utilised to perform segmentation analysis on time-series X-ray images in the LPBF experiments (see (b) and Supplementary Video S1 in Codes and Videos). Moreover, the segmentation results will be used for automatic quantification and correlation analysis in the next section.
3.2. Feature quantification and correlation
After a well-trained AM-SegNet is obtained, the process of carrying out feature quantification and correlation analysis using synchrotron imaging results is considerably streamlined. For example, AM-SegNet can be employed to automatically compute the geometric properties of two critical features, i.e. the keyhole and pores, within the molten pool region in the LPBF experiments. The keyhole refers to a deep, high aspect ratio vapour depression, which plays an important role in the melt pool region [Citation13,Citation49]. For example, the fluctuation and collapse of keyhole are closely related to the pore evolution, e.g. formation, growth and migration, potentially impacting the fatigue life of metal components. Therefore, after a well-trained AM-SegNet is obtained, the model will be employed to carry out quantification and correlation analysis of these two critical features within the melt pool region in the LPBF experiments.
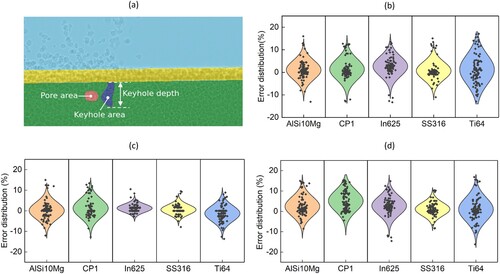
In this study, the geometrical properties of keyholes and pores are calculated pixel by pixel using semantic segmentation results from AM-SegNet, including keyhole area (Ak), keyhole depth (dk) and pore area (Ap), as shown in (a). Additionally, the distribution of quantification errors associated with Ak is given in (b). Here, each individual metal material has its corresponding 100 X-ray images for quantification tests and the calculation results are then compared with the ground truth to compute quantification errors. The quantification errors related to other geometric properties, i.e. dk and Ap, are presented in (c,d), respectively. The experimental results indicate that employing AM-SegNet to replace manual operations for feature quantification is feasible, as it is capable of presenting quantification results in an efficient and accurate manner.
Figure 6. Quantification of critical features in LPBF X-ray images using the trained AM-SegNet: (a) calculation of keyhole and pore geometry; (b) quantification errors of keyhole area (Ak) related to different materials; (c) quantification errors of keyhole depth (dk) related to different materials; and (d) quantification errors of pore area (Ap) related to different materials.
It has been reported that pore formation is closely related to keyhole fluctuations in the LPBF process [Citation7,Citation8]. This finding is consistent with the comparison results in (a,b), which present the histograms of keyhole areas in two LPBF experiments with and without pore formation, respectively. Comparing these two histograms provides an intuitive way to reveal the distribution of keyhole area across different intervals. The histogram with outliers and a high degree of variance (see (b)) is connected to the LPBF process with pore formation. Furthermore, leveraging the quantification results from AM-SegNet enables us to correlate keyhole fluctuation with pore formation from a statistical perspective. (c,d) depict the mapping relationships between keyhole deviations and pore formation. The size of pink bubbles corresponds to the pore size (equivalent diameter) segmented from X-ray images. Here, the fluctuations of keyholes (Ak and dk) in time-series X-ray imaging are measured using δmax and δavg, which correspond to the maximum and average deviations of keyholes under different experimental conditions. For example, the deviation δ of keyhole area (Ak) can be given by:
(3)
(3)
(4)
(4) where i and n are the sequence of the current image and the total number of all X-ray images, respectively. Additionally, the equivalent diameter
of a segmented pore is calculated by:
(5)
(5) where Ap is the pore area segmented from the X-ray image.
Figure 7. Correlative analysis of critical features in LPBF X-ray images using AM-SegNet: (a) histogram of keyhole areas in an LPBF experiment without pores; (b) histogram of keyhole areas in an LPBF experiment with segmented pores; (c) correlation mapping between pore formation and deviations of keyhole area; and (d) correlation mapping between pore formation and deviations of both keyhole area and depth.
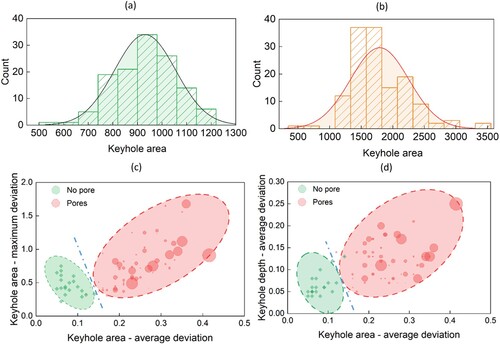
Here, X-ray imaging results from 81 sets of LPBF experiments are used for correlative mapping analysis, with pores being detected in 60 experimental sets. The average and maximum deviations of keyhole area are analysed in (c), while (d) takes both keyhole area and depth into consideration (average deviations only). The data points in both scenarios, i.e. with and without pore formation, exhibit a strong clustering effect, represented by ellipses of varying colours and divided by blue dashed lines. Like the P-V (laser power vs. scan speed) space reported in the literature [Citation13,Citation15], we can use the correlation maps ((c-d)) as a data-driven approaches to avoid process parameters with a high likelihood of pore generation and hence improve the process consistency in LPBF.
3.3. Extended applications of AM-SegNet
In this section, the application of AM-SegNet is extended to other synchrotron facilities, e.g. APS and DLS, and other advanced manufacturing processes (e.g. DED and HPDC). More relevant details of synchrotron beamlines and imaging settings can be found in Section 2.3. (a,b) present the differences in IoU scores between two model training strategies: training from scratch and transfer learning using the same X-ray imaging data collected from LPBF synchrotron experiments performed at APS. In the transfer learning, a pre-trained AM-SegNet is further tuned on the new dataset. Here, synchrotron experiment data collected from recent studies [Citation11,Citation13] are used for model training and testing. In this section, the model training platforms, i.e. hardware and software, are kept the same as listed in Section 3.1 and similar training strategies are adopted. Additionally, the total training epochs in (b,c) are set to 100 and 200, respectively. It is noted that the segmentation performance of AM-SegNet remains excellent in terms of mean IoU scores (∼95%) when confronted with a new dataset, regardless of the selection of training strategies. Furthermore, the utilisation of transfer learning enables the pre-trained model to achieve excellent performance with reduced training time and computation resources. This is because the pre-trained segmentation model has been comprehensively tuned on a large dataset and learned general features of X-ray imaging data that can be useful in similar tasks.
Figure 8. Extended application of AM-SegNet to other advanced manufacturing processes: (a) comparison of IoU values of individual labels after transfer learning and training from scratch using the same X-ray imaging data collected from APS synchrotron experiments; (b) transition of mean IoU scores during model training of (a); (c) transition of mean IoU scores in the model training on DED and HPDC X-ray imaging data; (d) illustration of pore area calculation using the segmentation results from AM-SegNet; and (e) error distribution of pore area quantification on DED X-ray imaging data collected from DLS synchrotron experiments.
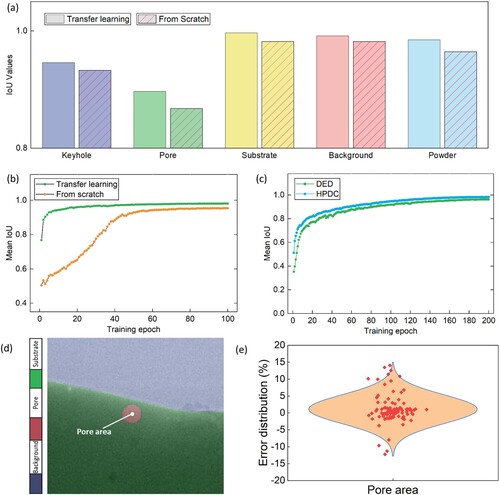
Additionally, the performance of AM-SegNet is further validated using X-ray imaging data collected from other advanced manufacturing processes. For example, (c) presents the transition of mean IoU scores when the AM-SegNet is trained on DED and HPDC X-ray imaging data. Upon the completion of model training, the mean IoU scores of AM-SegNet exceed 95% for both experiments. Likewise, the well-trained segmentation model can be used to perform feature quantification, i.e. calculation of pore area, on time-series DED X-ray images with high confidence (see (d,e)). Additionally, the trained model was tested on X-ray imaging results from an HPDC experiment with reasonable success (see Supplementary Video S2 in Codes and Videos).
4. Conclusions
In summary, this paper proposes a novel lightweight neural network, AM-SegNet, for image segmentation and feature quantification of X-ray imaging data collected from a variety of synchrotron experiments. A large-scale benchmark database consisting of pixel-labelled X-ray images has been established for network training and testing. The performance of AM-SegNet was compared with other state-of-the-art networks and further validated in other advanced manufacturing processes (DED and HPDC). The utilisation of AM-SegNet to facilitate feature quantification and correlation analysis was also explored. The main conclusions are given below:
AM-SegNet has the highest segmentation accuracy (∼96%) and the fastest processing speed (< 4 ms per frame), outperforming other state-of-the-art segmentation models.
Trained AM-SegNet enables automatic feature quantification and correlation analysis, minimising the time-consuming and subjective problems related to manual analysis.
Application of AM-SegNet for the segmentation and analysis of X-ray images can be feasibly extended to other advanced manufacturing processes with high confidence.
The proposed method will enable researchers and engineers in the manufacturing and imaging domains to expedite the processing of X-ray imaging data and gain new insights into complex experimental phenomena from a data-driven perspective. The benchmark database established in this study covers a wide range of high-speed synchrotron experiments, involving different beamlines, powder materials and process parameters. Therefore, it can be adopted by researchers to benchmark the performance of their models against others, and to develop new algorithms or techniques for image segmentation and quantification in this field. It is expected that real-time segmentation and quantification of X-ray images in high-speed synchrotron experiments will be achieved through deep learning in the near future.
Codes and videos
The source codes of AM-SegNet and supplementary videos are publicly available at GitHub (https://github.com/UCL-MSMaH/AM-SegNet).
Supplemental Material
Download MP4 Video (3.6 MB)Supplemental Material
Download MP4 Video (4.3 MB)Acknowledgement
We acknowledge the use of facilities and technical support by Research Complex at Harwell, and the European Synchrotron Radiation Facility (ESRF) for providing beam-time (ME-1573). The authors also acknowledge the technical and scientific support from beamline scientists and support staff at the ESRF. The authors are grateful to Diamond Light Source for the beamtime (MG22053-1, MG30735-1, and MG31855) and the help of all the staff on the I12 and I13 beamlines. We acknowledge the Renishaw plc. for their in-kind contribution and technical support on the development of the QUAD-ISOPR and an EPSRC-iCASE studentship (grant number: EP/W522193/1). We want to thank Dr Bita Ghaffari, Ford motor Company USA for providing die cast samples. We also extend our thanks to Dr. Ravi Shahani from Constellium for providing CP1 materials for the LPBF experiments, and Ford USA for providing materials and funding for the HPDC experiments.
Disclosure statement
No potential conflict of interest was reported by the author(s).
Data availability statement
The data that support the findings and conclusions of this study will be available from the corresponding author(s) upon reasonable request.
Additional information
Funding
References
- Sing SL, Yeong WY. Laser powder bed fusion for metal additive manufacturing: perspectives on recent developments. Virtual Phys Prototyp. 2020;15(3):359–370. doi: 10.1080/17452759.2020.1779999
- Zhu Y, Zhang K, Meng Z, et al. Ultrastrong nanotwinned titanium alloys through additive manufacturing. Nat Mater. 2022;21:1258–1262. doi: 10.1038/s41563-022-01359-2
- Song T, Chen Z, Cui X, et al. Strong and ductile titanium–oxygen–iron alloys by additive manufacturing. Nature. 2023;618:63–68. doi: 10.1038/s41586-023-05952-6
- Zhang YN, Groden C, Nyberg E, et al. W7Ni3Fe-Ti6Al4V bimetallic layered structures via directed energy deposition. Virtual Phys Prototyp. 2023;18(1):e2137048. doi: 10.1080/17452759.2022.2137048
- Sun Z, Ma Y, Ponge D, et al. Thermodynamics-guided alloy and process design for additive manufacturing. Nat Commun. 2022;13:4361. doi: 10.1038/s41467-022-31969-y
- Fleming TG, Rees DT, Marussi S, et al. In situ correlative observation of humping-induced cracking in directed energy deposition of nickel-based superalloys. Additive Manufacturing. 2023;71:103579. doi: 10.1016/j.addma.2023.103579
- Ren Z, Gao L, Clark SJ, et al. Machine learning-aided real-time detection of keyhole pore generation in laser powder bed fusion. Science. 2023;379:89–94. doi: 10.1126/science.add4667
- Huang Y, Fleming TG, Clark S, et al. Keyhole fluctuation and pore formation mechanisms during laser powder bed fusion additive manufacturing. Nat Commun. 2022;13:1170. doi: 10.1038/s41467-022-28694-x
- Rees DT, Leung CLA, Elambasseril J, et al. In situ X-ray imaging of hot cracking and porosity during LPBF of Al-2139 with TiB2 additions and varied process parameters. Mater Des. 2023;231:112031. doi: 10.1016/j.matdes.2023.112031
- Leung CLA., Marussi S, Atwood R, et al. In situ X-ray imaging of defect and molten pool dynamics in laser additive manufacturing. Nat Commun. 2018;9:1355. doi: 10.1038/s41467-018-03734-7
- Cunningham R, Zhao C, Parab N, et al. Keyhole threshold and morphology in laser melting revealed by ultrahigh-speed x-ray imaging. Science. 2019;363:849–852. doi: 10.1126/science.aav4687
- Hocine S, Van Swygenhoven H, Van Petegem S, et al. Operando X-ray diffraction during laser 3D printing. Mater Today. 2020;34:30–40. doi: 10.1016/j.mattod.2019.10.001
- Zhao C, Parab ND, Li X, et al. Critical instability at moving keyhole tip generates porosity in laser melting. Science. 2020;370:1080–1086. doi: 10.1126/science.abd1587
- Gordon JV, Narra SP, Cunningham R, et al. Defect structure process maps for laser powder bed fusion additive manufacturing. Additive Manufacturing. 2020;36:101552. doi: 10.1016/j.addma.2020.101552
- Gan Z, Kafka OL, Parab N, et al. Universal scaling laws of keyhole stability and porosity in 3D printing of metals. Nat Commun. 2021;12:2379. doi: 10.1038/s41467-021-22704-0
- Wu ZW, Wu SC, Duan Y, et al. In situ X-ray tomography of fracture behaviour in low-porosity L-PBF AlSi10Mg alloy with laser shock peening. Virtual Phys Prototyp. 2023;18(1):e2273955. doi: 10.1080/17452759.2023.2273955
- Rao J, Sing SL, Liu P, et al. Non-destructive testing of metal-based additively manufactured parts and processes: a review. Virtual Phys Prototyp. 2023;18(1):e2266658. doi: 10.1080/17452759.2023.2266658
- Nielsen M-A, Gloy JF, Lott D, et al. Automatic melt pool recognition in X-ray radiography images from laser-molten Al alloy. J Mat Res Technol. 2022;21:3502–3513. doi: 10.1016/j.jmrt.2022.10.121
- Scime L, Beuth J. Using machine learning to identify in-situ melt pool signatures indicative of flaw formation in a laser powder bed fusion additive manufacturing process. Additive Manufact. 2019;25:151–165. doi: 10.1016/j.addma.2018.11.010
- Zhang Y, Hong GS, Ye D, et al. Extraction and evaluation of melt pool, plume and spatter information for powder-bed fusion AM process monitoring. Mater Des. 2018;156:458–469. doi: 10.1016/j.matdes.2018.07.002
- Aminzadeh M, Kurfess TR. Online quality inspection using Bayesian classification in powder-bed additive manufacturing from high-resolution visual camera images. J Intell Manuf. 2019;30:2505–2523. doi: 10.1007/s10845-018-1412-0
- Grasso M, Laguzza V, Semeraro Q, et al. In-Process monitoring of selective laser melting: spatial detection of defects Via image data analysis. J Manufact Sci Eng. 2017;139(5):051001. doi: 10.1115/1.4034715
- Yadav P, Singh VK, Joffre T, et al. Inline drift detection using monitoring systems and machine learning in selective laser melting. Adv Eng Mater. 2020;22:2000660. doi: 10.1002/adem.202000660
- Zhang B, Liu S, Shin YC. In-Process monitoring of porosity during laser additive manufacturing process. Additive Manufact. 2019;28:497–505. doi: 10.1016/j.addma.2019.05.030
- Scime L, Siddel D, Baird S, et al. Layer-wise anomaly detection and classification for powder bed additive manufacturing processes: A machine-agnostic algorithm for real-time pixel-wise semantic segmentation. Additive Manufact. 2020;36:101453. doi: 10.1016/j.addma.2020.101453
- Shevchik SA, Kenel C, Leinenbach C, et al. Acoustic emission for in situ quality monitoring in additive manufacturing using spectral convolutional neural networks. Additive Manufact. 2018;21:598–604. doi: 10.1016/j.addma.2017.11.012
- Falk T, Mai D, Bensch R, et al. U-Net: deep learning for cell counting, detection, and morphometry. Nat Methods. 2019;16:67–70. doi: 10.1038/s41592-018-0261-2
- Manifold B, Men S, Hu R, et al. A versatile deep learning architecture for classification and label-free prediction of hyperspectral images. Nat Mach Intell. 2021;3:306–315. doi: 10.1038/s42256-021-00309-y
- Bilodeau A, Delmas CVL, Parent M, et al. Microscopy analysis neural network to solve detection, enumeration and segmentation from image-level annotations. Nat Mach Intell. 2022;4:455–466. doi: 10.1038/s42256-022-00472-w
- Zhang J, Lyu T, Hua Y, et al. Image segmentation for defect analysis in laser powder Bed fusion: deep data mining of X-Ray photography from recent literature. Integr Mater Manuf Innov. 2022;11:418–432. doi: 10.1007/s40192-022-00272-5
- Dong W, Lian J, Yan C, et al. Deep-Learning-Based segmentation of keyhole in In-situ X-ray imaging of laser powder Bed fusion. Materials (Basel). 2024;17(2):510. doi: 10.3390/ma17020510
- Carter FM, Kozjek D, Porter C, et al. Melt pool instability detection using coaxial photodiode system validated by in-situ X-ray imaging. CIRP Ann. 2023;72:205–208. doi: 10.1016/j.cirp.2023.03.031
- Bhagavath S, Gong Z, Wigger T, et al. Mechanisms of gas and shrinkage porosity formation in solidifying shear bands. J Mater Process Technol. 2022;299:117338. doi: 10.1016/j.jmatprotec.2021.117338
- Li W, Zhang L, Wu C, et al. A new lightweight deep neural network for surface scratch detection. Int J Adv Manuf Technol. 2022;123:1999–2015. doi: 10.1007/s00170-022-10335-8
- Chen J, Sasaki H, Lai H, et al. Three-dimensional residual channel attention networks denoise and sharpen fluorescence microscopy image volumes. Nat Methods. 2021;18:678–687. doi: 10.1038/s41592-021-01155-x
- Bouchard C, Wiesner T, Deschênes A, et al. Resolution enhancement with a task-assisted GAN to guide optical nanoscopy image analysis and acquisition. Nat Mach Intell. 2023;5:830–844. doi: 10.1038/s42256-023-00689-3
- He K, et al. Deep residual learning for image recognition. IEEE Conference on Computer Vision and Pattern Recognition. 2016.
- Diakogiannis FI, Waldner F, Caccetta P, et al. ResUNet-a: A deep learning framework for semantic segmentation of remotely sensed data. ISPRS J Photogramm Remote Sens. 2020;162:94–114. doi: 10.1016/j.isprsjprs.2020.01.013
- Li W, Zhang L, Wu C, et al. Predicting the evolution of sheet metal surface scratching by the technique of artificial intelligence. Int J Adv Manuf Technol.. 2021;112:853–865. doi: 10.1007/s00170-020-06394-4
- Huang L, Chen H, Liu T, et al. Self-supervised learning of hologram reconstruction using physics consistency. Nat Mach Intell. 2023;5:895–907. doi: 10.1038/s42256-023-00704-7
- Ko C-N. Identification of nonlinear systems with outliers using wavelet neural networks based on annealing dynamical learning algorithm. Eng Appl Artif Intell. 2012;25:533–543. doi: 10.1016/j.engappai.2011.09.019
- Kingma DP, Jimmy B. Adam: A method for stochastic optimization. arXiv:1412.6980, 2014.
- Vlachas PR, Arampatzis G, Uhler C, et al. Multiscale simulations of complex systems by learning their effective dynamics. Nat Mach Intell. 2022;4:359–366. doi: 10.1038/s42256-022-00464-w
- Lin T-Y, et al. Focal loss for dense object detection. IEEE International Conference on Computer Vision. 2017.
- Girshick R, et al. Rich feature hierarchies for accurate object detection and semantic segmentation. IEEE Conference on Computer Vision and Pattern Recognition. 2014.
- Jadon S. A survey of loss functions for semantic segmentation. IEEE Conference on Computational Intelligence in Bioinformatics and Computational Biology. 2020.
- Selvaraju, R. R., et al. Grad-cam: Visual explanations from deep networks via gradient-based localization. IEEE International Conference on Computer Vision, 2017.
- Zhu M, Feng Z, Stanković L, et al. A probe-feature for specific emitter identification using axiom-based grad-CAM. Signal Processing. 2022;201:108685. doi: 10.1016/j.sigpro.2022.108685
- Zhang ZY, Li JK, Cheng T, et al. Simultaneously enhanced strength and ductility of AlSi7Mg alloy fabricated by laser powder bed fusion with on-line static magnetic field. Virtual Phys Prototyp. 2023;18(1):e2161918. doi: 10.1080/17452759.2022.2161918