
 ?Mathematical formulae have been encoded as MathML and are displayed in this HTML version using MathJax in order to improve their display. Uncheck the box to turn MathJax off. This feature requires Javascript. Click on a formula to zoom.
ABSTRACT
Material extrusion (MEX) 3D printing offers a promising avenue for fabricating metal and ceramic components, where highly loaded polymer filaments are 3D-printed and sintered. Achieving nearly 100% 3D-printed part density is critical in this process, as porosity during printing compromises part properties after sintering. However, challenges arise due to the unfavourable mechanical and rheological properties of MEX metal filaments, leading to slow print-speeds, filament breakage, and inconsistent extrusion. This work explores these process-property correlations by developing process maps for bound metal filaments and unfilled polymer systems. This study throws light on the significance of back-flow and back-pressure in calculating the pressure drop across the nozzle, especially in a diverse set of material systems represented by hard and stiff PLA, soft and flexible TPU, and brittle and fragile bronze filaments. Additionally, ANOVA identified the effect of print conditions on measured variables, while regression models helped predict the behaviour of a given material under different process conditions. Therefore, this study enables material design and discovery for bound-metal filaments while addressing critical knowledge gaps, thereby paving the way for high-density 3D-printed components.
1. Introduction
The bound metal powder-polymer 3D printing process, often referred to as material extrusion (MEX), presents a promising avenue for the fabrication of metal and ceramic components. This process utilises a highly loaded bound powder-polymer filament, typically exceeding 50 vol.% or 80 wt.% equivalent, as its raw material [Citation1–3]. However, it's important to note that the polymer in this filament primarily serves the purpose of binding the metal or ceramic powder particles together as opposed to fibre-reinforced polymer composites, where the fibres are embedded in thermoplastic polymeric matrix [Citation4,Citation5]. To achieve the desired dense metal or ceramic parts, additional post-processing steps, including polymer removal through debinding and powder compaction and densification via sintering, are necessary. Therefore, maintaining nearly 100% printed part density is paramount for bound powder-polymer filaments, as any porosity introduced during printing can result in compromised mechanical properties after the sintering process. This study delves into the intricate interactions between material properties and the 3D printing process with the focus on bound powder-polymer filaments, focusing on achieving dense parts, and comparing its processing behaviour to traditional unfilled polymer filaments. There are many material-process challenges in working with bound powder-polymer filaments in contrast with unfilled polymer systems used in MEX 3D printing. Primarily, the intrinsically limited mechanical and unfavourable rheological characteristics that occur as the bound powder-polymer filaments are highly loaded with powder content, typically, > 50 vol% give rise to a set of challenges [Citation6,Citation7]. These include a notable reduction in printing speed, frequent filament breakage, and erratic material flow during extrusion, often culminating in unsuccessful prints and subpar part quality [Citation8–10]. reviews the past work that was performed to analyse the material-process interactions that yield high-density green parts and identifies gaps in the literature that have not been addressed so far.
Table 1. Past literature studying the effects of viscosity, filament properties, and process parameters on the density of parts 3D printed using unfilled/filled polymer systems.
As mentioned before, one key challenge with working with bound powder-polymer filaments with high solids loading (>50vol. %) is its rheological properties that are often not conducive to printing at higher print speeds. In several studies, the significance of viscosity in the context of 3D printing processes was underscored. For instance, Venkataraman et al. delved into the intricate correlation between viscosity and the feasibility of filament printing, identifying a specific range of shear rates conducive to successful extrusion based on the viscosity-to-stiffness ratio [Citation11]. However, the finer nuances of this ratio, a pivotal factor in achieving the high-density 3D printed parts, were left unexplored. Similarly, Gonzalez-Gutierrez et al. conducted a comprehensive review of models designed to predict viscosity in polymeric blends and suspensions [Citation21]. However, they did not delve into the repercussions of viscosity on part density. Turner et al. highlighted the interdependencies between material properties like modulus and viscosity with shear rates and pressure drop [Citation9,Citation10]. However, in the studies by Venkataraman et al. and Turner et al., the relationship between these material properties and part densities remains an underexplored aspect of the process [Citation9–11].
On the other hand, process parameters play a crucial role in bound metal 3D printing. For instance, typical print speeds for metal MEX are around 30 mm/s [Citation20], while polymer MEX 3D print speeds can reach over 100 mm/s [Citation22]. In MEX 3D printing, the filament behaves as a ram and is pushed while it melts inside the liquefier and extruders out of the nozzle. Therefore, low-modulus filaments start to buckle with an increase in print speed (as the force with which the filament is pushed is increased). For highly filled powder-polymer filaments, where typical solids loading is above the percolation threshold, the stiffness is lower, and viscosities are higher than for pure polymer filaments [Citation20]. Specifically, filaments with high powder can reduce the Young’s modulus by two orders of magnitude. For instance, ∼1500 MPa for pure 1.75 mm diameter PLA filament to ∼70 MPa for ∼55 vol.% Ti–6Al–4V powder in PLA. Alternatively, highly elastomeric materials such as TPU or TPC have 8× lower stiffer than PLA [Citation23]. Therefore, print speed limits are highly dependent on the mechanical properties of the filaments.
In the past, there have been attempts to investigate some of the print speed effects for unfilled polymer MEX 3D printing. For example, Duddleston et al. emphasised the significance of process parameters like nozzle diameter, print speed, layer height, and nozzle temperature on extrusion rates [Citation15]. David Phan et al. and Tim Osswald et al. delved into heat transfer and nozzle dynamics [Citation16,Citation17,Citation24]. However, these papers didn't thoroughly address how the mechanical properties of filaments influence green part properties or the correlation between process conditions and viscosity. Additionally, the print temperature is typically raised to prevent filament buckling, breakage, and nozzle clogging while printing at higher print speeds. The increase in temperature helps lower polymer viscosity allowing for a continuous flow [Citation7–10,Citation17,Citation18,Citation25,Citation26]. However, print temperatures cannot be increased by much since the polymer starts degrading over a particular temperature range. A majority of previous literature studied pure polymer systems and modelled liquefier geometry to determine the pressure drop at the nozzle exit and filament failure criteria along with governing rate limits for printing that included elastic modulus/viscosity ratios and extrusion forces required for successful printing [Citation11–14,Citation19,Citation27,Citation28]. Only two studies have reported filament behaviour for ceramic powder-filled fused filament fabrication (FFF) [Citation11,Citation28], and interestingly no study on print speed and its interrelationships with material properties for bound metal MEX 3D printing is currently available.
Therefore, mapping viscosity, and understanding the interrelationships between process parameters, material properties, and printed part quality in bound powder-polymer filaments is critical for consistent 3D printing, as it affects the material's flow behaviour through the MEX 3D printer nozzle. This paper focused on PLA, TPU, and bronze filled metal powder-bound filaments, each with extreme variation in filament mechanical and rheological properties which affect the print speed and the ensuing printed part quality. Our findings show that continuous material flow across the nozzle, the volume of material extruding from the nozzle, and maximising inter-layer bonding while preventing filament failure or buckling are crucial in achieving the desired density. To understand this process-property variation, we measured the force required to overcome pressure drop and the volumetric flow rate of each material, correlating it with the material viscosity and strength. We created process maps of density and viscosity for each material type for various volumetric flow rates resulting from changing the 3D printing process conditions. Our study also created and compared the process maps for bound metal filaments with the unfilled PLA and TPU systems to understand the zones where all materials over-extrude, under-extrude, or nominally extrude. A full factorial design of experiments was performed, and ANOVA analysis was conducted to identify the effect of print conditions on measured variables such as part density, volumetric flow rate, and force required to overcome the pressure drop. Regression analysis was used to determine which process variable affects volumetric flow rate and part density. Overall, this study provides crucial insight into the 3D printing process of polymer filaments, highlighting the importance of adjusting printing conditions for different materials. Our results can aid in new material design and discovery for bound metal filaments that have stagnated due to a limited understanding of their mechanical and rheological property interactions and the ensuing challenges in achieving near 100% dense parts.
2. Methodology
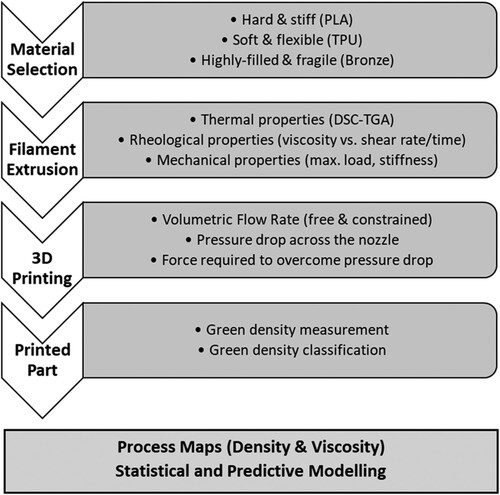
In the process of developing process maps and identifying statistical models for predicting the behaviour of different material systems processed via Metal MEX 3D printing, multiple steps were performed as shown in . A variety of material systems, based on their intrinsic properties were selected and extruded into filaments. Thermal, rheological, and mechanical properties of each of these material systems were measured before passing them for 3D printing. In order to understand the behaviour of these filaments while 3D printing multiple measurements and calculations were performed to identify the volumetric flow rate, pressure drop, and force across the nozzle. These parameters would later help delineate the cause and effect of print failures.
Figure 1. Flow chart outlining the approach adopted by the authors for developing process maps and statistical models.
Finally, to correlate the 3D printed parts’ quality with independent variables such as print speed, print temperature, and material type, a dimensionless number (based on part weight) called the ‘weight-ratio’ of each 3D printed part was measured and classified. This weight-ratio (WR) is expressed as a percentage and is defined as the ratio of the actual weight of the 3D printed part (in grams) to the theoretical weight (in grams). Where, the theoretical weight is calculated using the density of the material and the theoretical volume of the 3D printed part (based on CAD model). This weight-ratio is later used as a measure of whether a part is over-extruder (WR > 105), under-extruded (WR < 95), or nominally extruded (95 < WR < 105).
2.1. Materials
To understand how variation in material type (filled and unfilled polymers) and its material properties play a role in understanding the rate limits for MEX 3D printing three types of representative materials were selected. Specially, PLA (BCN3D, 1.75 mm filament) and TPU (NinjaTek NinjaFlex, 1.75 mm filament) were chosen to represent rigid and highly elastic filament materials [Citation29,Citation30]. Whereas a custom 92 wt.% bronze filament was formulated to represent highly filled powder-polymer filaments used for printing metal with MEX 3D printing. In such a case, the highly filled powder-polymer filaments are 3D printed and subsequently postprocessed via debinding and sintering to remove polymer and obtain dense metal parts. Therefore, the present work utilises two unfilled polymeric filaments: PLA, TPU, and one highly filled bronze filament with 55 vol.% solids loading.
Bronze powders (Kymera International, Durham, NC), with a median particle size of 150 μm were utilised to prepare the feedstock used for this study. A proprietary binder used for feedstock preparation was composed of three components: a backbone polymer (30–50 wt%), an elastomer (20–30 wt%), and a plasticising phase (20–40 wt%). The elastomer provides flexibility to the filament such that it can be spooled into coils for the ease of printing and storage. At the same time, the plasticising phase helps decrease feedstock viscosity and improve overall metal powder loading into the binder matrix. Bronze powder loading of 55 vol% was selected for preparing the feedstock filaments for further metal MEX print processing. The powder-binder mixture was blended and introduced at 180 °C, followed by mixing with a rotating speed of 50 rpm. This powder-binder mixture was blended for 45 min until the torque is stabilised, which signified mixture homogeneity. The blended mixture obtained from the torque rheometer was subsequently ground into smaller pellets (Plastic and Rubber Chopper PRC22-N180, Col-Int Tech, South Carolina, U.S.A.). This 55 vol% bronze feedstock pellets were extruded into flaments with a consistent diameter of 1.75 ± 0.05 mm using a capillary die with an L/D ratio of 30mm:1.75 mm on a capillary rheometer (Rheograph 20, GÖTTFERT Werkstof-Prüfmaschinen GmbH, Germany). The extrusion temperature was chosen to be 135 °C with a uniform extrusion speed of 0.1 mm/s to obtain a filament of smooth surface finish and consistent diameter. With a good understanding of the materials used and the filaments fabricated from each of these material systems, it was important to identify a range of parameters at which these filaments were to be 3D printed.
2.2. Design of experiments
To identify the effect of 3D printing parameters on weight-ratio and viscosity, an experimental matrix was designed to inculcate a range of extrusion temperatures and print speeds for each material while maintaining all the other print parameters constant. A set of 5 different print temperatures (210, 220, 230, 240, 250°C), and 6 print speeds (5, 10, 20, 30, 40, 50 mm/s) were chosen for experimentation. All the three materials (PLA, TPU and Bronze) were processed using a desktop 3D printer (Pulse from MatterHackers fitted with a Bondtech extruder) at each combination of these print temperatures and print speeds. A 0.4 mm diameter nozzle was used for the experiments. Solid cubes of dimensions 20 mm × 20 mm × 2 mm were printed at each combination of print parameters to determine the weight-ratio of each material printed at different processing conditions. The weight-ratio was calculated as a ratio of the measured weight of the printed part to the theoretical weight of the part. The theoretical weight was defined to be the weight of the cube based on the pycnometric density of the material printed and the volume calculated from the dimensions of the 3D printed cube.
2.3. Material characterisation
Additionally, thermal, mechanical and rheological characterisation was performed to understand the properties of each material feedstock. The as-received bronze powders and filaments were characterised for true densities. The true density (ρ) was measured using a helium gas pycnometer (Accupyc II 1340, Micromeritics Inc., GA, U.S.A.). The thermal characteristics of each material were analysed by collecting DSC-TGA data which was generated using a thermogravimetric analyser (TGA, SDT Q600, TA Instruments, New Castle, DE, U.S.A.). Thermogravimetric analysis (TGA) and differential scanning calorimetry (DSC) experiments were performed on PLA, TPU, and 55 vol.% bronze feedstock, at a heating rate of 5 °C/min up to 600°C in N2 atmosphere. While the ASTM F42 committee is still developing standards to measure the mechanical properties of 3D printed parts, the most recent ASTM standard WK82320 (published in late 2022) is the only document that outlines a test method for tensile testing thermoplastic filaments used in material extrusion additive manufacturing processes. However, it does not specify a standard test method for compressive testing of filaments – neither unfilled nor highly filled. The behaviour of filaments under compressive loading is especially important as it simulates the loading condition of the filaments during 3D printing. In a Material Extrusion (MEX) set-up, the feed rollers initiate the drive mechanism that delivers filament material into the heated nozzle. As pointed out by multiple researchers in the past [Citation11,Citation14], the filament is under compression stress in the region between the roller and the heated nozzle. This is due to the external force applied by the feed rollers on the filament to push more material into the heated nozzle or liquefier, which is counter-acted by the resistance to flow (viscosity) of the melt material in the liquefier. This compressive stress is therefore the driving force behind the extrusion process. In an effort to overcome the limitation on available standard test methods, and to mimic the loading conditions that an actual filament experiences while being fed through a 3D printer, a customised testing method was developed. The compression testing of the filaments was performed by loading them in parallel jaw clamps – similar to those used for tensile testing, where the samples were below the crosshead and the crosshead starts moving down at a constant displacement (0.5 mm/min). This testing is very similar to tensile testing of the filaments, with the only difference being the crosshead movement direction. Filaments of each material were subjected to compression testing (Instron 5569 Universal Testing Machine, Norwood, MA, U.S.A.) while maintaining a constant crosshead speed of 0.5 mm-min−1. Viscosity of all three feedstocks was measured at 5 different print temperatures in the shear rate range of 20–800 s−1 using a capillary rheometer (Rheograph 20, GÖTTFERT Werkstof-Prüfmaschinen GmbH, Germany) with a tungsten carbide die (L/D ratio of 30:1). The apparent shear rate was adjusted with Rabinowitsch-Weissenberg correction to account for the actual shear rate at the wall [Citation31].
3. Mathematical modelling
In order to identify the theoretical values for parameters such as volumetric flow rate, pressure drop across the nozzle, and force required to overcome the pressure drop, certain mathematical calculations and models were used in this study. Multiple researchers in the past developed different mathematical models to calculate these parameters. Numerous assumptions were made while utilising these models and most of these assumptions were based on the need to simplify calculations while ensuring that the calculated values are as close to experimental values as possible. This work utilised mathematical models suggested by researchers in the past, while understanding and reviewing the assumptions made to calculate the parameters theoretically.
3.1. Past mathematical models
One of the first models was published in 2004 by Bellini and Güçeri [Citation12], where they related the material flow to the pressure within the nozzle. In their model, the incoming filament acts as a piston that pushes the polymer melt through three distinct nozzle zones, while assuming that the polymer filament is in the melt state once it enters the nozzle. In 2008, Ramanath et al. published a research article, in which they modelled the melt flow of poly-ϵ-caprolactone across a nozzle [Citation13]. In their analysis, they used the finite element method to model the flow and heat transfer within 5 distinct nozzle zones. Their model included two additional zones as compared to the model by Bellini et. al., which included the heating conduit that precedes the nozzle. A review paper by Turner et al. in 2014, re-emphasises Bellini and Güçeri’s model as a standard approach in identifying the driving force for material flow across the nozzle in FDM systems [Citation9,Citation10]. A research article by Heller et al. later in 2016 focussed on simulating the flow within the extrusion nozzle to predict fibre orientation within the deposited bead during printing [Citation32]. Most of these models [Citation9,Citation10,Citation12,Citation13,Citation32] are based on the premise that the polymer melts as soon as the filament enters the nozzle.
More recently in 2018, Osswald et al. discussed the validity of prior models based on the fact that those approaches are only valid in cases where sufficient time is available to melt the filament as it travels through the heated nozzle, which translates to very low print speeds [Citation17]. Their paper presented a model that included a limiting case scenario where, at high print speeds, the melting rate controls the rate of the material flow across the nozzle. In this model, the material melts at the bottom of the larger diameter nozzle, forming a small melt film on the surface of the conical section. The pressure within the melt film acts as a driving force, squeezing the melt towards the centre and out through the capillary. This model was shown to be useful for optimising the melting within a material extrusion additive manufacturing process, and for addressing the material flow rate at higher print speeds.
Typically, the metal MEX feedstocks were seen to exhibit shear-thinning behaviour, where viscosity decreases with increasing shear rate [Citation20,Citation21,Citation28] Material flow properties were determined by applying the power law of Ostwald and de Waele for non-Newtonian fluids (shown in EquationEquation 1(1)
(1) ) to the viscosity measurements. Here,
is the shear rate, τ is the shear stress, ф is the material fluidity, and m describes material flow characteristics and its deviation from the Newtonian flow. These flow parameters further enable calculating the shear rate and pressure drop at the nozzle.
(1)
(1)
3.2. Volumetric flow rate calculation
The volume throughput of a material passed through a 3D printer under specific process parameters is quantitatively defined using the volumetric flow rate (Q). Volumetric flow rate (Q)is a parameter very similar to material flow index (MFI), which is commonly used to characterise the rheological characteristics of pure polymers. MFI is typically measured as the mass of extrudate flowing per unit time, expressed in g/min, whereas the volumetric flow rates measured the volume of extrudate flowing across the nozzle in unit time (cc/s). Considering the dependency of MFI and Q on the density of the material system, pycnometer densities of PLA (1.23 g/cc), TPU (1.57 g/cc), and Bronze (5.47 g/cc) filaments were measured. The ideal volumetric flow rate (Qideal) was estimated using mass conservation law (assuming the melt is incompressible), wherein the volume of material pushed into the liquefier is equal to the extrudate volume at the nozzle exit [Citation20,Citation33]. Qideal was measured using EquationEquation (1)(1)
(1) where, A1 is the cross-sectional area of the filament having diameter 1.75 mm, and A2 is the cross-sectional area at the nozzle exit having a diameter 0.4 mm. v1 is the feed rate at which filament is pushed by pinch rollers into the liquefier and v2 is the exit velocity of the extrudate as it leaves the nozzle.
(2)
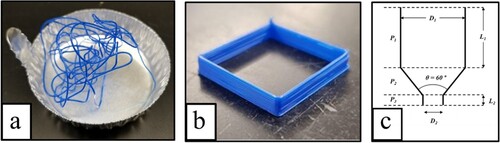
(2) The ideal case scenario however, is virtually non-existent and the actual volumetric flow rate in almost all cases is lower than the Qideal, due to the affect of pressure drop across the nozzle and the force required to overcome this pressure drop for successful extrusion. To account for the pressure drop across the nozzle and to identify the actual volumetric flow rate for a given material at specific process conditions, volumetric free flow rate (Qfree) was measured. This method of measuring Q was assumed to mitigate the influence of non-steady state extrusion caused by pressure build-up in the nozzle [Citation15], and was incorporated by researchers in the past [Citation20,Citation33]. In this work, material was freely extruded with the nozzle raised a few centimetres above the build platform by programming the software feed a constant length of filament (500 mm) into the extruder using the feed rollers. Each material (TPU, PLA and Bronze) was extruded using a commercial FFF printer (Pulse from MatterHackers fitted with a Bondtech extruder) at different print temperatures (210°C to 250°C) and print speeds (5 mm/s to 50 mm/s). Extrudates from each experiment were collected in an aluminium crucible as shown in (a) and weighed, while repeating each experiment at least three times to determine the average weight while ensuring repeatability. The flow rate was calculated using EquationEquation (3)
(3)
(3) .
(3)
(3) Although the volumetric free flow rate (Qfree) provides valuable data on the volume throughput of material passing through a nozzle at a given temperature and speed, it does not account for the back-flow pressure experienced by the extrudate while being deposited on an existing 3D printed layer. Annular back-flow and filament buckling are known to be the two primary failure modes during extrusion via FFF [Citation11,Citation14,Citation24]. The filament acting as a piston to drive the liquid polymeric material out of the nozzle is usually not perfectly flush with the liquefier wall, causing the heated polymer to flow back up the annular region between the filament and the liquefier wall, causing additional back-pressure across the nozzle that further inhibits material flow [Citation14]. Although extensive work on the effect of back pressure causing a back-flow of the heated polymer was studied in previous literature [Citation11,Citation14], these parameters were never taken into consideration while calculating and predicting volumetric flow rate and pressure drop across the nozzle. The results from this manuscript (as seen in and ) clearly indicate a considerable difference in volumetric flow rates and pressure drops in ‘free’ and ‘constrained conditions’, re-emphasising the importance of back-pressure and back flow in calculating the volumetric flow rate. More often than not, the back-pressure was seen to be significant and cannot be neglected. To simulate such a scenario which can account for the back-pressure experienced by the extrudate, and to compare it with the volumetric flow rate measured by free extrusion (Qfree), an alternate method was inculcated. A single-walled perimeter with 0% infill and one perimeter with 10 layers stacked on top of each other as shown in (b) was printed with each material (PLA, TPU and Bronze) at different print temperatures and print speeds and weighed to measure the mass of the part. The volumtric constrained flow rate (Qconstrained) was calculated using EquationEquation (3)
(3)
(3) as mentioned before. This technique ensured that the volumetric flow rate of a material at specified print temperature and print speed was measured in a constrained flow condition.
Figure 2. Samples collected to measure the volumetric flow rate (Q) using two methods: (a) 500 mm extrudate collected in an aluminium pan (b) single-walled cube (c) Pictorial representation of the nozzle divided into three sections to calculate pressure drop.
3.3. Calculating pressure drop and force across the nozzle
The pressure drop estimations were performed for the liquefier nozzle geometry with varying flow rates corresponding to the filament feed rates between 0.5 and 16 mm/s. The total pressure drop (P) was estimated to be the summation of P1, P2, and P3, which are the pressure drops in the three different sections of the liquefier/nozzle region shown in (c). The pressure drop in the three sections of the liquefier was estimated by performing momentum balance in conjunction with the power-law viscosity models [Citation9,Citation12,Citation13,Citation19], EquationEquation (4)(4)
(4) , EquationEquation (5)
(5)
(5) , EquationEquation (6)
(6)
(6) and EquationEquation (7)
(7)
(7) . Some of the key assumptions in these models include: melt is incompressible and isothermal, there is a no-slip boundary condition at the wall, and the flow is fully developed, steady-state, and laminar [Citation34].
(4)
(4)
(5)
(5)
(6)
(6)
(7)
(7) Q is the volumetric flow rate for the extrudate leaving the nozzle as defined in Section 3.2. L1 and D1 are the length and diameter at the entrance section, which are measured 10.5 and 1.75 mm, respectively, and L2 and D2 are the length and diameter at the exit section which are 0.6 and 0.4 mm, respectively. And θ is the nozzle angle (60°). The material constants m and ф were determined from the experimentally measured viscosity data. While using EquationEquation (4)
(4)
(4) to EquationEquation (7)
(7)
(7) for calculating the pressure drop across the nozzle, the volumetric flow rates used were that of both free and constrained flow measured from free extrusion of material and 3D printed single-wall perimeters respectively. To overcome the pressure drop P in EquationEquation (7)
(7)
(7) , a force, F is required to achieve successful material extrusion, which can be calculated with EquationEquation (8)
(8)
(8) , where Afilament is the area of filament cross-section at entry.
(8)
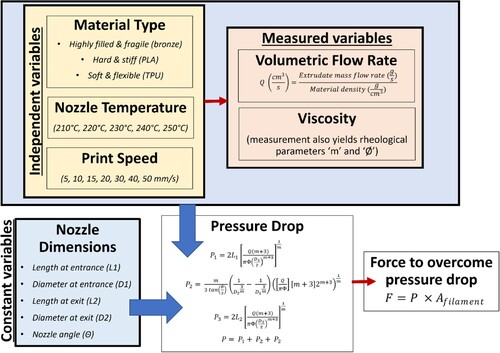
(8) outlines the roadmap to calculating and collecting all the data that was used in developing these statistical models. Independent variables (material type, nozzle temperature, and print speed), measured variables (volumetric flow rate, and viscosity), as well as constant variables such as nozzle dimensions were taken into account to calculate pressure drop and force across the nozzle for different combinations of independent variables. The effect of independent variables was analysed using ANOVA, before identifying logistic and multiple variable regression models to predict the weight-ratio and viscosity.
Each material type (PLA, TPU, and Bronze filaments) was printed at every combination of print temperature and print speed, as described in , while keeping certain process conditions constant. The constant variables included: nozzle diameter (0.4 mm), bed temperature (75⁰C), extrusion multiplier (1.0), and layer height (0.2 mm).
Figure 3. Roadmap outlining the independent variables, constant variables, and mathematically calculated parameters for experimentation and modelling.
4. Results and discussion
4.1. Filament characteristics
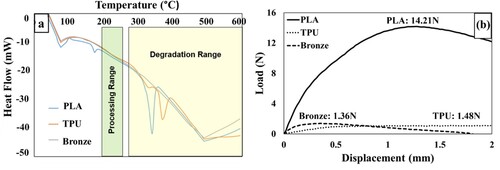
(a) represents the DSC analysis of all the three feedstocks (PLA, TPU and Bronze) used in this study. PLA and TPU filaments were as-received and were 3D printed in the range of 210°C to 250°C. Bronze filament on the other hand was manufactured in-house, where bronze powders were blended with a polymeric mixture at 180°C to make the feedstock that is further extruded at 135°C. DSC analysis in (a), clearly delineates the enthalpy changes associated with glass transition temperature (Tg) and polymer degradation for all three material systems. Polymer degradation was seen to be evident at temperatures beyond 280°C, whereas the glass transition temperatures of all the polymers were under 100°C. The processing temperatures to fabricate the feedstock and 3D print the filaments were carefully chosen, ensuring no polymer is thermally degraded. (b) reveals the mechanical testing data for the three filaments under compressive loading where the maximum compressive load each material system can sustain before the filament starts to buckle is labelled. The behaviour of filaments under compressive loading was especially important as it simulates the loading condition of the filaments during 3D printing. In a Fused Filament Fabrication (FFF) set-up, the feed rollers initiate the drive mechanism that delivers filament material into the heated nozzle. As pointed by multiple researchers in the past [Citation9,Citation12], the filament is under tensile stress upstream to the roller and under compression, in the region between the roller and the heated nozzle. This is understood to be due to the external force applied by the feed rollers on the filament to push more material into the heated nozzle or liquefier, which is counter-acted by the resistance to flow generated due to the viscosity of the melt material in the liquefier. This compressive stress therefore, is the driving force behind the extrusion process.
Figure 4. (a) Differential scanning calorimetry (DSC) of PLA, TPU and bronze filaments (b) Mechanical testing results of PLA, TPU and bronze filaments.
4.2. Volumetric flow rate (Q) characteristics
integrates the volumetric flow rate (Q) values measured in free and constrained flow conditions as a function of print speed and extrusion temperature for each material. Line plots represent the volumetric free flow rate (Qfree) and bar plots represent the volumetric constrained flow rate (Qconstrained). The material throughput in free flow conditions is evidently higher than in constrained flow, owing to the back pressure inhibiting free material flow across the nozzle. Volumetric flow rates (both free and constrained) showed a general increasing trend with increase in feed rate and extrusion temperatures. In general, this abides with intuition, where a higher feed rate suggested higher material input across the nozzle, while higher extrusion temperature suggested lower viscosity of the melt in the liquefier owing to the shear thinning behaviour of the feedstock.
Figure 5. Volumetric flow rate (Q) of PLA, TPU and bronze measured at different print temperatures and print speeds in both free and constrained conditions.
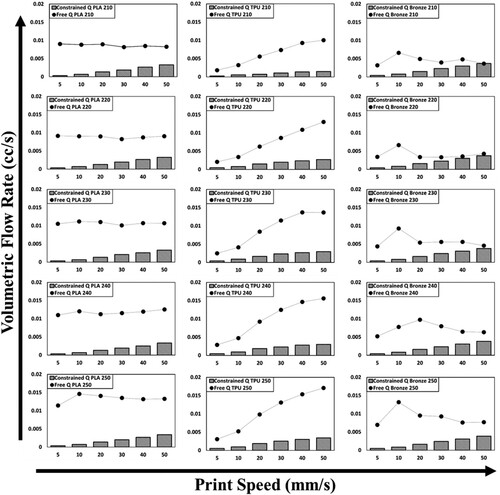
Additionally, it was observed that the volumetric flow rate of any given material is highly dependent on two key parameters: resistance to the flow of the material at a given temperature and print speed (viscosity), and the ability of the filament to withstand compressive forces between the liquefier and the drive gears (mechanical strength of the filament). As the print speed increases, the amount of material being pushed through the nozzle per unit time increases and intuitively the volumetric flow rate is expected to increase. However, beyond a limiting speed (about 10 mm/s), highly filled filaments that are relatively less strong succumb under high compressive forces, thereby decreasing the material flow (volumetric flow rate) across the nozzle. This interplay between material viscosity and filament strength causes bronze (weak and fragile) filaments to clearly show an initial rise in volumetric flow rate at 10 mm/s and then flatten out beyond 10 mm/s.
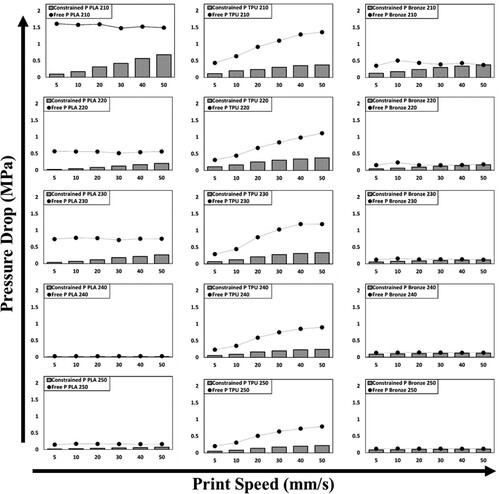
4.3. Pressure-drop and force across the nozzle
represents the pressure across the nozzle plotted against print speed for each material at different extrusion temperatures. The bar plots indicate the pressures calculated assuming constrained flow rate conditions whereas the line plots represent pressure drop in free flow conditions. It was observed that the volumetric flow rate has a direct impact on measuring the pressure drop across the nozzle and therefore, it is pertinent to identify the volumetric flow rate that closely resembles actual 3D printing conditions. also shows a predominant difference in pressure drop calculated in free flow and constrained flow conditions, re-emphasising and validating the importance of back-pressure. Additionally, the back pressure could be calculated as the difference between pressures calculated using free and constrained flow conditions. According to this hypothesis, we observed that the back pressure for unfilled and filled materials was strikingly different. This is in accordance with the theory proposed by Gilmer et al. [Citation14] that suggests, materials with high modulii transitioning to a very low viscosity fluid upon heating experience backflow. The back pressure sustained by bronze filaments was seen to be distinctly lower than that of PLA and TPU due to the differences in mechanical and flow properties of these filaments.
Figure 6. Pressure drop across the nozzle for TPU, PLA and bronze as a function of print speed at different print temperatures considering both free and constrained flow conditions.
In , the force required to overcome the pressure drop was calculated by taking into consideration, only pressures measured during free and constrained flow conditions. With the importance of back-pressure being evident from and , it makes sense to study and compare the forces calculated assuming constrained flow conditions.
Figure 7. Force required to overcome the pressure drop across the nozzle for TPU, PLA and bronze as a function of print speed at different print temperatures.
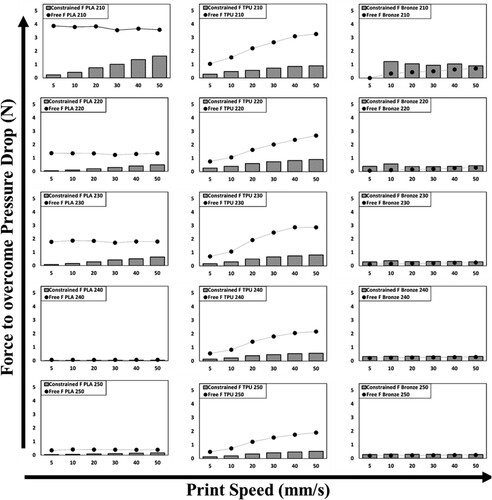
The relatively higher force values for PLA and Bronze filaments at lower temperatures (210°C) were indicative of the higher viscosity values of these feedstocks at lower temperatures. TPU filaments on the other hand were seen to be more sensitive to print speed, experiencing higher forces with increasing print speeds. This was attributed to the lower stiffness of TPU compared to PLA and bronze-filled filaments. It was suspected that the low stiffness of TPU combined with higher feed rates facilitated bucking of the filament between the rollers and the liquefier, thereby reducing the volumetric flow rate across the nozzle, leading to higher force requirement to overcome the pressure drop.
4.4. Weight-ratio and viscosity mapping
To understand the printability of each material at different processing conditions, simple cubes were 3D printed with each material (PLA, TPU and Bronze) and screened for their weight-ratio at different extrusion temperatures and print speeds. represents the weight-ratios of cubes printed at different conditions. A 5% tolerance limit was considered and all the print conditions that yielded parts with a weight-ratio <95% or higher than 105% were classified as non-optimal prints. Although the force required to overcome the pressure drop for every material used was lower than maximum load a filament can sustain under compression, parts printed using only certain print speeds and temperatures displayed optimal weight-ratios with a 5% tolerance. This emphasises the fact that the filament structural stability, although a determining condition in 3D printing, is not the only parameter to predict the printability of a material at given processing conditions. Moreover, the trend in achieving optimum prints was also seen to be varying with each material, suggesting that the printability of a material under specific process conditions is as much dependent on the thermal and rheological characteristics of the molten material in the liquefier as it is on the stiffness and strength of the filament.
Figure 8. Weight-ratio mapping of parts printed using filaments of TPU, PLA, and bronze.
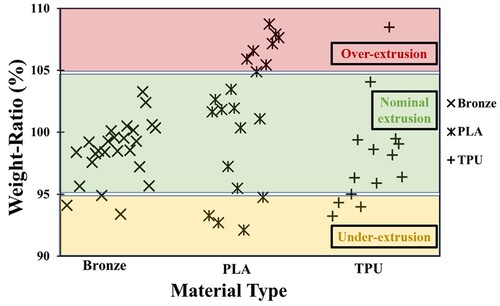
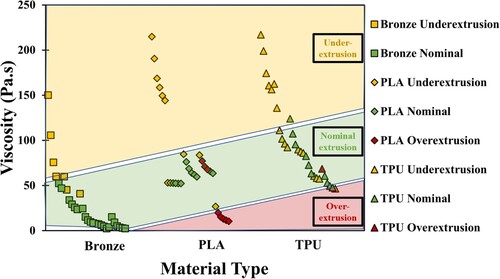
The viscosity of all three material systems (PLA, TPU and Bronze) was measured at each combination of print temperature and print speed. These viscosity values at different print conditions were correlated to the weight-ratios at their respective print conditions and classified accordingly. Parts printed at weight-ratios less than 95% were considered ‘under-extrusion’ and parts with weight-ratios higher than 105% were classified as ‘over-extrusion’, with all the parts having weight-ratios greater than 95% and less than 105% being ‘nominal extrusion’. represents all the viscosity data from different material systems printed at multiple print parameter combinations, classified based on their weight-ratios. The aim of this plot was to characterise and classify the range of viscosities for each material type that would lead to a part being either over-extruded, under-extruded, or nominally extruded. The horizontal positions of data-points for each material type were intentionally separated to ensure visibility, and to avoid overlapping of the data. Most of the under-extruded parts printed with WR < 95% were seen to have higher viscosity, while over extruded parts (WR > 105%) seemed to exhibit relatively lower viscosity. It is also worth noting that the number of correlations between viscosity and weight-ratio for bronze is most distinct, with PLA tending to over-extrude and TPU tending to under-extrude. This behaviour to attributed to material characteristics such as stiffness & strength of PLA over TPU and Bronze filaments. Moreover, it was also observed that the viscosity range for these three material systems varies with TPU extruding nominally at a higher viscosity range compared to PLA and Bronze filaments.
Figure 9. Viscosity data of PLA, TPU, and bronze classified according to weight-ratio (WR). WR < 95% represents ‘under-extrusion’, WR > 105% represents ‘over-extrusion’, and 95%<WR < 105% represents nominal extrusion.
4.5. Statistical modelling
Metal MEX 3D printing is a multi-step technique involving feedstock fabrication, filament extrusion, 3D printing, and post processing to get to the final part. Every step in this process involves multiple process parameters which can define the quality and properties of the 3D printed part. Understanding the influence and effect of each parameter by trial and error, or even by design of experiments is highly time-consuming and rigorous. To help solve this problem and to assist in predicting the viscosity which determines the material flow through the nozzle, as well as weight-ratio that identifies the green part quality, statistical modelling such as multiple variable regression and logistic regression analysis was performed.
4.5.1. ANOVA analysis
The effect of the experimental conditions on the measured variables is investigated by statistical analysis approaches. shows the results of N-way analysis of variance (ANOVA) [Citation35] on the effect of the experimental conditions on the observed measurements of weight-ratio, viscosity and force across nozzle. The conditions are as follows: material (PLA, TPU, Bronze Feedstock), nozzle temperature (210, 220, 230, 240, 250°C), and print speed (5, 10, 20, 30, 40, 50 mm/s). The table shows the Sum-of-squares, Degrees of freedom, Mean squares, F ratio, and P values for the three outcomes. Mean squares are computed by dividing the Sum-of-squares by the corresponding Degrees of freedom. F ratio is the ratio of Mean squares to Mean squares residuals. A larger F value implies greater evidence there is a difference between the group means. P values corresponding to the F values help determine if the difference between the group means is statistically significant. A significance level of 0.05 is used for comparison. Significant effect of all three experimental conditions is observed for the density, viscosity, and force as seen by the p-values being less than 0.05. However, there is a difference regarding interaction effects. Viscosity exhibits significant interaction effect of nozzle temperature and print speed. This is not observed for the weight-ratio and force across nozzle, where the p-values are greater than 0.05 for the nozzle temperature and print speed interaction. However, all three measured variables exhibit significant interaction between material and nozzle temperature, and material and print speed, as the p-values are less than 0.05.
Table 2. P-value results from ANOVA.
4.5.2. Multiple variable regression
We investigated if the constrained flow rate and the weight-ratio can be effectively predicted by applying regression modelling on the process variables. For the multiple variable regression, the input or predictor variables included three dummy variables corresponding to the three material types – Bronze, PLA, TPU. This means that the dummy variables have values of 0 or 1, with 1 corresponding to the presence of a material. The other predictor variables are Temperature and Speed. The response variables are the Constrained Flow Rate and weight-ratio. Using MATLABTM, the coefficient estimates for the multiple linear regression based on the response and the predictor variables. The coefficients thus obtained are shown in .
Table 3. Coefficient estimates of multiple linear regression.
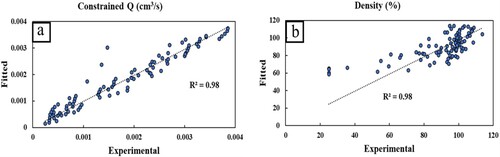
It should be noted that in , there is no constant term for the regression model. There is no need for including a constant term (intercept) in this linear regression due to the presence of dummy variables. shows the plots of the experimental and fitted ‘Constrained Q’ and ‘%Density’. The correlation for volumetric flow rate (Qconstrained)is good and suggests that linear regression is effective in predicting these outcomes and can be utilised to develop a prediction model with division of experimental data into training and testing data sets. The data for % density is however, more scattered and skewed compared to the volumetric flow rate data. This behaviour is hypothesised to be due to the multiple parameters that determine the part density, as opposed to that in volumetric flow rate. This reinforces the high dependence of % density on material type and characteristics, demanding a need for a logistic regression model as described in Section 4.5.3.
Figure 10. Plots of fitted and experimental (a) constrained Q, and (b) density values from multiple variable regression.
4.5.3. Logistic regression
In the context of 3D printing, the weight-ratio has also been explored as a categorical variable with three states – under extrusion, nominal extrusion, and over extrusion. Thus, a prediction of the extrusion category based on the process conditions may also be a helpful tool. A multinomial logistic regression model was developed. The predictor variables were the same as in the multiple linear regression in Section 4.5.2. The response variable was the categorical variable of extrusion state. In this study, the outcomes were not equally divided among under extrusion, nominal extrusion and over extrusion. Consequently, the effectiveness of logistic fit is affected. In the future, for an effective logistic regression-based prediction of the extrusion, the experiments will incorporate large datasets as well as equal number of data points pertaining to the three categories of extrusion. Our experiments described in this study resulted in 39 instances of under extrusion, 9 instances of over extrusion, and 42 instances of nominal extrusion. Regardless, the effectiveness of logistic regression was explored as an initial proof of concept. Using MATLABTM to fit the multinomial logistic regression, the relative risk equations are obtained as shown in Equation (9) and Equation (10).
(9)
(9)
(10)
(10) The regression models (Equation 9 and Equation 10) were used to calculate the probabilities and compare with actual test conditions. In the case of over extrusion, the fitted probability of over extrusion is higher than the probability of nominal extrusion in 8 out of 9 instances. Similarly, in the case of under extrusion, the fitted probability of under extrusion is higher than the probability of nominal extrusion in 37 out of 39 instances. However, although these fits are not perfect and cannot confidently be used to predict if the extrusion is nominal or abnormal due to the size of the dataset, they still give insight on the probability of over-extrusion or under-extrusion of a given material system under given parameters. The aim behind presenting the logistic model is to show an approach for estimating the relative probability of the extrusion being under-, over-, or nominal extrusion based on the filament material and print conditions. This logistic model is aimed at estimating the relative probability of occurrence of nominal, under-, or over-extrusion. Two logistic equations were needed for this. The ratios in particular are not significant for quantitative comparison, rather they show a relation between two probabilities. However, they still help in our understanding of the effects of process conditions. For instance, in Equation (10) the coefficient of Temperature is much higher than Speed, implying a change in Temperature has a stronger effect on whether the extrusion is more probable to be over-extrusion or nominal. On the other hand, the coefficient of Speed is 0.05, implying negligible effect of Speed on whether it is more probable that the extrusion is over-extrusion than nominal extrusion. We envision future research where feedback control of print conditions and even filament material properties will be utilised to ensure proper extrusion and print quality. A probability-based calculation will be very effective in such scenarios, thereby aiding and accelerating new material development for Material Extrusion (MEX) 3D Printing of filled and un-filled polymers.
5. Conclusion
Material extrusion (MEX) 3D Printing, especially with unfilled hard, soft, and highly filled (metal/ceramic) polymer systems, effectively fabricates polymers, composites, and even metals and ceramic components. Specifically, this work identified that MEX 3D Printing with hard, soft, and highly filled polymer composites significantly depends on each material system's intrinsic material characteristics and mechanical properties. For instance, hard and stiff PLA filaments, which were 25× stronger and 8× stiffer than soft and flexible TPU, can print at higher speeds (up to 50 mm/s) as compared to TPU (<20 mm/s). This behaviour is due to different material systems’ filament strength and viscosity variation at a given nozzle temperature and print speed. The 3D printing speed also changes the force required to overcome the pressure drop across the nozzle. For example, at 230°C and 50 mm/s, the viscosity of TPU is 1.5 times that of PLA, producing 55% dense TPU parts as opposed to 100% dense PLA parts. Conversely, bronze-filled filaments, although brittle and fragile, still manage to print 98% dense parts under similar print conditions. This behaviour is because the force to overcome the pressure drop in bronze (0.2N) is lower than that for TPU (2.9N), making TPU buckle and causing inconsistent material flow and can be captured on a process-property map.
ANOVA analysis highlighted the significance of viscosity, and force required to overcome the pressure drop, causing each material system to either under-extrude, over-extrude, or print optimally at different print parameters. Viscosity and weight-ratio maps were developed to pinpoint the locations of high-density parts printed using various material systems processed at different print conditions. Multiple variable regression models predicted the volumetric flow rate and weight-ratio with up to 98% accuracy, and logistic regression models quantitatively identified the probability of over-extrusion or under-extrusion.
In the ever-evolving field of additive manufacturing, especially MEX 3D printing, the demand for new material development to meet the need for improved performance, durability, and versatility, is surging. However, MEX 3D Printing requires tremendous efforts towards optimising the parameters to achieve highly dense parts when there is a change in material type and composition. Parameter optimisation is currently a trial-and-error process requiring rigorous experimentation and testing. This process step makes MEX 3D Printing time-consuming and overwhelming to work with new material systems regularly. Therefore, it is advantageous to predict the material properties such as viscosity to achieve higher density parts irrespective of changes in the material type, composition, and print parameters such as nozzle temperature and print speed. This research aims to provide a step-by-step guidance to early career researchers and industries who are willing to explore the potential in fabricating metal and ceramic parts using highly loaded bound powder-polymer filament MEX 3D printing. This study used a range of material systems with diverse properties, which helped develop process maps and regression models that can further be extended to identify optimum print parameters and accelerate new material qualification. In conclusion, this work helps us understand how the material-structure-process relationship governs the printing process and the ensuing part properties.
Disclosure statement
No potential conflict of interest was reported by the author(s).
Data availability statement
Authors agree to make data and materials supporting the results or analyses presented in their paper available upon reasonable request.
References
- Abel J, Scheithauer U, Janics T, et al. Fused filament fabrication (FFF) of metal-ceramic components. J Vis Exp. 2019;2019:e57693. doi:10.3791/57693
- Hong S, Sanchez C, Du H, et al. Fabrication of 3D printed metal structures by use of high-viscosity Cu paste and a screw extruder. J Electron Mater. 2015;44:836–841. doi:10.1007/s11664-014-3601-8
- Ren L, Zhou X, Song Z, et al. Process parameter optimization of extrusion-based 3D metal printing utilizing PW-LDPE-SA binder system. Materials. 2017;10:305. doi:10.3390/ma10030305
- Gackowski BM, Goh GD, Sharma M, et al. Additive manufacturing of nylon composites with embedded multi-material piezoresistive strain sensors for structural health monitoring. Compos Part B Eng. 2023;261:110796. doi:10.1016/j.compositesb.2023.110796
- Blok LG, Longana ML, Yu H, et al. An investigation into 3D printing of fibre reinforced thermoplastic composites. Addit Manuf. 2018;22:176–186. doi:10.1016/j.addma.2018.04.039
- Chen J, Smith DE. Filament rheological characterization for fused filament fabrication additive manufacturing: a low-cost approach. Addit Manuf. 2021;47:102208. doi:10.1016/j.addma.2021.102208
- Gonzalez-Gutierrez J, Duretek I, Kukla C, et al. Models to predict the viscosity of metal injection molding feedstock materials as function of their formulation. Metals. 2016;6:129. doi:10.3390/met6060129
- Luo C, Wang X, Migler KB, et al. Effects of feed rates on temperature profiles and feed forces in material extrusion additive manufacturing. Addit Manuf. 2020;35:101361. doi:10.1016/j.addma.2020.101361
- Turner BN, Strong R, Gold SA. A review of melt extrusion additive manufacturing processes: I. Process design and modeling. Rapid Prototyp J. 2014;20:192–204. doi:10.1108/RPJ-01-2013-0012
- Turner BN, Gold SA. A review of melt extrusion additive manufacturing processes: II. Materials, dimensional accuracy, and surface roughness. Rapid Prototyp J. 2015;21:250–261. doi:10.1108/RPJ-02-2013-0017
- Venkataraman N, Rangarajan S, Matthewson MJ, et al. Feedstock material property – process relationships in fused deposition of ceramics (FDC). Rapid Prototyp J. 2000;6:244–252. doi:10.1108/13552540010373344
- Bellini A, Güçeri S, Bertoldi M. Liquefier dynamics in fused deposition. J Manuf Sci Eng Trans ASME. 2004;126:237–246. doi:10.1115/1.1688377
- Ramanath HS, Chua CK, Leong KF, et al. Melt flow behaviour of poly-ϵ-caprolactone in fused deposition modelling. J Mater Sci Mater Med. 2008;19:2541–2550. doi:10.1007/s10856-007-3203-6
- Gilmer EL, Miller D, Chatham CA, et al. Model analysis of feedstock behavior in fused filament fabrication: enabling rapid materials screening. Polymer. 2018;152:51–61. doi:10.1016/j.polymer.2017.11.068
- Duddleston LJL, Woznick K, Koch C, et al. Extrudate mass flow rate analysis in fused filament fabrication (FFF): a cursory investigation of the effects of printer parameters. Proceedings of Annual Technical Conference – ANTEC, 2017-May; Anaheim, California, USA; 2017. p. 43–48.
- Phan DD, Swain ZR, Mackay ME. Rheological and heat transfer effects in fused filament fabrication. J Rheol. 2018;62:1097–1107. doi:10.1122/1.5022982
- Osswald TA, Puentes J, Kattinger J. Fused filament fabrication melting model. Addit Manuf. 2018;22:51–59. doi:10.1016/j.addma.2018.04.030
- Coogan TJ, Kazmer DO. In-line rheological monitoring of fused deposition modeling. J Rheol. 2019;63:141–155. doi:10.1122/1.5054648
- Anderegg DA, Bryant HA, Ruffin DC, et al. In-situ monitoring of polymer flow temperature and pressure in extrusion based additive manufacturing. Addit Manuf. 2019;26:76–83. doi:10.1016/j.addma.2019.01.002
- Singh P, Balla VK, Tofangchi A, et al. Printability studies of Ti-6Al-4V by metal fused filament fabrication (MF3). Int J Refract Met Hard Mater. 2020;91:105249. doi:10.1016/j.ijrmhm.2020.105249
- Gonzalez-Gutierrez J, Cano S, Schuschnigg S, et al. Additive manufacturing of metallic and ceramic components by the material extrusion of highly-filled polymers: a review and future perspectives. Materials. 2018;11:840. doi:10.3390/ma11050840
- Go J, Hart AJ. Fast desktop-scale extrusion additive manufacturing. Addit Manuf. 2017;18:276–284. doi:10.1016/j.addma.2017.10.016
- Ashby MF. Overview No. 80. On the engineering properties of materials. Acta Metall. 1989;37:1273–1293. doi:10.1016/0001-6160(89)90158-2
- Phan DD, Horner JS, Swain ZR, et al. Computational fluid dynamics simulation of the melting process in the fused filament fabrication additive manufacturing technique. Addit Manuf. 2020;33:101161. doi:10.1016/j.addma.2020.101161
- Moretti M, Rossi A, Senin N. In-process simulation of the extrusion to support optimisation and real-time monitoring in fused filament fabrication. Addit Manuf. 2021;38:101817. doi:10.1016/j.addma.2020.101817
- Aumnate C, Pongwisuthiruchte A, Pattananuwat P, et al. Fabrication of ABS/graphene oxide composite filament for fused filament fabrication (FFF) 3D printing. Adv Mater Sci Eng. 2018;2018:2830437. doi:10.1155/2018/2830437
- Go J, Schiffres SN, Stevens AG, et al. Rate limits of additive manufacturing by fused filament fabrication and guidelines for high-throughput system design. Addit Manuf. 2017;16:1–11. doi:10.1016/j.addma.2017.03.007
- Rangarajan S, Qi G, Venkataraman N, et al. Powder processing, rheology, and mechanical properties of feedstock for fused deposition of Si3N4 ceramics. J Am Ceram Soc. 2000;83:1663–1669. doi:10.1111/j.1151-2916.2000.tb01446.x
- NinjaTek. NinjaFlex® 3D printing filament: flexible polyurethane material for FDM printers. 2016. p. 1. Available from: https://ninjatek.com/wp-content/uploads/NinjaFlex-TDS.pdf
- BCN3D technical data sheet PLA. 2018. p. 1–3. Available from: https://ultimaker.com/download/74972/UM180821TDSABSRBV12.pdf
- Oswald NRT. Polymer rheology. J Appl Polym Sci. 2015;5(14):S5. doi:10.1002/app.1961.070051418
- Heller BP, Smith DE, Jack DA. Effects of extrudate swell and nozzle geometry on fiber orientation in fused filament fabrication nozzle flow. Addit Manuf. 2016;12:252–264. doi:10.1016/j.addma.2016.06.005
- Geng P, Zhao J, Wu W, et al. Effects of extrusion speed and printing speed on the 3D printing stability of extruded PEEK filament. J Manuf Process. 2019;37:266–273. doi:10.1016/j.jmapro.2018.11.023
- Hopmann WMC. Extrusion dies for plastics and rubber: design and engineering computations. München: Carl Hanser Verlag GmbH Co KG; 2016.
- Avila AF, Morais DTS. A multiscale investigation based on variance analysis for hand lay-up composite manufacturing. Compos Sci Technol. 2005;65:827–838. doi:10.1016/j.compscitech.2004.05.021