
 ?Mathematical formulae have been encoded as MathML and are displayed in this HTML version using MathJax in order to improve their display. Uncheck the box to turn MathJax off. This feature requires Javascript. Click on a formula to zoom.
ABSTRACT
3D-printing enables fabricating insoles with locally variable mechanical properties that can better redistribute plantar pressure by altering the mechanical structure. However, current approaches have limitations in terms of speed, strand thickness, and gradual stiffness transitions. To address this, our research proposes utilising the 3D-printed Spacer technique. Our approach involves 3D-printing the insole on their lateral side, with gradual stiffness transitions achieved by modulating the feed speed and material extrusion, enabling strands thinner than the nozzle diameter, while eliminating travel movements. We present a workflow for customisation and fabrication of insole geometry utilising 3D foot scans and automatic g-code generation directly from our design tool. Additionally, we introduce a novel automated support removal process using a hot-wire cutter mounted on a 6-axis robotic arm. We evaluated the printed structures’ mechanical properties and durability through compression tests and assessed the insoles’ performance using a user wear test that included pressure distribution analysis.
1. Introduction
Custom orthotic insoles provide support for the foot and assist in relieving pain. Insoles are used for the prevention and treatment of various conditions, such as ulceration in the neuropathic diabetic foot [Citation1], reducing lower-back pain [Citation2], reducing knee varus torque for patients with knee osteoarthritis [Citation3], and reducing pain for people with flatfeet [Citation4, Citation5]. Insoles are also beneficial for healthy people and may be used to improve balance [Citation6], stability [Citation7], and posture [Citation8].
Insoles are typically designed to minimise local pressure concentrations by redistributing the pressure across large surface areas. The pressure distribution can be altered by changing the geometry or the local material properties (e.g. stiffness, compressibility, and density). Therefore, combinations of multiple materials are often used in the fabrication processes of custom insoles [Citation9].
Traditionally, custom insoles are hand-crafted in-clinic by an orthotist, in a manual process that involves applying materials into a mould or produced in a subtractive process using a milling machine [Citation10]. These processes are typically long and cumbersome and largely depend on the skills of the orthotist [Citation11]. Additive manufacturing technologies and 3D scanning can potentially provide a streamlined, rapid, and low-cost solution for making custom insoles more accessible [Citation12]. Various 3D printing technologies have been used to produce insoles. Selective Laser Sintering (SLS) allows the fabrication of complex and fine-array lattice structures, which may regulate the insoles’ strength and elasticity [Citation13]. SLS may also be employed to generate cell-based designs that improve the strength and toughness of the material [Citation14]. Stereolithography 3D printing technology employs UV-curable resin for creating insoles composed of complex lattices with variable textures made from soft polymers [Citation15, Citation16]. Polyjet technology enables 3D printing with multiple materials to generate different stiffnesses in the insole [Citation17–19]. Although the aforementioned technologies offer benefits such as accuracy, fine details, and tunable stiffness, these technologies require an intensive post-processing phase. In addition, the machines and the materials for these processes are usually expensive [Citation20], and some require special settings such as a dedicated ventilated room. Therefore, these technologies are currently limited in their suitability for fabrication within a clinical setting.
On the other hand, Fused Deposition Modeling (FDM) 3D printing technology utilises low-cost machinery and materials and usually requires less labour-intensive post-processing steps than other 3D printing technologies. In addition, FDM uses thermoplastic materials that can be recycled, unlike the techniques that use thermosets or photopolymers. Indeed, FDM is already currently used for 3D printing orthotic insoles [Citation21–23]. However, there are still challenges and gaps in 3D printing insole using FDM technology. For example, intricate and fine lattice structures are challenging to print because of the need to support overhang geometries and may cause defects at the macro level [Citation24]. Also, the insoles are usually printed lying down on the printing bed, which improves the adhesion to the bed but creates a flat surface on the bottom of the insole that doesn't necessarily match the geometry of the shoe. Finally, these 3D-printed insoles often have a rough surface finish, which requires an additional soft pad to be glued onto the insole to provide smoothness and prevent friction with the foot and sock [Citation25].
The ability to control the stiffness of defined areas of the insole is essential to relieve regions with excessive pressure and increase the support for the foot [Citation26]. Additionally, graded stiffness transitions are more effective in redistributing plantar pressure [Citation27, Citation28]. Traditionally, an assembly of different materials is used to achieve multiple stiffnesses. Although Some FDM 3D printers enable printing with multiple materials, the common approach for creating variable mechanical properties for FDM printing is to define zones of different infill densities across the insole. A dense infill increases the stiffness, and a sparse infill reduces it [Citation29, Citation30]. The main drawback of this approach is that each zone is contained in a boundary. Therefore, creating smooth, gradual transitions between these zones is challenging. Moreover, the outer surface of these insoles is solid, which is perceived as less comfortable and heat-dissipating than porous insoles [Citation31]. Another approach is applying a lattice structure with a range of unit cells to generate functional gradient structures; however, the resolution of such elements is limited due to the constraints of FDM manufacturing [Citation24].
This paper proposes a novel fabrication workflow for producing custom insoles, leveraging 3D Printed Spacers (3DPS), a technique for producing metamaterial structures with a tunable parametric compression behaviour that are light, breathable, and soft [Citation32]. These structures may be 3D printed using low-cost FDM 3D printers. The fabrication of 3DPS is based on an alternative 3D printing workflow, which includes manipulating the printer's toolpath and generating a g-code file directly from custom design software. Unlike the conventional workflow for 3D printing, which is based on slicing software that calculates the perimeter of a layer and then generates infill, 3DPS is based on a single, continuous trapezoid zig-zag toolpath. The zig-zag toolpath travels between two surfaces and is flipped every few layers. This filliping creates an overlap between the layers and generates a perforation pattern on either surface (). Each time the toolpath flips, the polymer is printed mid-air, effectively creating a fibre strand. These strands may be thinner than the nozzle diameter since the filament is pulled while being extruded. The flipping of the toolpath constructs an x-shaped spring between the surfaces, generating a parametric and tunable compression behaviour similar to foams used for cushioning [Citation32].
Figure 1. 3DPS structures based on a trapezoid zig-zag toolpath that travels between two surface faces. The top layer is rendered in black colour.
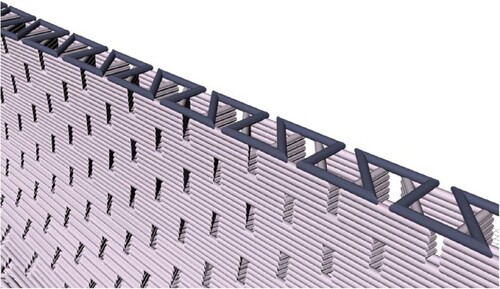
3DPS has previously been explored in the context of 3D-printed textiles. Here, we apply this concept to insoles. Our approach involves 3D printing the insoles on their side rather than the conventional method of printing them lying on the printer's bed. Printing insoles using the 3DPS technique provides several advantages over printing cellular geometry using the standard workflow. Firstly, the printing is more efficient since each layer is composed of a single path, and the printer moves back and forth, eliminating any travel movements. Secondly, the 3DPS structures are lightweight due to the capability to print fine fibre strands mid-air, which can be thinner than those produced using the standard workflow. Lastly, 3DPS allows for the modulation of feed speed and extrusion rate to control graded stiffness variability without changing the toolpath geometry.
We develop a scan-to-print workflow that generates the geometry of the insole based on a 3D scan and then automatically outputs the g-code file for printing the insoles. Our workflow includes automatically generating support structures to support the overhang geometries of the insole in the heel and toe areas. We developed a novel approach for detaching the support structures from the insole after printing, using a hot-wire cutter connected to a 6-axis robotic arm that follows the contour of the insole. In addition, we developed a methodology and a design tool for creating gradual stiffness transitions within the insole based on the input of a grayscale image.
To evaluate the material's mechanical properties, we conducted a series of compression tests, including cyclic load tests, and tests of various thicknesses and samples printed with various printing parameters. We also conducted a user wear test, including pressure distribution tests using a pressure-instrumented pad.
2. Materials and methods
This research aims to examine the feasibility of using 3DPS for custom insole applications. The 3DPS technique is based on Bridging – printing a polymer in mid-air between two surfaces. In the case of 3D printing insoles, we use the geometry of the shoe's footbed (the upper surface of the shoe sole after removing the internal pad) as the first surface and the scanned geometry of the plantar foot as the second surface. The insole is printed upright, positioned on its lateral side, and slightly rotated so that the relatively flat lateral edge is parallel to the build platform. The lateral edge is extended down to the build platform to support the overhang geometry, as illustrated in . After printing, this support extension may be removed using clippers or a hot-wire cutter, as described in section 2.6. Removing the support structure is the only post-processing action needed. After detaching the insole from the support structure, the insole is ready to be worn.
Figure 2. An illustration of the direction of the 3DPS insole. The insole is extended down to the build platform to support overhangs.
The insoles are printed on a Raise3D Pro2 3D printer (Raise3D, Irvine, CA), using a 0.8 mm nozzle. The wide nozzle allows us to print the insole with a 0.55 mm layer height, thus reducing the number of layers and printing time. All the insoles in the present study were designed for the New Balance 2 680 shoes in US size 11. The upper part of the shoe sole was 3D scanned to ensure that the geometry of the insole perfectly fits inside the shoe. To do so, we cut the shoe's upper part and 3D scanned it using a hand-held Artec Eva 3D scanner.
2.1. Underlying research
In our previous study [Citation32], we found that the mechanical compression behaviour of 3DPS greatly depends on the angle between the trapezoid zig-zag strands and the external walls, which generates an x-shape when the path is flipped. We have demonstrated that the optimal angle for maximal energy return and minimal shear deformation is 69°. Therefore, this angle was used in the insole design.
The flipping frequency also affects the compression behaviour of the material, with a smaller frequency translating to reduced energy absorption [Citation32]. In this study, we selected an intermediate value of 5 layers. However, this value can be modified if a different range of stiffnesses is required.
For selecting the printing materials, we have 3D printed samples of 7 commercially available flexible filaments. We produced 3DPS samples using all materials with different feed speeds and material extrusion rates to maximise the printing speed without jamming the material in the extrusion mechanism. Then, we visually and manually evaluated each sample's printing quality, texture and stiffness range. Eventually, we selected Kimya 95 TPU, a flexible printing filament commercially available from Kimya [Citation33].
In the current study, we focus on modulating the structure’s local stiffness by modulating the printing feed speed and extrusion rate, while fixing the other parameters. This approach facilitates automatic workflow for image-based gradual stiffness variation, which is detailed in Section 2.5.
2.2. Compression testing
To evaluate the compression behaviour and durability of the 3DPS material, we conducted a series of compression tests using an INSTRON Electroplus E10000 K dynamic test instrument. First, we tested 3DPS samples with different thicknesses corresponding to different areas in the insole. Then, we tested the compression behaviour after cyclic load tests, to test for durability. Lastly, we tested 3DPS samples printed at different speeds and extrusion rates to examine the range of stiffnesses obtained.
2.2.1. Mechanical testing of different insole thickness
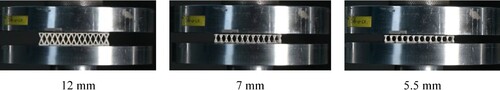
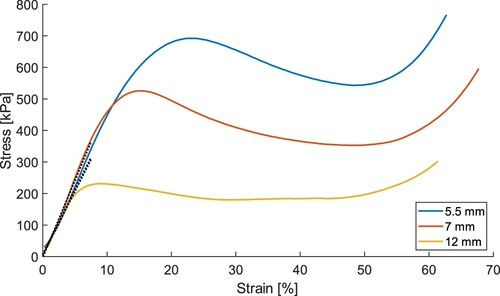
Three insole areas with different approximated thicknesses were tested. A 5.5 mm thickness test sample represents the rearfoot area. A 7 mm thickness test sample represents the transition area between the forefoot and rearfoot, and the foot arch area is represented by a 12 mm thickness sample. Each test sample is rectangular, with horizontal dimensions of 60X70 mm. Three samples were printed and tested in compression at a rate of 5 mm/min (). The force-displacement results were used to obtain the stress-strain curves for each sample, and the corresponding elastic moduli were calculated by fitting a linear line to the stress-strain curve in the elastic domain (< 10% strain).
Figure 3. Material samples in different thicknesses are tested for compression behaviour inside the Instron machine.
2.2.2. Mechanical properties after fatigue
We evaluate the material's durability using a cyclic load test and evaluation of the stiffness. The thickness of the rearfoot area was chosen for the fatigue test because this area is the most loaded during the gait cycle [Citation34]. Six samples of 5.5 mm thickness were printed and subjected to a cyclic compression load at a frequency of 5 Hz. Two samples underwent 100 K cycles, two underwent 200 K cycles, and another two underwent 300 K cycles. The compression rate was set to 5 mm/min, between a minimum load of 5 N and a maximum of 350 N, selected based on a 10.3 N/cm2 rearfoot peak pressure for people with non-obese BMI index [Citation35]. After 24 h of relaxation at room temperature, another compression test was conducted.
2.2.3. Mechanical properties of samples with different stiffnesses
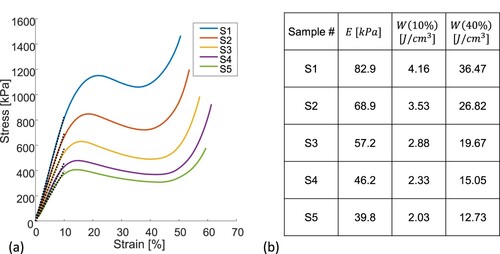
Our design tool enables modulating the speed and extrusion rate during printing based on the sampling of a grayscale image to influence the stiffness by extruding thicker strands between the surface faces of the insole. We conducted an additional compression test to evaluate this modulation's effect on the materials’ compression. We 3D printed five 3DPS samples with identical toolpaths but with different feed speeds and extrusion rates (). The extrusion amount and feed speed parameters are related since the extrusion of more material requires printing at lower speeds. The sample dimensions were 62X69 mm, and the thickness was 6.4 mm. The parameters, weights, and thickness of the internal strands of each sample are detailed in . Test samples with different speeds and E-factors. The samples were tested at a rate of 5 mm/min.
Figure 4. Five samples are printed with the sample toolpath but with different extrusion rates and feed speeds. The parameters weights and weights of each are specified in .
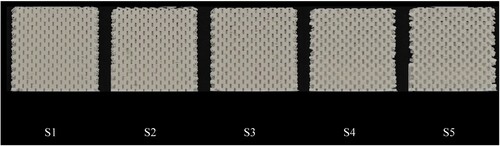
Table 1. Test samples with different speeds and E-factors.
The stress-strain curves were used to compute the elastic moduli (the slope of the linear fit in the elastic region), as well as the energy absorbed per unit volume, W, by a sample subjected to compression up to a strain of . This energy is determined by the area under the stress-strain curve, given by:
(1)
(1) The energy absorbed for each sample was calculated for two regions: in the linear-elastic region (
) and before the onset of densification (
), after which the stress increases rapidly. The integral was computed numerically using the trapezoidal rule.
2.3. Scan-to-print workflow
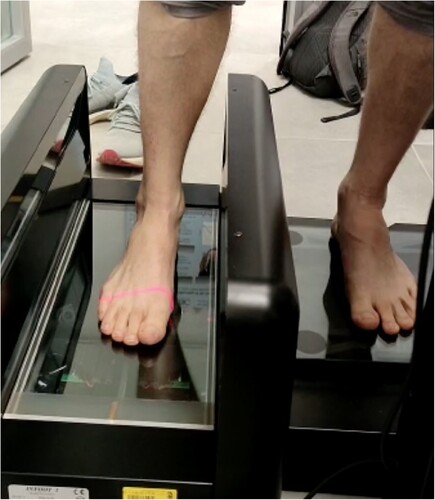
Our workflow for customising the geometry of the insoles is based on a 3D scan of the foot and the projection of curves onto the scan to create the insole's top surface geometry. We scan the feet of the users using the Infoot 2 3D scanner (I-Ware Laboratory Co., Ltd., Osaka, Japan). The foot is scanned while the user stands with the scanned foot on the scanner and the second foot on a scale outside the scanner. The users were asked to put the entire body weight on the second foot, such that the scanned foot lightly touches the scanner’s surface but is not deformed by the contact ().
Figure 5. The scanning of the foot using the I-ware Infoot 2 3D scanner.
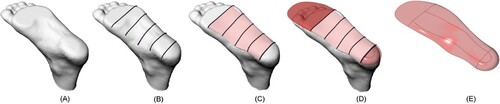
Next, the foot scan is imported into Rhino3D, a Computer-Aided Design (CAD) software. To create the top surface of the insole, we use five curves projected onto the scan. A loft operation between these curves generates a surface that matches the plantar foot geometry. The heel and toe ends of the insole are then added according to the outline of the shoe footbed, as it was extracted from the outline of the shoe‘s internal pad ().
Figure 6. The workflow for creating the top surface of the insole. A 3D scan geometry is imported (A), then 5 lines are projected onto the bottom of the scanned foot (B), a loft operation is executed between the curves (C), and the toe and heel ends are completed based on the insole contour (D). the geometry is joined (E).
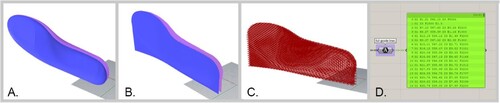
The 3D scanned foot geometry is aligned with the geometry of the footbed at a distance of 5.5 mm in the heel rearfoot area, similar to commercially standard dimensions of insoles [Citation36, Citation37]. Both the footbed and insole geometries are imported into Grasshopper 3D, a plug-in for Rhino. The 3DPS toolpath is applied based on these two surfaces. The spacer's zig-zag path accommodates changes in the thickness between the surfaces. The zigzag toolpath flips every five rows to generate perforations on either side of the insole to provide ventilation for the foot. The toolpath is then translated to a g-code file for 3D printing the insole ().
Figure 7. The toolpath for the insole is generated by importing the surfaces of the shoe footbed (purple) and of the user’s foot (blue) (A). The surfaces are extended to support the overhang geometry in the heel and toe regions (B). The zig-zag toolpath is applied between the surfaces (C). Finally, the toolpath is translated to g-code commands (D).
2.4. Printing time optimisation
The 3DPS technique enables efficient printing since the printing is continuous and there are no rapid movements in the printing process. The printer's head is moving back and forth to complete the insole. Each layer comprises a single zig-zag toolpath; after one layer is complete, the printer moves in the opposite direction to print the next one, and so forth. This eliminates the travel movements between the layers.
To optimise the printing speed, there should be a balance between the machine feed speed and the amount of material extruded by the extrusion motor. The amount of extrusion is determined by the Extrusion value (E value) in the g-code file. To calculate this value, we divide the length of each segment with a factor called the E-factor. The optimisation of the insole printing speed is centred around determining the correct E-factor value. If the E-factor is too low, the printer might push too much material into the nozzle. This might cause the filament to jam inside the extruder. A high E-factor might cause under-extrusion since the motor will extrude less material than needed to fill the layers.
The goal of the optimisation is to find the E-factor that generates a structural and durable insole at the highest possible speed. To this end, we updated the firmware of the Raise Pro2 to the Hyper-FFF settings, which enable printing speeds of up to 200 mm/sec [Citation38]. We also increased the hot end temperature to 250˚C. We 3D-printed insoles at various feed speeds and E-factors, and then examined the structure integrity of the printed insoles.
2.5. Image-based variable stiffnesses
The 3DPS technique enables gradual changes in the effective material stiffness by modulating the printing speed and extrusion amount during the printing of the internal strands between the two surface faces of the insole. Usually, when using slicing software, the feed speed and extrusion amount are defined globally for the entire model. In contrast, using our design tool, the user may assign different feed speed and extrusion rate values for each individual strand within the insole. These values are used as an additional information layer on top of the toolpath, meaning insoles may be generated using a similar toolpath but with different stiffness distributions.
We create a workflow for assigning different feed and extrusion values to the insole inner strands. This workflow is implemented using Grasshopper 3D, illustrated in and . We use a grayscale image map generated from a pressure distribution map measured using Pedar instrumented insoles (Novel, Munich, Germany), where darker gray levels indicate lower pressure and brighter levels indicate higher pressure values. The first and last halves of the stance phase were averaged and used to define the colormaps of the rear and front halves of the insole, respectively. Since the measurements consist of 99 discrete zones for each foot, the image is blurred using image editing software to smooth the transitions between the zones. Next, the blurred image is used to colour the Mesh geometry of the insole. After the zig-zag toolpath is generated, it is divided into straight-line segments. The algorithm then samples the brightness levels of the mesh at the closest point to the centre of each segment. These levels are mapped to a range between the maximal and minimal feed speed and E-factors, and assigned to each strand. The endpoints of each strand are used to generate the g-code lines.
Figure 8. The workflow for generating gradual variable stiffness. The toolpath is divided into segments, and each segment's middle point is used to sample a mesh geometry coloured by an image map. The segments’ endpoints and mapped feed speeds and extrusion rates are used to compose g-code lines.
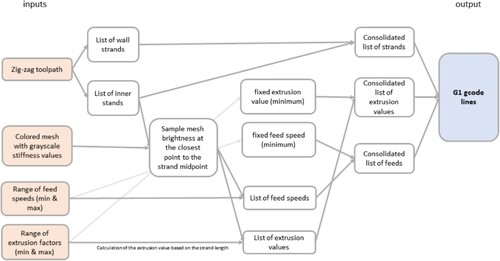
Figure 9. The workflow for creating graded variable stiffness starts with a pressure map (a). Then, the image is blurred (b) and applied to a mesh geometry that is aligned with the insole geometry (c). After the zigzag toolpath is generated, it is divided into segments. The middle point of each segment is sampled, and the brightness value is selected (d). This value is then mapped to the speed and extrusion rate ranges. A slicer g-code speed simulation shows the change in printing speed (e).
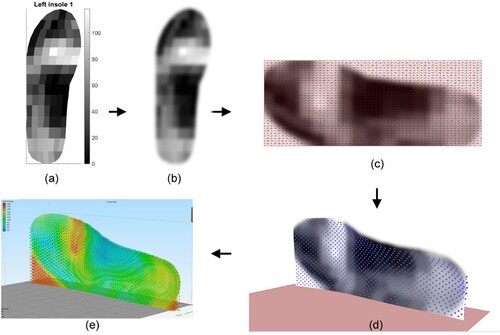
The stiffness distribution in the insole is based on placing softer material underneath high-pressure zones and vice versa, which has been shown effective in redistributing the plantar pressure and reducing its maximum [Citation27, Citation39]. In the workflow, high-pressure regions are brighter and thus mapped to higher feed speeds and E-factors for generating a softer structure. Conversely, darker regions are mapped to lower feed speeds and E-factors, making them stiffer. All the gray levels in between generate smooth and soft transitions in the insole. . (e) shows a visualisation of the printing speed of an insole's g-code file generated using our tool. The cyan areas represent slow printing with more extrusion, and the red and yellow areas represent fast printing with less extrusion. To mechanically evaluate the difference in stiffness, we 3D printed samples of the softest and stiffest zones and three values in between. The results of these tests are described in section 3.4, and the results of their application in the insole design are shown in section 3.5.
2.6. Post-processing cutting using a hot-wire
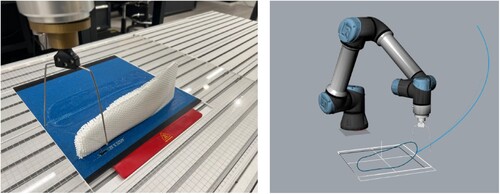
The 3DPS insoles are printed standing on their side. Therefore, the heel and toe areas require support. As mentioned, the insole's surfaces are extended toward the bottom to provide this support. We developed a novel methodology for automatically removing the support material from the insole using a hot-wire cutter. The hot-wire cutter is mounted on a six-axis robotic arm using a custom jig. After printing the insole, we removed the printing bed with the insole from the printer and positioned it near the robot inside a rectangular cavity (, left). This indexes the insole relative to the robotic arm to match the settings in the virtual environment (, right). The hot-wire follows the contour of the insole, cutting the insole out from the support structure. The entire cutting process is shown in a video included in the supplementary material. After cutting, the insole remains slightly attached to the support structure on the printing bed, such that it can be easily separated and ready to be used.
Figure 10. The hot-wire cutter is mounted on the robotic arm (left). The virtual environment matches the physical one. The robot toolpath is derived from the insole's outline (right).
2.7. Walking tests: pressure distribution and questionnaires
In addition to the mechanical testing of the 3DPS materials mentioned above, we evaluated the pressure distribution of the insoles during walking using a Pedar pressure distribution measurement system (Novel, Munich, Germany) [Citation40]. Each Pedar in-shoe sensing pad contains 99 individual pressure sensors, measuring at 100 Hz. For this test, we recruited six male participants who wear US shoe size 11. The participants’ ages, heights, and weights are shown in . All participants were healthy without any pathology in the foot. The participants’ feet were 3D scanned, and a customised pair of insoles was 3D printed for each participant based on the methodology described in section 2.3, with uniform stiffness using a feed speed of 1200 mm/min and an E-factor of 8.
Table 2. The information of the participants in the wear and pressure distribution experiments.
We equipped each participant with a pair of New Balance 680 shoes and measured the pressure distribution during a 3-minute walk on a treadmill at their self-selected constant walking speed, as reported in . We repeated this test for each participant twice: first with the shoe’s original insole and then with our custom 3DPS insoles.
Next, we conducted a wear usage test, in which each participant used the 3DPS insoles for 30,000 steps, equivalent to one week of regular use. The participants used the insole during their daily routine, including sports activities. Moreover, the participants answered a questionnaire regarding the comfort, level of support, weight, usability, fit, and overall impression of the insole.
The plantar pressure raw measurements consisted of a continuous 3-minute time series for each of the 198 pressure sensors in the left and right pads. To process and average the data, each time series was split into separate gait cycles, and only the measurements during the stance phase of each gait cycle were taken (the swing phases were omitted since the pressure vanishes when the foot is off the ground). Then, each stance phase was split into early and late stance, representing the first and second halves of the stance, respectively. Finally, the pressure values were normalised by each participant’s body weight before the average pressure map for all participants was computed.
The total vertical plantar force at any time
was computed from the 99 pressure sensors in each insole, using:
(2)
(2) where
and
are the pressure reading and the area of sensor i and
is the total area of the insole.
3. Results
3.1. Production speed
The result of our printing speed optimisation process indicates that the mean printing time of one full insole is 48 min (± 38 s) when hyper-speed features are used, which is faster than printing using the standard workflow [Citation25]. The robotic hot-wire cutting adds an additional 5 min to the process. The insole is softer when the speed increases. Including stiffer areas in the insole will increase the printing time since it requires printing at lower speeds.
3.2. Compression test of 3DPS in different thicknesses
The results of the compression behaviour of samples with different thicknesses are plotted in . The results show that thinner samples exhibit a higher yield strength (higher stress before the structure starts softening due to buckling). This happens because, as the thickness reduces, the length of the inner strands between the surface faces shortens, therefore, they better resist the compression forces before buckling. The elastic Young's moduli of the three samples shown in , were calculated by fitting a linear slope in the elastic region (up to 5% strain) of the stress-strain curve. The calculated Moduli are 41.0, 48.9, and 40.4 kPa for the 5.5, 7, and 12 mm thick samples, respectively.
Figure 11. Compression test results for test samples with different thicknesses. The strain-stress curves (solid coloured lines) and the linear fits (shown in dashed black lines) in the elastic region of the strain-stress curve (strain < 5%).
3.3. Cyclic fatigue test
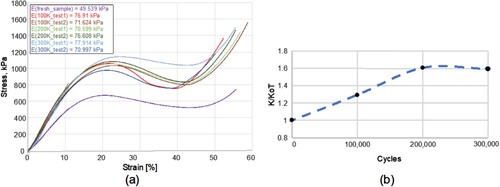
We conducted a cyclic load test to measure how the stiffness changes after the material is fatigued and evaluate its durability over time. The results are shown in . The stiffness of the samples after fatigue tests was compared to the stiffness of a fresh sample. The ratio between the average stiffness of each pair of samples that underwent the same number of cycles and the stiffness of the fresh sample is calculated as K/KoT and presented in .(b). The results indicate that all the samples exhibit a stiffening behaviour, which increases with the number of cycles, with the highest stiffening factor reaching over 1.6. However, this stiffening behaviour is lower than reported in previous research [Citation41].
Figure 12. Cyclic fatigue test results. (A) The stress-strain curve of a sample before (fresh) and after undergoing cyclic loading tests with 100k, 200k, and 300k cycles. The Young’s modulus (E) for each curve is calculated as the slope of the linear fit of the curve in the linear elastic region. (B) The ratio of the difference in Young’s moduli between a fresh sample and samples that underwent cyclic load testing.
3.4. Mechanical properties with different printing values
presents the results of the compression stress-strain behaviour for samples with various printing parameters, as detailed in . The results indicate that as the E-factor and feed speed decrease, the yield strength point, Young’s modulus, and energy absorption in both regimes increase.
Figure 13. Compression test results for the test samples with varying printing parameters. (a) The stress-strain curves (coloured lines) and the corresponding linear fits (dashed black lines) of the curves in the elastic region. (b) The results of the Young’s moduli calculated from the linear fit slopes, and the energy absorbed by the samples in the linear region
and the pre-densification region
, calculated as the areas under the curve.
3.5. Pressure distribution tests during walking
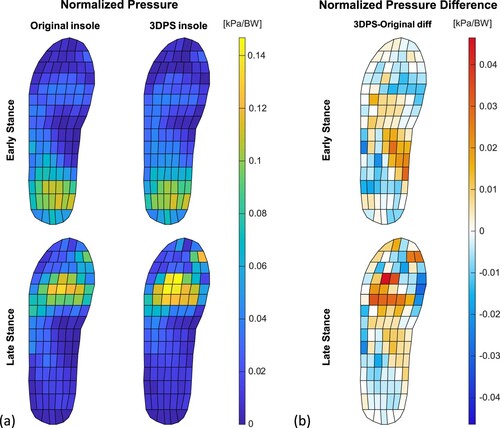
The pressure distribution results are given in , for the experiments comparing the shoe’s original insole and our 3DPS insole printed with uniform stiffness. The results are separated into early stance (0-50% of the stance phase) and late stance (50-100% of the stance phase). The values for each participant were normalised by their body weight before an average map of all six participants was computed. The results of the left and right insoles are averaged and projected on the left insole.
Figure 14. Pressure distribution during walking. (a) The pressure distribution for the original and the 3DPS insoles, averaged across all subjects, after normalising by each participant’s body weight (BW). The top and bottom rows represent the average pressures measured during early stance (from initial foot contact to the middle of the stance phase) and late stance (from mid stance until the foot leaves the ground), respectively. (b) The difference in pressure distribution between the 3DPS and the original insoles.
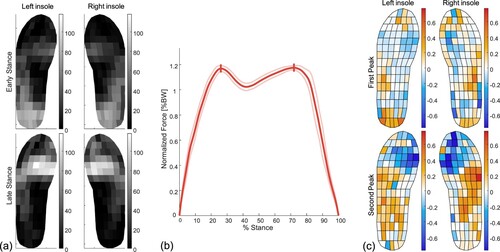
Furthermore, we used the pressure distribution maps of one participant to design and fabricate a pair of variable stiffness insoles, according to the workflow described in section 2.5. The greyscale maps used to generate the variable stiffness distributions are shown in (a), the ground reaction forces and their peaks are shown in (b), and the differences in pressure distribution between the uniform and the variable stiffness insoles at the instances of these peaks are plotted in (c).
Figure 15. Variable stiffness insole results. (a) The pressure distribution results measured using the original insole were converted to a grayscale image, based on which the variable stiffness insole was designed. (b) The ground reaction forces measured during walking are plotted, with the solid red line indicating the median, and the pink lines the range of all steps. The two force peaks were identified, indicated as vertical lines on the plot. (c) The pressure distribution at the time of each peak were analyzed, and the differences between the uniform and variable stiffness insoles are plotted, where warm colours represent increased pressure and cold colour represent decreased pressure in the variable versus the uniform stiffness insoles.
3.6. User study
The results of the user study describe the satisfaction of the participants as expressed in a questionnaire after using the 3DPS insoles. The participants were asked to rate the fit, comfort, and weight of the insoles on a scale of 1–5 (low to high satisfaction, respectively).
The average comfort rating of the insole was 3. Several participants stated that there is a need to get used to the insole and that the comfort improved during use. The average fit rating was 3.7. Several participants indicated the low weight and the ventilated structure of the printed insole as advantages over other orthopedic insoles.
4. Discussion
This work presents a new method for producing custom insoles using the 3D-printed spacer technique. This technique leverages bridging – the ability of FDM 3D printers to print strands in mid-air. Our approach is to modulate the stiffness of the insole by dynamically changing the feed speed and extrusion rate during printing while keeping toolpath geometry fixed. This approach aims to simplify the future fitting of the insoles process since the orthotist or technician will be able to make changes and fine-tune the insoles’ stiffnesses without remodelling the geometry.
The first noticeable advantage of 3DPS is material efficiency and lightweightness. The construction of the 3DPS is efficient in using the materials since it is constructed of printed fibres that are almost perpendicular to the foot, aligned in the direction of the force applied, and resist it effectively. 3DPS are breathable and airy due to the printing technique based on alternating zig-zag paths. This trait is important for insoles since it allows ventilation and air circulation around the foot [Citation31]. Most participants in the wear testing acknowledged this as an advantage for the 3DPS insoles. The average weight of the 6 pairs of insoles printed for the participants was 65 ± 2 g (mean ± standard deviation) per insole, which is almost 50% lighter than other FDM 3D-printed custom insoles at size 11 [Citation19]. In addition, the surface faces of the 3DPS insole are smooth and do not require gluing a pad, which might compromise the breathability of the insole and introduce another post-processing step.
The results of the compression tests carried out with samples fabricated with different printing parameters demonstrate that the effective stiffness and energy absorption capabilities of the 3DPS structures can be controlled by modulating the printing parameters. The Young’s moduli in the range of kPa are orders of magnitude lower than that of the TPU base material, showcasing the structure’s ability to offer tunable mechanical properties that are not attainable with solid insoles. Nevertheless, future work should explore additional important aspects of the mechanical properties, such as shear and dynamic loadings, which occur during walking and running, as well as the effects of environmental conditions (e.g. temperature, moisture, and pH) on the structures’ mechanical properties.
Plantar pressure results previously obtained for both non-obese and obese adult subjects [Citation42], indicate that the pressure values induced in the different areas of the feet fall within the linear elastic region of the stress/strain curve obtained for our samples. For example, the peak rear-foot force for obese subjects was 117 kPa [Citation42], while the rear-foot sample that we tested reached its yield strength point at 700 kPa. The elastic modulus represents relatively high stiffness compared to other 3D printed porous structures used for insole applications [Citation43]. However, the elasticity may be adjusted by selecting different parameters for the extrusion and feed rates, as described in section 2.1.
The results of the pressure distribution on the plantar foot surface during walking demonstrate that the 3DPS custom insole alters the pressure distribution compared to the original insole provided with the shoe. On average, during early stance (from heel strike to mid-stance), the pressure on the heel region was reduced, and the pressure under the foot arch was increased using the 3DPS insole. This is likely due to the added support under the arch in the 3DPS insole, where the original pad is flat and does not come in contact with the arch. During late stance (from mid-stance to toe-off), the pressure distribution was altered as well. Particularly, the pressure in the medial region (under the ball of the big toe) decreased, and the pressure in the central region increased. This might indicate that the 3DPS insole caused a lateral shift in the centre of pressure. The effect of the added support under the arch is also evident during late stance, as the lateral side of the foot has shown to receive decreased pressure, whereas the pressure under the arch has increased. Altogether, these differences indicate that the pressure distribution over the plantar foot surface can be altered by using 3DPS insoles.
In the first set of experiments, the 3DPS insoles were adjusted to each participant only in terms of geometry, not stiffness. Following these results, we designed and fabricated variable stiffness insoles for one participant based on the pressure distribution results from their first experiments, as shown in . These results indicate that, indeed, the stiffness modulated by adjusting the local printing parameters led to changes in the pressure distribution during walking. Particularly, it is evident that the pressure decreased in regions where lower stiffness was prescribed (e.g. under the ball of the big toe and the toe itself during the second peak). Further investigation is required to develop an algorithm capable of prescribing optimal stiffness distribution based on both geometry and loading conditions to achieve the desired plantar pressure distribution throughout the gait cycle, considering both clinical and biomechanical aspects.
Custom 3D printed insole are inserts that improve the fit for mass-produced shoes. As additive manufacturing technologies improve, we see an advantage in printing and customising shoes, including the midsole, thus eliminating the need for custom insoles. Therefore, future research will examine the use of 3DSP for creating a workflow for customising midsoles by generating multiple-layer spacers.
5. Conclusion
The 3DPS technique enables the production of soft, breathable, and lightweight metamaterial structures on low-cost FDM 3D printers, utilising an efficient and optimised toolpath without travel movements. It also processes a smooth texture on the surface faces of the material. The purpose of this research is to develop a methodology for 3D printing insoles using this technique and to evaluate the performance of the insoles.
The result shows that insoles printed using the 3DPS technique are lighter and might be printed faster than 3D printing insoles in a standard workflow. In addition, a gradual transition of stiffnesses may be incorporated. This reduces production steps by eliminating the need to assemble different materials. Also, since a single material is used, the 3DPS insoles are easier to recycle.
Our design tool and methodology allow for customisation based on a foot scan and enable variation in the insoles’ stiffness based on an input image map. This interface may be used as an infrastructure for further research on the clinical fitting of the insole to users of different needs by professional orthodontists and pediatricians. The fitting of the geometry of the foot is based on projected curves onto the scanned geometry of the foot. By manipulating the control points, these curves may be adjusted to accommodate geometry requirements that might be needed in the insole design. Additionally, the input image map may be generated from the pressure distribution measurements and may be manipulated using graphics editing software to drive the effective stiffness based on pathology or other clinical requirements, such as relieving pressure ulcers in diabetic feet or providing arc support for people with flatfeet.
Our vision is that printing insole using our approach will help disseminate the use of 3D printing for orthotic applications in in-clinic settings. Our design tool and fabrication workflow provide orthotists, therapists, and physicians with a tool for creating custom insoles using low-cost equipment, allowing them high-fidelity control over geometry and the distribution of stiffnesses across the insoles.
Disclosure statement
No potential conflict of interest was reported by the author(s).
Data availability
Data will be available upon request from the authors.
Additional information
Funding
References
- Paton J, Bruce G, Jones R, et al. Effectiveness of insoles used for the prevention of ulceration in the neuropathic diabetic foot: a systematic review. J Diabetes Complications. 2011;25(1):52–62. doi:10.1016/j.jdiacomp.2009.09.002
- Chuter V, Spink M, Searle A, et al. The effectiveness of shoe insoles for the prevention and treatment of low back pain: a systematic review and meta-analysis of randomised controlled trials. BMC Musculoskelet Disord. 2014;15(1):1–8. doi:10.1186/1471-2474-15-140
- Kerrigan DC, Lelas JL, Goggins J, et al. Effectiveness of a lateral-wedge insole on knee varus torque in patients with knee osteoarthritis. Arch Phys Med Rehabil. 2002;83(7):889–893. doi:10.1053/apmr.2002.33225
- Gross KD, Felson DT, Niu J, et al. Association of flat feet with knee pain and cartilage damage in older adults. Arthritis Care Res (Hoboken). 2011;63(7):937–944. doi:10.1002/acr.20431
- Banwell HA, Mackintosh S, Thewlis D. Comparison of healing rate in diabetes-related foot ulcers with low frequency ultrasonic debridement versus non-surgical sharps debridement: a randomised trial protocol. J Foot Ankle Res. 2014;7(1):1–18. doi:10.1186/1757-1146-7-1
- Park J-H, Jeon H-S, Kim J-H, et al. Immediate effect of insoles on balance in older adults. The Foot. 2021;47:101768, doi:10.1016/j.foot.2020.101768
- Perry SD, Radtke A, McIlroy WE, et al. Efficacy and effectiveness of a balance-enhancing insole. J Gerontol A Biol Sci Med Sci. 2008;63(6):595–602. doi:10.1093/gerona/63.6.595
- Iglesias MEL, de Bengoa Vallejo RB, Peña DP. Impact of soft and hard insole density on postural stability in older adults. Geriatr Nurs (Minneap). 2012;33(4):264–271. doi:10.1016/j.gerinurse.2012.01.007
- Brodsky JW, Pollo FE, Cheleuitte D, et al. Physical properties, durability, and energy-dissipation function of dual-density orthotic materials used in insoles for diabetic patients. Foot Ankle Int. 2007;28(8):880–889. doi:10.3113/FAI.2007.0880
- Davia-Aracil M, Hinojo-Pérez JJ, Jimeno-Morenilla A, et al. 3D printing of functional anatomical insoles. Comput Ind. 2018;95:38–53. doi:10.1016/j.compind.2017.12.001
- Chhikara K, Singh G, Gupta S, et al. Progress of additive manufacturing in fabrication of foot orthoses for diabetic patients: a review. Ann 3D Printed Med. 2022: 100085, doi:10.1016/j.stlm.2022.100085
- Chen RK, Jin Y, Wensman J, et al. Additive manufacturing of custom orthoses and prostheses – a review. Addit Manuf. 2016;12:77–89.
- Li J, Shu W, Yang Y, et al. Parametric modeling and performance analysis of a personalized insole based on 3D scanning and selective laser sintering. Int J Comput Integr Manuf. 2020;33(9):936–945. doi:10.1080/0951192X.2020.1815849
- Li J, Wei Y, Zhao Z, et al. Improvement of mechanical properties of personalized insole manufactured with selective laser sintering based on process parameter optimization and cell structure design. 3D Print Addit Manuf. 2023;10(5):992–1002.
- De Pasquale G, Barra D. Voronoi lattice-based orthotics with modular stiffness for additive manufacturing. Trans Addit Manuf Meets Med. 2022;4(1):668.
- Zolfagharian A, Lakhi M, Ranjbar S, et al. Custom shoe sole design and modeling toward 3D printing. Int J Bioprint. 2021;7(4). doi:10.18063/ijb.v7i4.396
- Jandova S, Mendricky R. Benefits of 3D printed and customized anatomical footwear insoles for plantar pressure distribution. 3D Print Addit Manuf. 2022;9(6):547–556. doi:10.1089/3dp.2021.0002
- Ranganathan R, Ganesan S. Design and development of customised split insole using additive manufacturing technique. Int J Rapid Manuf. 2018;7(4):295, doi:10.1504/IJRAPIDM.2018.095783
- Hu CW, Nguyen CT, Hölbling D, et al. A novel 3D printed personalised insole for improvement of flat foot arch compression and recoil – preliminary study. Proc Inst Mech Eng Part L: J Mater: Des Appl. 2023;237(2):329–342.
- Pyka W, Jedrzejowski M, Chudy M, et al. On the use of textile materials in robotics. J Eng Fibers Fabr. 2020: 155892502091072, doi:10.1177/1558925020910725
- Choo YJ, Boudier-Revéret M, Chang MC. 3D printing technology applied to orthosis manufacturing: narrative review. Ann Palliat Med. 2020;9(6):4262–4270. doi:10.21037/apm-20-1185
- “About Gensole”. [Online]. Available: http://gensole.com/about/. [Accessed: 29-Oct-2023].
- “3d Printed Insole”. [Online]. Available: https://eryone3d.com/pages/3d-printed-insole. [Accessed: 29-Oct-2023].
- Tang L, Wang L, Bao W, et al. Functional gradient structural design of customized diabetic insoles. J Mech Behav Biomed Mater. 2019;94:279–287. doi:10.1016/j.jmbbm.2019.03.003
- Wang JC, Dommati H, Cheng J. A turnkey manufacturing solution for customized insoles using material extrusion process. In: Kumar L, Pandey P, Wimpenny D, editors. 3D Printing and additive manufacturing technologies. Singapore: Springer; 2019. doi:10.1007/978-981-13-0305-0_18.
- Chhikara K, Sidhu SS, Gupta S, et al. Development and effectiveness testing of a novel 3D-printed multi-material orthosis in nurses with plantar foot pain. Prosthesis. 2023;5(1):73–87. doi:10.3390/prosthesis5010006
- Shaulian H, Gefen A, Biton H, et al. Graded stiffness offloading insoles better redistribute heel plantar pressure to protect the diabetic neuropathic foot. Gait Posture. 2023;101:28–34. doi:10.1016/j.gaitpost.2023.01.013
- Jafarzadeh E, Soheilifard R, Ehsani-Seresht A. Design optimization procedure for an orthopedic insole having a continuously variable stiffness/shape to reduce the plantar pressure in the foot of a diabetic patient. Med Eng Phys. 2021;98:44–49. doi:10.1016/j.medengphy.2021.10.008
- Orsu B, Shaik YP. Compression strength analysis of customized shoe insole with different infill patterns using 3D printing. Open Access Library J. 2022;9(5):1–13.
- Yarwindran M, Sa’aban NA, Ibrahim M, et al. Thermoplastic elastomer infill pattern impact on mechanical properties 3D printed customized orthotic insole. ARPN J Eng Appl Sci. 2016;11(10):6519–6524.
- Yick K, Yu A, Li P. Insights into footwear preferences and insole design to improve thermal environment of footwear. Int J Fashion Des Technol Educ. 2019;12(3):325–334. doi:10.1080/17543266.2019.1629028
- Halbrecht A, Kinsbursky M, Poranne R, et al. 3D printed spacer fabrics. Addit Manuf. 2023;65:103436.
- Factory, K. A. into M. L.-M.-. “No Title” [Online]. Available: https://www.kimya.fr/en/. [Accessed: 01-Aug-2023].
- Petrone N, Faggiano E, Meneghello R. Mechanical properties of orthopaedic insoles under cyclic loads and correlation with daily use. In: Moritz EF, Haake S, editors. The engineering of sport 6. New York (NY): Springer; 2006. p. 427–432. doi:10.1007/978-0-387-45951-6_76
- Birtane M, Tuna H. The evaluation of plantar pressure distribution in obese and non-obese adults. Clin Biomech. 2004;19(10):1055–1059. doi:10.1016/j.clinbiomech.2004.07.008
- Rööser B, Ekbladh R, Lidgren L. The shock-absorbing effect of soles and insoles. Int Orthop. 1988;12(4):335–338. doi:10.1007/BF00317834
- Fong DTP, Lue KBK, Chung MML, et al. An individually moulded insole with 5-Mm medial arch support reduces peak impact and loading at the heel after a one-hour treadmill run. Gait Posture. 2020;82:90–95. doi:10.1016/j.gaitpost.2020.08.109
- “Raise3D Hyper-FFF Printers: Powerful Productivity”. [Online]. Available: https://www.raise3d.com/hyper-fff/. [Accessed: 01-Aug-2023].
- Chen W-M, Lee S-J, Lee PVS. Plantar pressure relief under the metatarsal heads – Therapeutic insole design using three-dimensional finite element model of the foot. J Biomech. 2015;48(4):659–665. doi:10.1016/j.jbiomech.2014.12.043
- “Footwear Pressure Distribution Measurement- Pedar Novel.De”. [Online]. Available: https://novel.de/products/pedar/. [Accessed: 01-Aug-2023].
- Petrone N, Faggiano E, Meneghello R. Mechanical properties of orthopaedic insoles under cyclic loads and correlation with daily Use. Eng Sport. 2006;6(3):427–432.
- Hills AP, Hennig EM, McDonald M, et al. Plantar pressure differences between obese and non-obese adults: a biomechanical analysis. Int J Obes. 2001;25:1674–1679. doi:10.1038/sj.ijo.0801785
- Ma Z, Lin J, Xu X, et al. Design and 3D printing of adjustable modulus porous structures for customized diabetic foot insoles. Int J Lightweight Mater Manuf. 2019;2(1):57–63. doi:10.1016/j.ijlmm.2018.10.003