
 ?Mathematical formulae have been encoded as MathML and are displayed in this HTML version using MathJax in order to improve their display. Uncheck the box to turn MathJax off. This feature requires Javascript. Click on a formula to zoom.
ABSTRACT
Coarse – and fine-grained bimodal-structures in a Al-Mg base alloy with rare earth elements of Sc/Zr is produced due to the ultrafast nonequilibrium solidification occurs in laser-induced molten pools during laser powder bed fusion (LPBF) additive manufacturing. A novel high-fidelity cellular automaton (CA) algorithm incorporating numerical calculations of molt-pool temperature fields elucidates the formation and evolution of the bimodal-structure. Subsequent heat treatment induces precipitation of Al3(Sc/Zr) particles within the grains, synergistically enhancing strength and plasticity of the LPBF-processed alloy. The crystal plastic finite element method (CPFEM) is used to reveal the synergistic effect between the strength and plasticity during the material tensile procedure. The bimodal-structure exhibits good fatigue resistance but intriguing anisotropy under low stress cyclic loading. It is proved that differentiated distribution patterns relative to the principal stress direction of the bimodal-structure have a significant influence on its fatigue performance. Numerical evolutionary of the bimodal grain deformation reflects this phenomenon.
1. Introduction
The aviation and aerospace industries have stringent requirements for the comprehensive mechanical properties of lightweight aluminum alloys [Citation1]. Additive manufacturing (AM) has become popular for producing geometrically complex components of aluminum alloys. As a mainstream process method in several branches of metal AM technology, laser powder bed fusion (LPBF) brings a popular and viable solution to offer high forming accuracy [Citation2], low surface roughness [Citation3], a streamlined manufacturing process [Citation4], and refined microstructures with high strength [Citation5,Citation6]. Nevertheless, the LPBF faces challenges when applied to some common industrial aluminum alloys such as 2XXX [Citation7], 6XXX [Citation8,Citation9], and 7XXX [Citation10] series, including micro-cracks during rapid melting-solidification processes, limited plasticity or toughness, and potential alloy embrittlement.
Recently, Scandium (Sc) and Zirconium (Zr) modified Al-Mg-based Scalmalloy® alloys developed by Airbus Group [Citation11] have attracted attention due to their excellent formability in the LPBF processes. The Al-Mg-Sc-Zr alloy can achieve a quasi-static tensile yield strength exceeding 500 MPa at room temperature while maintaining excellent ductility [Citation12,Citation13]. The bimodal heterostructure generated by LPBF plays a crucial role in achieving high-strength characteristics in this alloy. Furthermore, Heat treatments can further enhance the strength of the LPBF-processed Al-Mg-Sc-Zr alloy [Citation14]. The bimodal heterogeneous structure is mainly manifested in (i) the coarse-grained (CG) zones at the centre of the melt pool, and (ii) the fine-grained (FG) zones near the melt pool boundary. In order to understand the mechanical behaviour of Al-Mg-Sc-Zr alloy, it is necessary to study the formation mechanism of the alloy's bimodal structure.
Presently, a significant number of scholars are directing increased attention towards investigating the fatigue properties of L-PBF aluminum alloys [Citation15]. Based on prior research, the finer grain structure induced by the L-PBF process has demonstrated a favourable influence on the material's dynamic mechanical behaviour [Citation16]. It is well-established that the fatigue performance of materials under dynamic cyclic loading is highly susceptible to microstructural characteristics [Citation17]. For example, Zhang et al. [Citation18,Citation19] conducted an in-depth study on the fatigue resistance of the unique honeycomb microstructure of additively manufactured 304L. However, there is a scarcity of studies focusing on the fatigue properties of the bimodal heterogeneous microstructure arising from the Al-Mg-Sc-Zr alloy fabricated through the L-PBF process. The presence of inevitable defects such as pores, lack of fusion, and thermal cracks during the L-PBF process poses a critical challenge to the material's fatigue performance [Citation16]. Furthermore, the material's anisotropy resulting from the L-PBF process introduces significant complications in evaluating fatigue performance. Consequently, there is a keen interest in exploring the impact of non-uniform microstructure and the distinctive features of bimodal heterogeneous microstructures on fatigue crack initiation originating from process-induced defects, as well as the propagation of crack fronts within non-uniform microstructures.
Computer numerical simulation techniques are commonly used to deduce microstructural evolution in metallic materials. In this study, we proposed utilising computer numerical simulation to investigate the relationship between the LPBF process parameters and bimodal heterostructure formation. The evolution simulation of grain structures is closely related to thermal gradients and temperature fields. Given the unique characteristics of the laser heat source in the LPBF process, finite element method (FEM) [Citation20] simulations are often employed to model complex thermal field variations within the laser-induced melt pool regions, allowing for coupling with microstructure evolution during melting-solidification procedures. Various methods can be used for grain growth modelling, including phase field (PF) [Citation21], Monte Carlo (MC) [Citation22], cellular automata (CA) [Citation23], and empirical rules [Citation24]. Among these methods, the CA offers substantial flexibility, computational efficiency, and scalability for large-scale grain computations. The MC method disregards the underlying physical mechanisms of grain growth, relying on the principle of minimum interfacial energy. The CA describes the evolution of complex material systems through local rule formulations, exhibiting substantial flexibility, high computational efficiency, and the ability to compute large-scale grains. The CA, initially developed by Rappaz and Gandin [Citation25] for simulating grain structures during solidification in castings, has since been widely employed under more complex working conditions. For instance, Zinovieva et al. [Citation23] utilised a combination of CA and FDM to accurately predict the development of coarse columnar grains in an LPBF-processed titanium alloy. Mohebbi and Ploshikhin et al. [Citation26] applied the CA method to simulate the epitaxial growth of grains at the bottom of the laser-induced melt pool in an LPBF-built AlSi10Mg alloy. Consequently, given the bimodal heterostructure of the LPBF-processed Al-Mg-Sc-Zr alloy, the CA method offers enough operability, although limited research has been conducted in this domain. Therefore, utilising the CA to investigate and elucidate the mechanism underlying the bimodal heterostructure evolution visually represents an ideal research approach in this work.
The mechanical properties of metallic materials are closely tied to their microstructures and have been extensively studied by researchers. Traditional approaches rely on destructive mechanical tests to determine material performance parameters under various microstructures, establishing correlations between them. However, material computation using the crystal plasticity finite element (CPFEM) method offers cost advantages over traditional methods as it allows for investigating the relationship between microstructure and macroscopic properties without extensive testing [Citation27]. In recent years, the CPFEM based on material microstructure has gained popularity due to its advancements in computational technology. Pei et al. [Citation28] successfully used the CPFEM method to perform cross-scale numerical simulations and then successfully predicted texture evolution during the expansion and compression of aluminum alloy sheets. Chakrabarty et al. [Citation29] employed the CPFEM method to investigate the tensile deformation process of additively manufactured AlSi10Mg alloy, finding that the structural fragility was related to the fabrication process parameters. Shiraiwa et al. [Citation30] utilised the CPFEM method to calculate the local plastic strain to predict the fatigue-crack sprouting life based on reconstructed microstructure models. Hence, the CPFEM method provides a practical approach for studying the mechanical properties of metallic microstructures and is expected to facilitate studying the relationship between bimodal heterogeneous microstructure and macroscopic properties in our work.
Here, we aim to investigate the evolution of bimodal microstructure and its influence on tensile properties in the LPBF-processed Al-Mg-Sc-Zr alloy. To achieve this, we propose a novel algorithm combining the FEM and three-dimensional (3D) CA methods to visually elucidate bimodal heterostructure formation during the LPBF. Additionally, our innovative algorithm examined the influence of the bimodal heterostructure on the combined mechanical properties of the LPBF-processed Al-Mg-Sc-Zr alloy with the assistance of the CPFEM. Finally, the effects of bimodal structures with different distribution patterns on fatigue life under cyclic loading were further analyzed and studied. Our research outcomes offer a significant theoretical basis for designing heterogeneous alloys fabricated through the LPBF, which are experiencing growing demand in contemporary research and development endeavours of 3D-printed lightweight structural components.
2. Materials and experimental methods
2.1. Powder materials and L-PBF experimental details
Al-Mg pre-alloyed powder incorporating Sc and Zr elements was synthesised through vacuum-induced gas atomisation (VIGA) technology. The chemical composition, Al-3.29Mg-0.42Mn-0.39Sc-0.42Zr (wt.%), was determined using inductively coupled plasma atomic emission spectrometry. illustrates the morphology of the powder employed in the L-PBF process. a and b reveal predominantly spherical powder particles with sizes ranging from 15 to 53 μm, following a normal distribution pattern. Prior to L-PBF construction, the powder underwent an 8-hour storage period in a vacuum-drying oven.
Figure 1. Gas-atomized Al-Mg-Sc-Zr alloy powder and LPBF processing scan strategy: (a) SEM morphology of the pre-alloyed powder; (b) powder particle-size distribution; (c) schematic diagram of scan strategy No. 1; (d) schematic diagram of scan strategy No. 2; (e) schematic diagram of scan strategy No. 3.
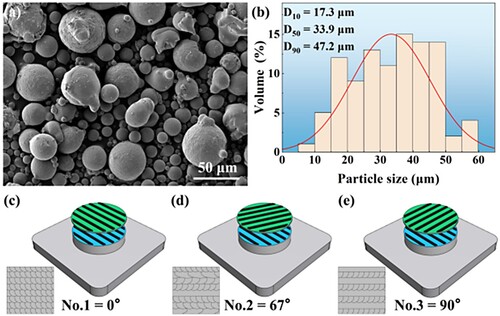
as-built samples were fabricated using a commercial L-PBF160 powder machine equipped with a 500 W laser (1064 nm wavelength, 60 μm spot diameter). The machine utilises a downward powder feeding method and a scraper powder spreading system, offering a maximum forming size of 160 mm (X) × 160 mm (Y) × 200 mm (Z). Argon gas served as the protective atmosphere during printing, maintaining oxygen content below 300 ppm to prevent oxidation. A 5083 aluminum alloy substrate, preheated to 120 °C, mitigated thermal stress during printing, averting component deformation and cracking. Material density optimisation employed the Archimedes method. Under optimised parameters (360 W laser power, 0.09 mm hatch distance, 800 mm/s laser scanning speed, and 0.04 mm layer thickness), a densification level of 99.4% was achieved (see Figures S1a and c in the supplementary material). Samples built on vertical and horizontal substrates were designated as V and H, respectively.
To investigate the influence of scanning strategies on material fatigue properties, three strategies (c, d, e and Figure S2 in the supplementary material) were employed. For consistency and to minimise thermal stress, all samples not explicitly discussed in the article adopted scanning strategy No. 2 (67° scanning deflection between adjacent layers). Some printed samples underwent aging at 300 °C for 3 hours.
2.2. Microstructural characterisation
Metallographic samples were cut, ground and polished according to standard procedures, and stress-relief polished using a vibration polisher (VibroMet® 2/Shanghai Yuanpai). Etch with Keller reagent composed of HF (1 ml) ∼ HCl (1.5 ml) ∼ HNO3 (2.5 ml) ∼ H2O (95 ml) for 10–30 s. The microstructure after corrosion was observed using an optical microscope (BC4K-36/Bochi Electronic Technology). A field emission scanning electron microscope (SEM) instrument (Mira 3XH, TESCAN Co., Ltd., Czech Republic) equipped with an electron backscatter diffraction (EBSD) detector (Max 3, Oxford Co., Ltd., UK) and an energy dispersive X-ray spectrometer (EDS) detector (Aztec X-MaxN80, Oxford Co., Ltd., UK). EBSD scans were performed at two different step sizes of 0.3 and 0.04 microns, depending on the size of the feature area of interest. Use the AZtecCrystal software package to obtain data information such as grain size and morphology from EBSD data. Precipitated phase analysis was performed using a transmission electron microscope (Talos F200X S/Opton Co., Ltd., TEM). The preparation of TEM samples includes: cutting slices with a thickness of 0.7 mm using a linear EDM device, reducing the thickness to about 50 μm using silicon carbide polishing paper, and then thinning to electron transparency using dual-jet electrolysis. Use Fast Fourier Transform (FFT) and Inverse Fourier Transform in Digital Micrograph software to process the Selected Area Electron Diffraction (SAED) pattern, and compare it with the standard material PDF card. X-ray diffractometer (D/max2550VB/PC, XRD) was used to analyze the microstructure and phase of the sample. Use Jade software to process XRD-related data.
2.3. Mechanical testing
Hardness testing was performed on a Vickers microhardness tester (HSX-1000/Shanghai Optical Instrument Company). The load is 0.01 kg, the holding time is 10 s, and 20 points are tested at the centre (CG area) and boundary (FG area) of the molten pool. Tensile specimens were tested on a universal testing machine (STS 100 K/Instron) equipped with an extensometer, with a chuck speed of 5 mm/min at room temperature. Three parallel experiments were conducted on each sample under various processes (see Figure S1b in the supplementary material for the dimensions and physical images of the tensile specimens). Before the fatigue test, the sample surface was ground with 2000-grit SiC sandpaper and then polished using 2.5 μm diamond suspension. A surface roughness with a Ra value of 0.2 measured by using a profilometer was obtained (see Figure S1d in the supplementary material for dimensions and physical images of the fatigue specimens). Uniaxial stress-controlled fatigue tests (SUNS890 machine) were conducted at room temperature, stress ratio R = 0.1, frequency 25 Hz, and different stress amplitudes from 90 MPa to 150 MPa. Three parallel tests were conducted under each stress condition. The stress-to-failure cycle (S-N) curve of as-aged Al-Mg-Sc-Zr alloy was obtained, and the fatigue life limit was defined as 107 failure-free cycles.
2.4. Numerical modelling method for grain growth
With the temperature-field modelling described above, the thermal variation data and temperature boundary conditions can be provided for the grain-growth modelling of the LPBF (see the temperature field calculation section in the supplementary materials, including Figures S3 and S4). In this work, the modelling of microstructural evolution was based on the CA method to reproduce the formation and growth of the grains and grain-structural textures during the LPBF process. The basic principle of the CA lies in using simple local evolutionary rules to drive complex holistic phenomena [Citation31]. Here, a three-dimensional Von Neumann-type 6-neighbour CA method (see Figure S5 in Supplementary Material) is selected to maximise the simulation's realistic credibility while reducing the computational effort.
For the face-centred cubic (FCC) structured aluminum alloys, since the <100 > direction is the preferred direction for dendrite growth [Citation26], the corresponding grain structure is an octahedron with the preferred direction as the vertex, and the spatial 3D Euler angles are used to describe the orientation information of each grain. In addition, the microstructural evolution process consists mainly of grain nucleation and growth. The grain nucleation rate is calculated according to the following equations:
(1)
(1)
(2)
(2) where
is the nucleation rate,
is the factor before the exponential term,
can be approximated as a constant due to the significant influence of the exponential term,
is the free energy change caused by supersaturation,
is the Boltzmann constant, and
is the thermodynamic temperature,
is the free energy of the solid crystal surface, and
is the latent heat of solidification of the metal. First, determine the phase of the material according to the evolution of the temperature field:
(3)
(3) where
is the material phase state parameter (0 means a liquid state, 1 means a solid state),
is the grain orientation Euler angle,
is the material temperature,
is the liquidus line,
is the solidus line, and
is the random Euler angle. After the initial phase state information is calculated, the grain nucleation is calculated according to the following formula:
(4)
(4) where
is the material nucleation rate. After grain nucleation, the grain growth process is calculated according to the following formula:
(5)
(5)
(6)
(6) where
is the number of neighbour solid cells of the target cell,
is the material Euler angle corresponding to the minimum included angle,
is the rotation matrix of the Euler angle,
is the unit gradient vector, and
is the temperature field gradient vector. After the nucleation and growth model of grains, the whole process of the grain microstructural evolution is completed.
2.5. Numerical modelling methods for crystal plasticity mechanics
CPFEM is a crucial method for studying the mechanical response and deformation mechanism of metallic materials. The deformation of crystals is composed of elastic deformation and plastic deformation. The total deformation gradient can be decomposed into elastic and plastic parts:
(7)
(7) The total velocity gradient
can also be divided into two parts: elastic
and plastic
:
(8)
(8)
(9)
(9) where
is the slip velocity on the slip system
,
is the slip direction,
is the normal direction of the plane, and
is the number of slip systems (
).
is a function of the resolution shear stress
and the critical resolution shear stress
.
(10)
(10)
(11)
(11)
(12)
(12) where
and
represent the reference slip rate and velocity sensitivity exponent,
is the second Piola-Kirchhoff (PK2) stress,
is the hardening rate of a single slip system, and
represents the contribution of the out-of-plane system to hardening. The above equations can be implemented in ABAQUS using Huang's [Citation32] user material subroutine.
The above experiments and models were conducted using the parameters in . The 3D heat transfer equations were solved using the heat transfer model of commercial software ABAQUS in this work. A material area of 1 × 0.3 × 0.1 mm (length, width, and height) was built. A heat source subroutine (dflux.for) was generated using the open-source WeldFlux16 plug-in, in which the heat source model parameters of the laser were set. Moreover, the first-order 3D heat transfer cell DC3D8 (eight-node linear heat transfer hexahedral cell) was applied to all meshes. The obtained temperature field was imported into the MATLAB software. Then, the microstructure evolution process was modelled by writing a meta cellular automata algorithm programme in MATLAB. Based on the EBSD raw data of the microstructure, material information such as grain organisation and corresponding Euler angles were obtained using the MTEX plug-in in MATLAB. Besides, the first-order linear 3D stress cell C3D8 was used to construct the Standard Model in the ABAQUS. After neglecting the influence of precipitated phases, the grain structure and Euler angle information are written into the model file. Finally, the subroutine UMAT was used for finite element calculation.
Table 1. The tensile properties of samples from different processes.
3. Results
3.1. Microstructures
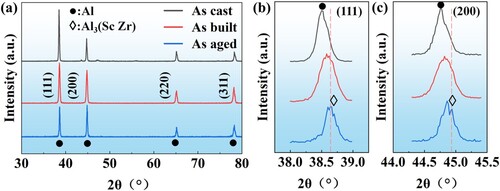
shows the XRD spectra of Al-Mg-Sc-Zr alloy formed by different manufacturing processes. Due to the low content of Sc and Zr elements, the Al3(Sc/Zr) phase was not directly observed. However, a significant shift of the a-Al diffraction peak was found, and it is known that the shift of the diffraction peak may be related to the residual stress, chemical composition, and microstructure (precipitate) in the sample [Citation33]. Because ageing treatment reduces residual stress and promotes the precipitation of the Al3(Sc/Zr) phase, which in turn causes the a-Al diffraction peak to shift to a high angle [Citation13,Citation34,Citation35].
Figure 2. XRD patterns of the Al-Mg-Sc-Zr alloys: (a) comparing samples under different processes in the XRD pattern range of 30∼80°; (b, c) the enlarged images.
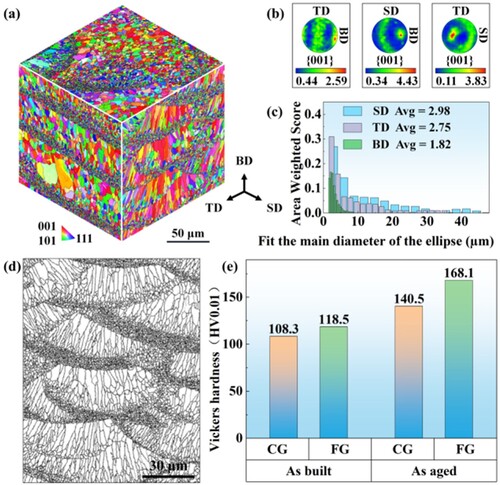
shows the EBSD analysis results of the as built sample. The pseudo-3D view of the IPF-X map is shown in a, which shows the structural distribution of grains in the melt channel under the No. 1 scanning strategy (see Figure S6 in the Supplementary Material). On three planes, it can be seen from the PF diagram in that due to the large number of randomly distributed orientations in the FG area, the overall texture intensity is not too high (Multiple uniform density (MUD): 2.59∼4.43). However, when only the CG region is considered, the PF intensity of the CG region is significantly higher than that of the overall region (see Figure S7 in the Supplementary Material). The grain size distribution diagram is shown in c. The average grain size is 2.98 μm in the SD direction, 2.75 μm in the TD direction, and 1.82 μm in the BD direction (the main diameter of the fitting ellipse). d depicts the grain boundary (GB) diagram illustrating the cross-section along the BD of the specimen. This diagram exhibits the fish-scale melt pool morphology. The FG-zone is predominantly located at the edge of the melt pool, while the CG-zone lies at the centre of that. e shows the average microhardness values obtained by testing the FG zone and CG zone separately. Mainly by testing the boundaries and centre of the solidified melt pool separately (see Figure S8 in the supplementary material). The average microhardness values for the CG-zone and FG-zone of the L-PBF sample were measured as 108.4 ± 3 HV0.01 and 118.5 ± 3 HV0.01, respectively. Notably, after the HT processing, the FG – and CG-zones of the L-PBF + HT sample exhibited significantly increased average microhardness values of 140.5 ± 5 HV0.01 and 168.1 ± 5 HV0.01, respectively.
Figure 3. (a) Pseudo-3D view composed of EBSD inverse pole figure (IPF_X) of the as-built sample showing the microstructure;(b) EBSD pole figures (PF) on three different planes;(c) Particle size distribution map of each surface in the three-dimensional view;(d) EBSD grain boundary image in the SD direction (GB);(e) Microhardness of bimodal heterostructure.
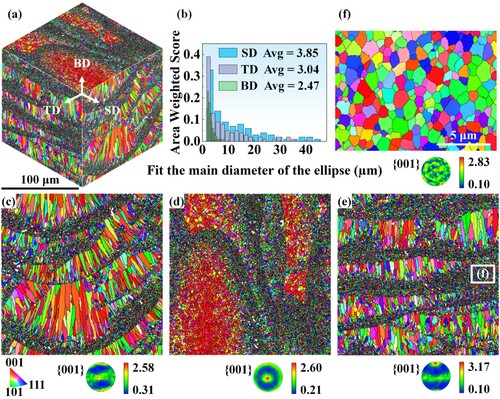
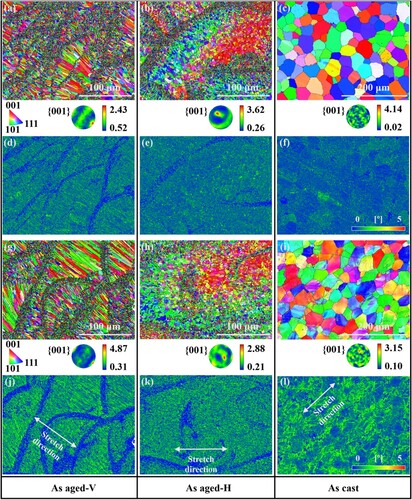
illustrates a compilation of Electron Backscatter Diffraction (EBSD) results acquired from an Al-Mg-Sc-Zr alloy subjected to ageing. a depicts a pseudo-three-dimensional visualisation of the inverse pole figure (IPF-X mapping). Demonstrates the arrangement of the grain structure in the melt channel under the No. 1 scanning strategy. The corresponding grain size distribution diagram across three planes is presented in b. In the SD Direction, the average grain size measures 3.85 μm, while in the TD Direction and BD Direction, it is 3.04 and 2.47 μm, respectively (referring to the major diameter of the fitting ellipse). Analysis of the IPF diagram reveals the formation of an inhomogeneous bimodal heterogeneous grain structure in the as-aged sample. This structure comprises an FG zone localised at the melt boundary and a CG zone in other areas of the melt pool. The equiaxed grains in the FG zone are exemplified in f, with an average grain size of approximately 1 μm. Conversely, the columnar grains in the CG zone can attain a longitudinal size of up to 50 μm, primarily resulting from the epitaxial growth of grains in the FG zone. An intriguing observation is the relatively random grain orientation in the FG zone, while the CG zone exhibits a high degree of consistency, as corroborated by the Pole Figure (PF) diagram. This alignment is attributed to the favourable <001 > direction for the growth of FCC materials. The No. 1 scanning strategy induces the maximum thermal gradient pointing towards the BD and SD directions during the L-PBF process, acting as a significant driving force for the rapid epitaxial growth of grains in the <001 > direction. The directional growth of columnar grains results in distinct microstructures on the three surfaces of the sample. The SD direction manifests a fish-scale bimodal heterogeneous grain structure, comprising both FG and CG. The TD direction predominantly features a layered bimodal heterogeneous grain structure. In contrast, the BD direction exhibits diverse distribution patterns of FG and CG zones, with the latter appearing as larger-sized equiaxed crystal morphologies, representing the cross-section of long columnar grains.
Figure 4. EBSD revealed the microstructure of as-aged samples: (a) Pseudo three-dimensional view of inverse pole plot (IPF_X); (b) Grain size distribution map of each surface in a three-dimensional view; EBSD results (IPF_X, and PF plots) on planes perpendicular to the SD (c), BD (d), and TD (e) directions; (f) An enlarged view of the box area in Fig (e).
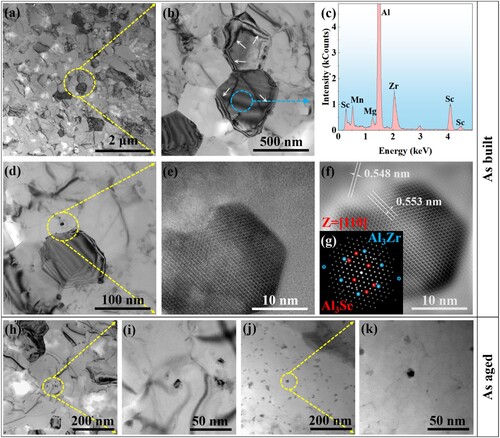
a presents a TEM image of the as-built sample, revealing the FG zone with numerous grains measuring less than 500 nm. b exhibits nearly equiaxed grains, with the arrow-marked GBs, in the FG zone. The presence of solid solution Sc and Zr elements within the grains in the FG zone is evident in c. Figures 5d, 5e, 5f, and 5 g showcase Al3(Sc/Zr) precipitates, each approximately 10 nm in size, formed during the moulding process of the as-built sample. Notably, the Al3(Sc/Zr) precipitation demonstrates high coherence with the Al matrix grains (as depicted in f). Moreover, the SAED speckle pattern ( g) indicates that the two precipitated phases, Al3Sc and Al3Zr, tend to intergrow and form a eutectic lattice (see Figure S9 in the supplementary material). Moving on to the as-aged sample, Figures 5h, 5i, 5j, and 5k display TEM images highlighting a significantly higher density of Al3(Sc/Zr) precipitates compared to the as-built sample.
Figure 5. TEM Analysis of as-built and as-aged samples: (a) TEM overview image of the microstructure in the FG zone; (b) further magnified image of the yellow zone in (a), reflecting the morphology and size of the grains in the FG zone, with arrows highlighting the GBs; (c) energy spectrum of the elemental composition of the blue zone in (b); (d) reflecting the distribution of Al3(Sc/Zr) precipitates distribution in the FG zone; (e) enlarged view of the yellow zone in (d), showing the shape and size of the precipitates; (f) Al3(Sc/Zr) particles showing coherence through fast Fourier transform (FFT) and inverse Fourier transform for (e). Distribution diagrams (h and j) and enlarged diagrams (i and k) of Al3(Sc/Zr) precipitation in as-aged samples.
3.2. Tensile and fatigue properties
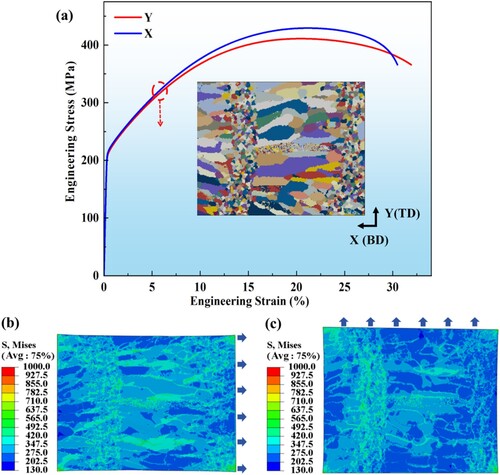
illustrates the quasi-static tensile properties of Al-Mg-Sc-Zr samples processed through as-cast, as-built, and as-aged methods at room temperature. The tensile characteristic curves for the three specimen types manifest distinct features. The as-cast specimen exhibits a smoother stretching curve. In contrast, the tensile curve for the as-built sample displays a pronounced sawtooth effect during the strengthening stage, indicative of the typical Portevin-Le-Chatelier (PLC) effect. Generally observed in aluminum-magnesium-based alloys, the PLC effect is associated with the dynamic interaction between solute atoms and mobile dislocations during plastic deformation. We posit that the L-PBF process introduces higher residual stress and finer grain size, thereby amplifying the PLC effect. Upon undergoing the ageing process, the as-aged sample reveals a substantial presence of nanoscale secondary Al3(Sc/Zr)-L12 dispersion. This dispersion serves to restrict the movement of dislocations, consequently mitigating the sawtooth effect in the tensile curve. The ageing process contributes to a weakened PLC effect, emphasising the role of nanoscale precipitates in influencing the mechanical behaviour of the alloy.
Figure 6. (a) Engineering stress-strain curves of tensile properties of samples with different processes and construction directions; (b) True stress-strain curves of tensile properties of samples from different processes and construction directions.
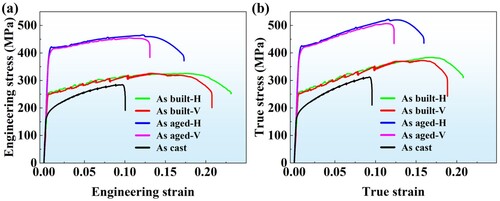
The tensile property parameters of the material are obtained according to the tensile property curve in . The yield strength (YS) of the as-cast sample is 161 ± 1 MPa, and the elongation at break (EL) is 9.87 ± 0.02%. In comparison, the YS of the as-built sample is 248 ± 3 MPa, and the EL is 20.69 ± 0.02% (V) and 23.16 ± 0.03% (H) respectively. Compared with as-cast samples, its YS and EL increased by 54% and 109∼135% respectively. The YS of the as-aged sample obtained after the as-built sample was aged at 300 °C for 3 hours reached 420 ± 1 MPa, and the EL reached 13.08 ± 0.02% (V) and 17.30 ± 0.03% (H) respectively.
The tensile curve can reflect the influence of different processes on the properties of Al-Mg-Sc-Zr alloy. First of all, compared with the traditional casting process, the L-PBF process not only slightly improves the strength properties of the material, but also mainly enhances the plastic deformation properties of the material, and has a good ability to suppress plastic instability. The ageing process after the L-PBF process further greatly improves the strength properties of the material at the expense of part of the plastic deformation ability. In addition, the EL difference between V and H samples also reflects the anisotropic characteristics of the L-PBF process.
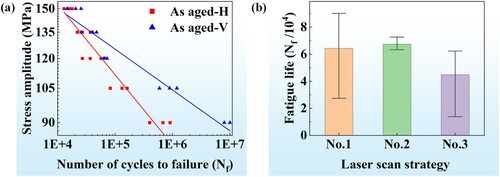
The S-N curve for the as-aged Al-Mg-Sc-Zr alloy sample is shown in a. The σa = σ′f * (2Nf)b curve obtained by Basquin fitting is also plotted in the figure, where σ′f and b are the fatigue strength coefficients and indices, Nf is the number of cycles to failure, and σa is the stress amplitude. Among them, the fatigue strength of the sample in the V direction corresponding to Nf = 107 is 86.8 MPa, compared with that of the sample in the H direction, which is only 58.6 MPa. Considering that the tensile properties of as-aged samples have anisotropic characteristics. We attribute the difference in fatigue strength in the V and H directions to the bimodal heterogeneous grain structure caused by the L-PBF process. Different grain structure distribution characteristics are highly sensitive to cyclic loading. In order to further study the influence of structure on cyclic loading, the fatigue life of as-aged samples under three scanning strategies was compared at 120 MPa. The results are shown in b, in which the sample with No. 2 (67° deflection between layers) scanning strategy has the highest average fatigue life and the smallest life error. This further illustrates that the microstructural differences formed by different scanning strategies have a significant impact on fatigue life. We will discuss this further in later chapters.
Figure 7. (a) S-N data of fatigue tests on samples with different L-PBF building directions at R = 0.1; (b) S-N data of fatigue tests on As aged-V samples with different scanning strategies at R = 0.1 and 120 MPa stress amplitudes.
3.3. Numerical calculation results
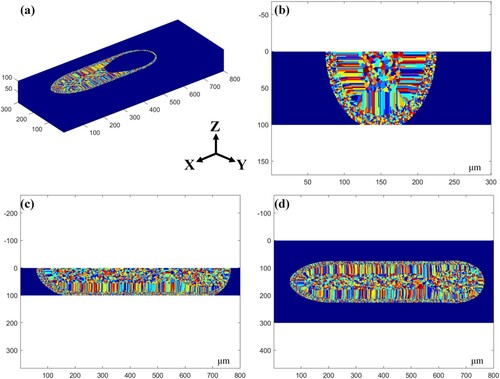
During laser-induced melt pool melting and solidification, computational modelling of the temperature field and subsequent data analysis are basic requirements for grain growth modelling. The thermal field of the L-PBF process is complex. Here, a double ellipsoid Gaussian heat source is used, which is characterised by transient heat transfer (see supplementary material Figure S3). The temperature field of L-PBF is obtained through numerical calculation (see supplementary material Figure S4). 3D-viewed microstructural evolution procedures of the LPBF-processed Al-Mg-Sc-Zr alloy, after coupling the temperature field using the principle of CA, simulated by MATLAB numerical calculation, are illustrated in . From the three-dimensional diagram and cross-sectional view of the single melt channel in , it can be found that the numerical calculation results of the grain transformation reflect three-grain shapes. It includes the FG zone at the boundary of the molten pool, the columnar CG zone for grain growth, and the equiaxed CG zone at the centre of the molten pool. This distinctive three-peaked heterogeneous structure observed within a single melt travel during the LPBF aligns with findings reported by Ao et al. [Citation36] and Mohebbi et al. [Citation26].
Figure 8. Numerical simulation results of single-pass laser melt pool grain growth. (a) Three-dimensional display of the grain growth process; cross-sectional views of the Z-Y plane (b), X-Z plane (c) and Y-X plane (d) after solidification of the molten pool.
Conventional approaches frequently prove insufficient when investigating the interplay between strength and toughness within bimodal heterogeneous structures. To address this issue, finite element models were introduced to represent the bimodal heterostructure utilising the CPFEM. EBSD IPF data of typical bimodal heterostructure regions were used as the basis for a representative volume element (RVE) model for CPFEM calculations (see Supplementary Material Figure S10). The modelling of a grain structure is the first step for the CPFEM numerical simulation. It is crucial to note that both the grain-structure EBSD IPF and the grain-structure RVE model maintain almost identical resolution.
a presents the numerical simulation results of a tensile test conducted in the single X-direction tensile model and single Y-direction tensile model, based on the established RVE model in Figure S7. The resulting engineering stress–strain curves show distinct characteristics for the models with the two tension directions. The Y-direction tensile model exhibits slightly lower strength but better plasticity than the X-direction one. To further analyze the stress distribution during the tension process, b and c depict Mises stress distribution diagrams of the two models during the tension. In the Y-direction tensile model, the stresses primarily concentrate within the FG-zones. Conversely, in the X-direction tensile model, the stresses at GBs of the CG-zones are more pronounced than those observed within the CG-zones of the Y-direction tensile model.
Figure 9. Numerical calculation results of tensile experiments on bimodal structure RVE model using CPFEM: (a) Numerical calculation results of engineering stress-strain curves for uniaxial tension along the X or Y directions of the RVE model; (b) Mises stress distribution cloud diagram of the corresponding model when stretched along the X direction to the label position in (a); (c) Mises stress distribution cloud diagram of the corresponding model when stretched along the Y direction to the label position in (a).
4. Discussion
4.1. Heterogeneous structural evolution during the LPBF process
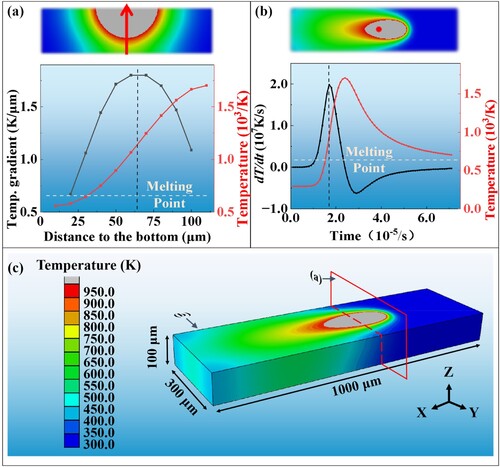
The LPBF process involves intricate heat transfer mechanisms and thermal histories. The melt-pool temperature field serves as the principal driving force for melting-solidification warranting thorough investigation. Notably, the laser power and scanning speed parameters in LPBF significantly influence the characteristics of the temperature field, as depicted in Figure S3. By adjusting these laser process parameters, it becomes feasible to effectively regulate the size of the melt pool. To further analyze the temperature characteristics within the melt pool, exemplifies the temperature-field thermal history using a laser power of 350 W and a scanning speed of 1000 mm/s. Within the melt pool, the highest temperature can be observed at its centre, gradually diminishing as one moves away from this central point, as illustrated in . a elucidates the distribution of temperature and temperature gradients spanning from the bottom to the top of the melt pool. Accordingly, the temperature gradient exhibits an initial increase followed by a subsequent decrease when transitioning from the solid to liquid regions. Remarkably, near the solid–liquid boundary on the liquid side, corresponding to the edge region of the melt pool, a maximum temperature gradient of 1.8 K/μm is calculated, as depicted in a. b illustrates the variations in both the temperature at the melt-pool central point and its corresponding rate of change over time. The thermal impact induced by the laser irradiation leads to a rapid surge in temperature at this central point, subsequently followed by a gradual decline, as exhibited in b. The maximum rate of temperature change during heating reaches 1.99 × 10⁷ K/s, whereas, during cooling, it amounts to – 6.25 × 10⁶ K/s. Notably, the highest cooling rate occurs near the centre of the melt pool.
Figure 10. Analysis of melt pool temperature field characteristics: (a) As shown in the arrow diagram, the spatial distribution of temperature gradient (black curve) and temperature (red curve) data from the bottom to the top of the molten pool; (b) As shown in the schematic diagram, the temperature change rate (black curve) and temperature (red curve) at the top centre of the molten pool (red dot position) change with time; (c) Display of calculation results of the three-dimensional temperature field.
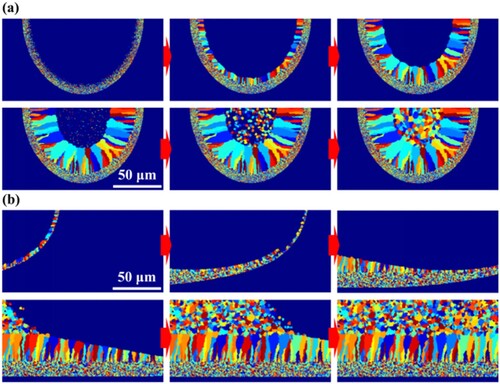
During the LPBF process, the material undergoes super-rapid melting and solidification induced by laser irradiation. As indicated by the aforementioned temperature field analysis, the solidification stage is characterised by a significant temperature gradient at the boundaries of the melt pool. This pronounced thermal gradient promotes rapid cooling of the material, forming numerous crystal nuclei, as depicted in a and 11b. The accumulation of these transitional crystal nuclei ultimately gives rise to the formation of what is known as the FG-zone at the boundary of the melt pool.
Figure 11. The display diagram of the microstructure evolution process during the numerical simulation of the laser molten pool solidification process: (a) The microstructure evolution diagram of the Y-Z section of the laser molten pool, which is divided into six diagrams to show the process from grain nucleation to complete solidification; (b) The microstructure evolution diagram of the X-Z section of the laser molten pool, which is also divided into six diagrams to display the process from grain nucleation to complete solidification.
Moreover, it has been established that Sc and Zr elements within the Al matrix give rise to primary Al3(Sc/Zr) particles. As illustrated in and , the Al3(Sc/Zr) particles exhibit a strong coherence with the face-centred cubic (FCC) structured Al matrix. Notably, due to their structural similarity and slight differences in lattice parameters, which are reported as 4.05 (Al) [Citation37], 4.10
(Al3Sc) [Citation38], and 4.08
(Al3Zr) [Citation39]. These Al3(Sc/Zr) particles serve as highly effective nucleation agents for promoting grain growth within the Al matrix. Their preferential precipitation at higher cooling rates provides favourable sites for nucleation within the Al matrix.
After the formation of the FG-zone at the melt-pool boundary, it progresses towards the central region of the melt pool. As depicted in b, a higher cooling rate induces epitaxial growth of grains at the boundary of the FG-zone. The transformation from equiaxed crystals to columnar crystals is mainly related to the nucleation and growth rate of grains. For non-uniform nucleation and solidification, both of them are directly related to the degree of supercooling. The cooling rate directly determines the degree of subcooling of the area. The heat conduction in the boundary area of the molten pool is convenient, resulting in rapid cooling of the liquid metal and a rapid increase in subcooling. The massive precipitation of heterogeneous particles such as Al3(Sc/Zr) provides a large number of high-quality nucleation sites for liquid metal. When a large number of grains are nucleated, the growth rate is also high, so that a large number of fine grains appear at the boundary of the molten pool. Because the volume is too small, it is less sensitive to temperature gradients, resulting in uniform growth in all directions and the rapid formation of equiaxed crystal regions. As it develops toward the inside of the molten pool, the cooling rate decreases, resulting in a slow decrease in subcooling, because the nucleation rate of grains is more sensitive to subcooling than the growth rate. Therefore, the new rate of grains decreases rapidly, while the growth rate remains at a high level. In this case, a small number of newly formed grains and the fine-grained zone edge of the existing grains initiate a rapid growth mode. As the grain volume continues to increase, the temperature gradient begins to drive the growth direction of the grain toward the maximum gradient direction.
Due to the grain-growth competition, grains with a < 100 > orientation exhibit faster growth along the temperature gradient direction and then rapidly occupy the space. Consequently, numerous grains grow towards the centre of the melt pool, resulting in elongated columnar grains. However, due to the rapid movement of the laser beam, grain growth lags behind the cooling rate of the melt pool. According to the temperature characteristic curve in , it can be known that at the end of the molten pool life, the temperature cooling rate continues to decrease, causing the liquid metal to further slow down its transition to a supercooled state. The growth rate of crystal grains is further limited, leaving a large amount of liquid metal resources. The lower degree of supercooling reduces the precipitation rate of heterogeneous particles such as Al3(Sc/Zr) in the remaining liquid metal, which greatly reduces the nucleation sites of grains compared to the molten pool boundary. At the same time, a small amount of new crystal grains and existing crystal grains grow slowly and continuously consume the remaining liquid metal resources. Since the temperature gradient at the top of the molten pool is much smaller compared to the centre and bottom of the molten pool, the driving effect on the grain growth direction is greatly reduced. The sensitivity of the new grains to the growth direction decreases and begins to show equiaxial growth close to random directions. Due to the lower density of the grains, the grains can capture more liquid metal resources and grow into a larger equiaxed crystal area in the centre area of the bottom of the molten pool, as shown in .
However, demonstrates that although the single-travel laser-induced melt pools exhibit three types of grain structure (refined equiaxed grains, coarse equiaxed grains, and elongated columnar grains, as shown in a and 11b). Due to the inherent process characteristics of LPBF technology, overlapping remelting and heating cross-interactions occur between adjacent multi-layers and adjacent multi-pass melt pools. This phenomenon leads to the remelting of the coarse equiaxed grains at the top region of a solidified melt pool. Then, the subsequent solidification of this remelted pool obeys its laws of solidification to replace or cover the previously solidified region with the coarse equiaxed grains that were remelted. Therefore, the final presentation of the LPBF-processed microstructures is not a ‘tri-modal’ structure but a ‘bimodal’ heterogeneous structure. Besides, this can shed new light on the subject, which is that by adjusting the laser scan spacing and layer thickness parameters of LPBF, it is possible to modify overlapping regions between melt pools. This adjustment facilitates control over the bimodal heterogeneous structure morphology within the LPBF-built Al-Mg-Sc-Zr alloy parts.
Figure 12. (a) The LPBF sample prepared by scanning strategy No.1, the cross-section parallel to the BD direction presents a regular fish-scale topography after corrosion; (b) EBSD-IPF map of the fish scale region, reflecting the grain morphology; (c) Numerical calculation of the microstructure morphology map after solidification of multi-pass and multi-layer melt pools based on the experimental parameters of scan spacing and powder layer thickness.
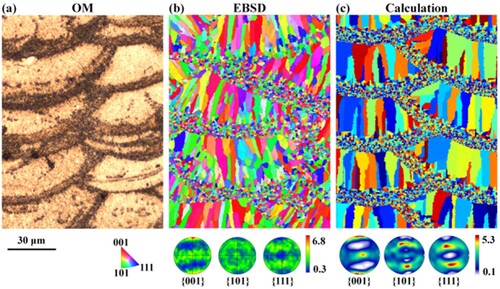
Alternatively, the anisotropy existing within the LPBF-processed microstructure can be elucidated through numerical simulations tracking microstructural evolution. In the bimodal heterostructure, the FG-zones primarily reside at the boundary of the melt pools, where grain orientation lacks a discernible predominance. Conversely, within the CG-zones, clear dominant orientation manifests due to directional grain growth driven by the temperature field gradient. Consequently, a pronounced microstructural texture is established along BD during the LPBF processing. By manipulating the process parameters, including laser scanning strategy, powder layer thickness, and laser scanning hatch in the LPBF process, it becomes possible to adjust the orientations of both strength and microstructure of this resultant texture. This approach holds theoretical significance and provides valuable insights for structural design considerations when employing the LPBF for part fabrication.
4.2. Heterogeneous structural evolution during tensile deformation
The EBSD characterisation figures of the as-aged and as-cast samples are shown in (a∼f). The inverse pole figure (IPF) and pole figure (PF) mapping of the cast Al-Mg-Sc-Zr alloy indicates a microstructure characteristic of coarsened equiaxed grains with relatively random orientation and no noticeable texture. The bimodal heterostructure exhibits on the as-aged sample cross-sections along the BD. The FG-zone grains at the melt-pool boundaries are randomly oriented, while the CG-zone grains in the melt-pool centre region express a uniform orientation, for the as-aged samples. The columnar grains of the CG-zone mainly orient toward the BD, resulting in the LPBF-produced crystallographic textures manifesting a superior grain orientation in the 001 crystal direction. Although the LPBF dual-peak heterogeneous structure has undergone time-effective processing, its geometrically necessary dislocation (GND) is still higher than the biting density of the as-cast sample, such as the kernel average misorientation (KAM) diagram.
Figure 13. EBSD characterisation results of the microstructure of Al-Mg-Sc-Zr alloy samples before stretching (IPF_X, PF, and KAM diagrams): as aged-V (a, d); as aged-H (b, e); as cast (c, f). And EBSD characterisation results of the microstructure of Al-Mg-Sc-Zr alloy samples after stretching (IPF_X, PF, and KAM diagrams): as aged-V (g, j); as aged-H (h, k); as cast (i,l).
(g∼l) illustrates the EBSD results of the as-aged and as-cast specimens after the tension testing. i shows the IPF of the cast alloy with the deformation of its coarse grains after the tension. Examining the KAM map of the cast specimen in l, compared to the primary microstructure, a significant accumulation of the GND density occurred near the GBs after the tension. It resulted in pronounced lattice distortion. The PF indicates a weak deformation texture along the <001 > crystallographic direction after the tension of the Cast specimen. h shows the IPF of the as-aged specimen cross-section along TD. The deformation led to differentiated degrees of grain deformation in the FG and CG-zones, i.e. larger deformation in the CG-zone than in the FG-zone. The KAM map in k can also corroborate this inference. The GND density of the CG-zone is higher than that of the FG-zone. Considering the as-fabricated <001 > crystallographic texture in the LPBF sample cross-section (), it is perpendicular to the direction of grain deformation when the principal tensile direction is perpendicular to BD. As a result, a weakened texture intensity in the <001 > crystallographic direction is exhibited in h. In contrast, after the tension with its direction parallel to BD of the LPBF specimen, the columnar grains in the CG-zone are markedly elongated along the tension direction, as shown in g. The average axial length of the columnar grains is no more than 50 μm before the tension. Some of them can reach more than 100 μm after tensile deformation. The bimodal heterostructure still presents uneven grain deformation. As indicated in j, the CG-zones have a higher GND density than the FG-zones. Besides, the crystallographic texture intensity along BD and parallel to the tension direction is enhanced, as implied in h.
The mechanical behaviour of the bimodal heterostructure generated by the LPBF exhibits remarkable complexity when subjected to tension. illustrates the stress–strain curves obtained from the computational predictions using CPFEM. In this analysis, the X-direction tensile model corresponds to the as-aged V specimen along the tensile direction of BD. Notably, the FG and CG-zones of the bimodal heterostructure display distinct tensile responses. Within the FG-zone, as depicted in , a higher density of GBs is evident. These GBs serve as barriers impeding the dislocation motion. Specifically, the dislocations marked by arrows in b tend to accumulate and interweave at these GBs, forming the dislocation walls that run parallel to the GBs. Then, a reinforced dislocation pinning effect arises at these interfaces, making it more challenging for dislocations to propagate across the GBs. The elevated density of dislocations in the FG-zone leads to reduced strain-hardening capability. Consequently, deformation during the tension becomes more challenged, enhancing hardness and strength characteristics.
The underlying mechanism is responsible for the synergistic combination of strength and plasticity in the bimodal-structure is closely linked to the performance disparities observed between the FG – and CG-zones. However, it is worth noting that the LPBF process introduces significant anisotropy in the distribution of these FG – and CG-zones. Additionally, a pronounced crystallographic texture is evident within the elongated columnar grains of the CG-zones. This issue becomes apparent when examining the variation in tensile behaviour between the X and Y direction tensile models, as illustrated in . Along the elongated axis of grains within the CG-zones, the tension results in greater elongation compared to the direction perpendicular to this axis. The stress-filed cloud diagram during the tension shows that stress primarily accumulates in the FG-zones during deformation along the Y direction. Conversely, when subjected to the tension along the X direction, stress concentration extends within the FG-zones and encompasses a considerable portion of the CG-zones. Furthermore, owing to the strong deformation ability of the CG zone along the grain-long axis, under stress, there will be a large strain gradient and interlayer cracks in the FG and CG zones under tension in the X direction. Besides, process defects are also prone to occur between powder layers. During the actual tensile test, the load perpendicular to the direction of defects and interlayer cracks is the main reason for the lower ultimate tensile strength and fracture strain of samples in the V direction. In contrast, during the stretching process along the Y direction, the stress is mainly concentrated in the FG zone with higher deformation resistance, which allows the overall structure to withstand greater uniform deformation. This also confirms that the H-direction sample has a higher tensile elongation.
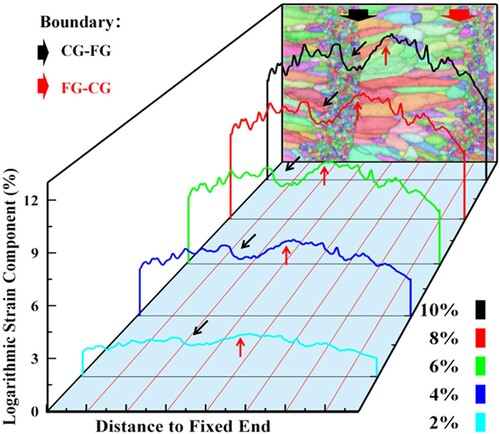
The distinct roles played by the FG and CG-zones in tension behaviours warrant further investigation, as their interactions remain a topic of significant interest. Through analyzing the evolution process of the aforementioned bimodal microstructure, it is concluded that grains in the CG-zones primarily form through epitaxial growth from the outer edge of the FG-zones. There is a good microstructural transition between adjacent FG and CG zones, and there are no microcracks between the two due to internal stress or thermal deformation after solidification. Therefore, in the early stages of plastic deformation, the strain can transition more gently from the CG zone to the adjacent FG zone (FG-CG in ). However, the degree of difference in the average size of the grains in the FG and CG-zones is large (CG-FG in ). This results in diverse deformation characteristics for these two zones, as indicated in . Examining the calculated strain data in b uncovers the distinct deformation behaviours and stress–strain trajectories within the FG and CG-zones during the plastic deformation. As the level of deformation increases, a substantial amount of strain accumulates in the CG-zones. Meanwhile, the disparity in dislocation accumulation between the FG and CG-zones also becomes more pronounced. Thus, during the later stages of plastic deformation, the transition region between these two zones encounters challenges in facilitating a smooth strain transition. This difficulty gives rise to the formation of an increasingly significant strain gradient and internal stress gradient between the FG and CG-zones. Moreover, with the continued strain accumulation, the CG-zones readily reach the material deformation limit, resulting in localised necking phenomena. Simultaneously, micro cracking can easily initiate due to the excessive dislocation within the FG-zones. In conclusion, the effectiveness of inter-coordination within each of the two zones, e.i., the FG and CG-zones, specifically in terms of strain tolerance and deformation strengthening limit, plays a very crucial role in determining the limitations of the combined mechanical properties (such as ultimate strength and plasticity) exhibited by the bimodal heterostructure. From this perspective, it is not necessarily true that a larger difference in the average grain sizes of the FG and CG-zones leads to better outcomes.
Figure 14. Based on the strain data of the tensile model along the X-direction in b, the average strain distribution along the X-direction is plotted according to the overall strain variation from 2% to 10%.
4.3. Analysis of fatigue performance of heterogeneous structure
Based on prior research discoveries, the anisotropic fatigue characteristics of Laser Powder Bed Fusion (L-PBF) processed materials are influenced by factors such as oriented microstructure, defects induced during the manufacturing process, and residual stress. Analysis of KAM depicted in d and e reveals that, following ageing at 300 °C for 3 hours, the dislocation density in both the Build Direction (BD) and Transverse Direction (TD) of the as-aged specimen remains relatively constant. Consequently, microstructure and process-induced defects emerge as predominant determinants of fatigue behaviour.
The fatigue behaviour of L-PBF materials changes with changes in build orientation because parts with different build orientations experience very different thermal histories. According to previous research, the bimodal heterostructure formed by Al-Mg-Sc-Zr alloy under the L-PBF process is directly related to the molten pool behaviour. This also reflects that the laser scanning path directly determines the distribution pattern of the bimodal heterostructure, which leads to the anisotropy of fatigue behaviour. According to the fatigue data results, it can be directly found that the samples in the V direction have better fatigue properties than those in the H direction. However, through the quasi-static tensile test, it was found that the elongation of the sample in the V direction was slightly lower than that of the sample in the H direction, and there was not much difference in strength. This shows that structural differences have a greater impact on different mechanical property data of materials.
First, the influence of the construction direction on the fatigue life of the sample under cyclic loading conditions is analyzed. According to the microhardness in , it can be clearly seen that there is a certain difference in the hardness of the FG (168.1 Hv) and CG (140.5 Hv) regions in the structure of the as-aged sample. According to the EBSD and TEM analysis results, it can be further demonstrated that the FG region has a higher GB density, which tends to result in more GBs acting as greater pinning and blocking motions for the newly created dislocations in the early stages of plastic deformation. In addition, a large amount of primary Al3(Sc/Zr) precipitated phase further strengthens the pinning effect of dislocations, making the FG region have higher strength. In contrast, the GB density in the CG region is lower. Although there is a large amount of secondary Al3(Sc/Zr) precipitated phase, the overall dislocation density and pinning effect are much smaller. The CG zone assumes the main local plastic deformation under cyclic stress far below the yield strength. Since the columnar crystals in the CG region of the sample in the V direction are parallel to the BD direction, they are subjected to cyclic loads in the V direction. The grains in the CG region have higher deformation ability along the long axis direction. By inducing a large number of dislocations and accelerating dislocation motion at the same time, increasing the local strain in the CG region weakens the stress gradient between the FG and CG regions. Different from static tension, the deformation ability of grains in the CG region is limited under high stress, and large strains can easily cause cracks to initiate rapidly along the edges of CG and FG. This is considered to be one of the reasons why the V-direction samples with lower elongation have better fatigue resistance.
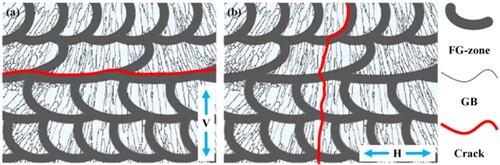
Secondly, the influence of the microstructure of the FG and CG regions on fatigue crack growth is very different. Because the deflection, distortion and tilt angle of the fatigue crack plane at the GB are one of the important factors affecting crack propagation. Driven by cyclic loading, the crack faces two choices when it reaches the GB on the path of continuous forward expansion. Whether it is deflected and tilted along the GBs or twisted through the interior of the grains, the driving force for crack propagation will be weakened. Through previous studies on the grain structure, it can be easily found that the CG region has an obvious preferred direction for crack propagation along the long axis of the columnar crystals, while the large number of fine equiaxed crystals in the FG region does not have such a preferred direction. Therefore, as shown in , under the action of cyclic loading in the V direction, the columnar crystals in the CG region undergo local strain along the V direction, and the maximum strain gradient appears at the interface between CG and FG. Cracks can easily propagate along the CG and FG edges shown in a (see Figure S11 in the supplementary Material). However, under cyclic loading in the H direction, fatigue cracks not only easily propagate at the edges of CG and FG, but also the columnar GBs in the CG region become the preferred direction for crack propagation. It is the microstructural difference in this region that causes the fatigue life of the V-direction sample under cyclic loading to be higher than that of the H-direction sample.
Figure 15. Schematic diagram of the crack growth path of as-aged samples under cyclic loading in the V direction (a) and H direction (b).
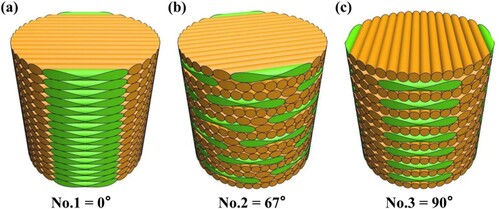
We already know that the different microstructures in the CG and FG regions have a greater impact on the fatigue life of the material. In addition, process defects (pores, corrosion holes cracks, etc.) are also one of the important factors in fatigue life. According to previous research, it is challenging to completely avoid defects during the L-PBF process. The scanning strategy in the L-PBF process will not only change the distribution rules of CG and FG but also have a great impact on the distribution of defects. Here, the fatigue resistance performance of as-aged samples in the V direction using three scanning strategies is compared (b). Through the statistical law of fatigue life, it can be found that the average fatigue life of samples with 0° deflection or 90° deflection with regular symmetry is lower than that of 67° deflection samples. In addition, the fatigue life deviation is smaller for the 67° deflection sample. This is mainly related to the different microstructures (see Figure S2 in the supplementary Material) and residual stresses caused by different scanning strategies. shows a schematic diagram of the overall laser melting path. It can be clearly seen from the laser scanning path that the laser melting channel arrangement corresponding to scanning strategy No. 2 is more uniform. In contrast, the laser paths corresponding to scanning strategies No. 1 and No. 3 will overlap in each layer or between every two layers. According to a large number of current studies, it is not difficult to analyze that due to the overlap of laser paths, the heat input distribution is highly consistent, resulting in the final thermal stress in the entire area being constantly accumulated at the same position. This makes the final products obtained by scanning strategies No. 1 and No. 3 more prone to production residual stress concentration in local areas. In addition to residual stress, the distribution of CG and FG regions within the tissue also closely depends on the laser melting path. The distribution of CG and FG areas in the sample corresponding to scanning strategy No. 2 is also more uniform. In addition, interlayer defects caused by the process (unmelted powder at the overlap of the melt channel, pores and cracks, etc.) will also have a superposition effect at the same position due to the regular laser path. Under the action of cyclic loading, as a crack initiates and expands, a domino-like phenomenon is likely to occur to accelerate the expansion of the crack, thereby accelerating the deterioration of the fatigue properties of the material. Under the combined effect of residual stress, microstructural structure and process defects, there are abnormally low fatigue life samples in the samples formed by scanning strategy No.1 and No.3. The much smaller sample lifetime error corresponding to scanning strategy No. 2 can also be attributed to this reason. The above analysis can be further verified according to Figure S12 (see Figure S12 in Supplementary Material). According to the μ-CT results, it can be seen that the medium defects of the as-aged sample are mainly dispersed micropores, and no obvious crack defects are observed. Generally, they show a higher density. In comparison, No.3 has the most defects and the largest pore volume, and No.2 has the best performance. Through the macroscopic fracture of the fatigue sample, it can be found that the fracture of the sample corresponding to No. 1 has crack expansion at both the upper and lower positions in the figure. The fatigue cracks of the sample corresponding to No. 3 can be considered to be caused by defects in the near-surface area. This all shows that the scanning strategy in the L-PBF additive manufacturing process of Sc/Zr-modified Al-Mg alloy has a decisive impact on the fatigue life of the final sample.
Figure 16. Three-dimensional model diagram of the laser scanning path: (a) Scanning strategy No. 1; (b) Scanning strategy No. 2; (c) Scanning strategy No. 3.
5. Conclusion
In this study, we employed the LPBF technique followed by a subsequent HT process to fabricate a high-strength Al-Mg-Sc-Zr alloy with a bimodal heterogeneous structure consisting of the FG – and CG-zones of Al-matrix. We conducted investigations using experimental and numerical simulation methods for the impact of the fabrication processes on the Al-Mg-Sc-Zr alloy microstructure evolution and properties. The following conclusions can be drawn:
The formation of a bimodal heterogeneous structure in the LPBF Al-Mg-Sc-Zr alloy is attributed to the distinctive process characteristics. Our temperature-field coupled CA model effectively simulated the heterostructural grain growth procedures during melting and solidification, thus providing insights into this heterostructural evolution mechanism for the FG – and CG-zones. CG-zone grains with dominant orientations grow along the temperature gradient direction in the melt pool. The validity of our CA model was confirmed by comparing it with the EBSD grain IPF maps.
The tensile test confirmed that the strength and plasticity of as-aged samples treated by the LPBF process and ageing are greatly improved compared to as-cast samples. We used the CPFEM method to calculate and analyze the relationship between the heterogeneous microstructure and macroscopic properties of the bimodal heterostructure. The study revealed the anisotropy in properties of the bimodal structure formed by the L-PBF process.
The bimodal structure of as-aged samples has excellent fatigue resistance under cyclic loading. We found that the fatigue resistance of the V-direction sample with lower elongation was even better. This is closely related to the anisotropy of the bimodal structure. In addition, the fatigue resistance performance of bimodal structures with different distribution patterns brought by different scanning strategies is also very different, which deserves further in-depth research.
Associated content
The Supporting Information is available in Supplementary Material File. Dimensional drawings and sample drawings of tensile and fatigue specimens (Fig. S1); numerical calculation process of temperature field; temperature field heat source model diagram (Fig. S2); temperature field calculation result diagram (Fig. S3); cellular automata model and Euler angles Schematic diagram (Fig. S4); List of parameters involved in the numerical calculation process (Table S1); EBSD result diagram of the as-built sample (Fig. S5); OM maps of micro-hardness indentation on the LPBF processed samples (Fig. S6); Schematic diagram of the RVE model of CPFEM (Fig. S7); EBSD result diagram of the fatigue fracture surface (Fig. S8).
CRediT authorship contribution statement
Guoqing Huang: Writing-original draft, Methodology, Investigation, Data curation, Software, Visualization; Tao Shen: Validation, Data curation, Software, Visualization; Bo Li: Conceptualization, Methodology, Investigation, Supervision, Writing-original draft, Writing-review & editing, Formal analysis, Funding acquisition.
All authors have read and agreed to the published version of the manuscript.
Supplemental Material
Download MS Word (35 MB)Disclosure statement
The authors declare that they have no known competing financial interests or personal relationships that could have appeared to influence the work reported in this paper.
Data availability statement
Data will be made available on request.
Additional information
Funding
References
- Blakey-Milner B, Gradl P, Snedden G, et al. Metal additive manufacturing in aerospace: a review. Mater Des. 2021;209. doi:10.1016/j.matdes.2021.110008
- El Kashouty MF, Rennie AEW, Ghazy M, et al. Selective laser melting for improving quality characteristics of a prism shaped topology injection mould tool insert for the automotive industry. Proc Inst Mech Eng C-J Mech Eng Sci. 2021;235(23):7021–7032. doi:10.1177/0954406221989382
- Rahim AHA, Abidin ZZ, Yunus N. The digitalisation in cobalt-chromium framework fabrication. Surface roughness analysis: a pilot study. Sains Malaysiana. 2021;50(10):3059–3065. doi:10.17576/jsm-2021-5010-18
- Gu D, Shi X, Poprawe R, et al. Material-structure-performance integrated laser-metal additive manufacturing. SCIENCE. 2021;372(6545):932–93+. doi:10.1126/science.abg1487
- Martin JH, Yahata BD, Hundley JM, et al. 3D printing of high-strength aluminium alloys. Nature. 2017;549(7672):365–36+. doi:10.1038/nature23894
- Zhang D, Qiu D, Gibson MA, et al. Additive manufacturing of ultrafine-grained high-strength titanium alloys. Nature. 2019;576(7785):91–9+. doi:10.1038/s41586-019-1783-1
- Li G, Brodu E, Soete J, et al. Exploiting the rapid solidification potential of laser powder bed fusion in high strength and crack-free Al-Cu-Mg-Mn-Zr alloys. Addit Manuf. 2021a;47:102210. doi:10.1016/j.addma.2021.102210
- Mehta A, Zhou L, Huynh T, et al. Additive manufacturing and mechanical properties of the dense and crack free Zr-modified aluminum alloy 6061 fabricated by the laser-powder bed fusion. Addit Manuf. 2021;41:101966. doi:10.1016/j.addma.2021.101966
- Uddin SZ, Murr LE, Terrazas CA, et al. Processing and characterization of crack-free aluminum 6061 using high-temperature heating in laser powder bed fusion additive manufacturing. Addit Manuf. 2018;22:405–415. doi:10.1016/j.addma.2018.05.047
- Li G, Jadhav SD, Martín A, et al. Investigation of solidification and precipitation behavior of Si-modified 7075 aluminum alloy fabricated by laser-based powder bed fusion. Metall Mater Trans A. 2021b;52(1):194–210. doi:10.1007/s11661-020-06073-9
- Spierings AB, Dawson K, Heeling T, et al. Microstructural features of Sc- and Zr-modified Al-Mg alloys processed by selective laser melting. Mater Des. 2017;115:52–63. doi:10.1016/j.matdes.2016.11.040
- Wang Z, Lin X, Wang J, et al. Remarkable strength-impact toughness conflict in high-strength Al-Mg-Sc-Zr alloy fabricated via laser powder bed fusion additive manufacturing. Addit Manuf. 2022;59; doi:10.1016/j.addma.2022.103093
- Cordova L, Bor T, de Smit M, et al. Effects of powder reuse on the microstructure and mechanical behaviour of Al–Mg–Sc–Zr alloy processed by laser powder bed fusion (LPBF). Addit Manuf. 2020;36:101625. doi:10.1016/j.addma.2020.101625
- Guo Y, Liao H, Chang C, et al. Effects of solute atoms re-dissolution on precipitation behavior and mechanical properties of selective laser melted Al-Mg-Sc-Zr alloys. Mater Sci Eng Struct Mater Prop Microst Proces. 2022a;854. doi:10.1016/j.msea.2022.143870
- Avery DZ, Phillips BJ, Mason CJT, et al. Influence of grain refinement and microstructure on fatigue behavior for solid-state additively manufactured Al-Zn-Mg-Cu alloy. Metall Mater Trans A. 2020;51(6):2778–2795. doi:10.1007/s11661-020-05746-9
- Nezhadfar PD, Thompson S, Saharan A, et al. Structural integrity of additively manufactured aluminum alloys: effects of build orientation on microstructure, porosity, and fatigue behavior. Additive Manufacturing. 2021;47:102292. doi:10.1016/j.addma.2021.102292
- Piette TD, Warren RJ, Spangenberger AG, et al. Microstructure evolution, fatigue crack growth, and ultrasonic fatigue in As-fabricated laser powder bed and conventionally cast Al–10Si-0.4Mg: a mechanistic understanding and integrated flaw-sensitive fatigue design methods. Mater Sci Eng A. 2021;825:141892. doi:10.1016/j.msea.2021.141892
- Zhang H, Li C, Song W, et al. Fatigue life evaluation and cellular substructure role of laser powder bed fused 304L steel based on dissipative deformation mechanisms. Addit Manuf. 2023;64:103430. doi:10.1016/j.addma.2023.103430
- Zhang H, Xu M, Kumar P, et al. Enhancement of fatigue resistance of additively manufactured 304L SS by unique heterogeneous microstructure. Virtual Phys Prototyp. 2021;16(2):125–145. doi:10.1080/17452759.2021.1881869
- Zhou RH, Liu HS, Wang HF. Modeling and simulation of metal selective laser melting process: a critical review. Int J Adv Manuf Technol. 2022;121(9-10):5693–5706. doi:10.1007/s00170-022-09721-z
- Lu L-X, Sridhar N, Zhang Y-W. Phase field simulation of powder bed-based additive manufacturing. Acta Mater. 2018;144:801–809. doi:10.1016/j.actamat.2017.11.033
- Rodgers TM, Madison JD, Tikare V. Simulation of metal additive manufacturing microstructures using kinetic monte carlo. Comput Mater Sci. 2017;135:78–89. doi:10.1016/j.commatsci.2017.03.053
- Zinovieva O, Zinoviev A, Ploshikhin V. Three-dimensional modeling of the microstructure evolution during metal additive manufacturing. Comput Mater Sci. 2018;141:207–220. doi:10.1016/j.commatsci.2017.09.018
- Liu J, To AC. Quantitative texture prediction of epitaxial columnar grains in additive manufacturing using selective laser melting. Addit Manuf. 2017;16:58–64. doi:10.1016/j.addma.2017.05.005
- Rappaz M, Gandin CA. Probabilistic modelling of microstructure formation in solidification processes. Acta Metall Mater. 1993;41(2):345–360. doi:10.1016/0956-7151(93)90065-Z
- Mohebbi MS, Ploshikhin V. Implementation of nucleation in cellular automaton simulation of microstructural evolution during additive manufacturing of Al alloys. Addit Manuf. 2020;36:101726. doi:10.1016/j.addma.2020.101726
- Kergaßner A, Mergheim J, Steinmann P. Modeling of additively manufactured materials using gradient-enhanced crystal plasticity. Comput Math Appl. 2019;78(7):2338–2350. doi:10.1016/j.camwa.2018.05.016
- Pei Y, Hao Y, Zhao J, et al. Texture evolution prediction of 2219 aluminum alloy sheet under hydro-bulging using cross-scale numerical modeling. J Mater Sci Technol. 2023;149:190–204. doi:10.1016/j.jmst.2022.11.037
- Chakrabarty A, Chakraborty P, Jain R, et al. Influence of scanning and building strategies on the deformation behavior of additively manufactured AlSi10Mg: CPFEM and finite element studies. Met Mater Int. 2023. doi:10.1007/s12540-023-01418-6
- Shiraiwa T, Briffod F, Enoki M. Prediction of fatigue crack initiation of 7075 aluminum alloy by crystal plasticity simulation. Materials (Basel). 2023;16(4). doi:10.3390/ma16041595
- Gandin CA, Rappaz M, Tintillier R. Three-dimensional probabilistic simulation of solidification grain structures: application to superalloy precision castings. Metall Trans A. 1993;24(2):467–479. doi:10.1007/BF02657334
- Huang Y. (1991). A user-material subroutine incorporating single crystal plasticity in the ABAQUS finite element program.
- Li R, Chen H, Zhu H, et al. Effect of aging treatment on the microstructure and mechanical properties of Al-3.02Mg-0.2Sc-0.1Zr alloy printed by selective laser melting. Mater Des. 2019;168:107668. doi:10.1016/j.matdes.2019.107668
- Guo Y, Liao H, Chang C, et al. Effects of solute atoms re-dissolution on precipitation behavior and mechanical properties of selective laser melted Al–Mg-Sc-Zr alloys. Mater Sci Eng A. 2022b;854:143870. doi:10.1016/j.msea.2022.143870
- Chen Y, Wang L, Feng Z, et al. Effects of heat treatment on microstructure and mechanical properties of SLMed Sc-modified AlSi10Mg alloy. Prog Nat Sci: Mater Int. 2021;31(5):714–721. doi:10.1016/j.pnsc.2021.08.003
- Ao X, Xia H, Liu J, et al. Simulations of microstructure coupling with moving molten pool by selective laser melting using a cellular automaton. Mater Des. 2020;185:108230. doi:10.1016/j.matdes.2019.108230
- Cooper AS. Precise lattice constants of germanium, aluminum,: gallium arsenide, uranium, sulphur, quartz and sapphire. Acta Crystallogr. 1962;15(6):578–582.
- Cannon JF, Tracy Hall H. Effect of high pressure on the crystal structures of lanthanide trialuminides. J Less Common Metal. 1975;40(3):313–328. doi:10.1016/0022-5088(75)90076-4
- Srinivasan S, Desch PB, Schwarz RB. Metastable phases in the Al3X (X = Ti,: Zr, and Hf) intermetallic system. Scr Metall Mater. 1991;25(11):2513–2516. doi:10.1016/0956-716X(91)90059-A