
 ?Mathematical formulae have been encoded as MathML and are displayed in this HTML version using MathJax in order to improve their display. Uncheck the box to turn MathJax off. This feature requires Javascript. Click on a formula to zoom.
ABSTRACT
The ability to design complex infill patterns is unique for 3D food printing to modulate food texture on top of other factors such as processing parameters and structural porosity. This study systematically investigated the impact of infill designs on the flexural properties of 3D-printed snack bars made from pea ingredients. Three-point bending tests revealed that increasing infill angle from 30 to 90 degree resulted in a larger flexural strength but a smaller flexural elongation of the 3D-printed snack bars. However, crossed layer structures did not improve the flexural properties of the samples. Digital image correlation revealed deformation behaviour and fracture propagation of 3D-printed snack bars during mechanical tests. Using the strain maps generated, the designs of the 3D-printed snack bars were modulated to achieve desired flexural properties. Overall, this study shows that it is feasible to customise 3D-printed food texture while maintaining its total calorie, by modifying the infill design.
1. Introduction
3D food printing can produce personalised foods tailored towards the individual’s preferences and nutritional needs. Because of its production flexibility, 3D food printing can fabricate food products with customised appearances, texture, and flavour profiles targeting different consumer preferences [Citation1]. Among its customising capabilities, texture modulation is one of the most studied applications of 3D food printing. Various studies attempted to customise 3D-printed food texture through altering the inner structure by changing the infill density of a given design. The infill density represents the solid fraction in a food structure, which directly determines its porosity at the macro level. Derossi et al. [Citation2] proposed the concept of ‘programmable’ food texture based on 3D food printing. By changing the macroscopic pore density and distributions of 3D-printed cereal snacks, the authors outlined a relation between food hardness and the relative density based on the Gibson-Ashby model. Similarly, Fahmy et al. [Citation3] carried out a set of experiments to model textural changes in the elastic regime by altering the infill density using finite element modelling (FEM). Several other studies also demonstrated 3D food printing as a method to modify food texture using different soft food materials such as vegetable food waste, lemon mousse, and mashed potatoes [Citation4–6]. These applications all supported the concept of texture modulation based on 3D food printing.
Although changing the infill density can be effective to modify texture, sometimes it is difficult to change the amount of porosity in a food structure because food applications are limited to a fixed amount of starting materials (e.g. to control the amount of calories per serving). In this case, texture modulation can be achieved by modifying the infill patterns, which determine the spatial distribution of the pores in a food structure. For example, Zhu et al. [Citation7] conducted instrumental and sensory analysis to demonstrate the impact of infill patterns on the hardness and chewiness of 3D-printed protein bars. The study reported that a design with a concentric infill pattern had a softer sensory perception compared to rectilinear and layered patterns. Similarly, the impact of infill patterns on the texture of 3D-printed cookies was explored in a different study [Citation8]. Their 3D-printed cookies contained triangled and squared pores while having the same solid fraction. The flexural properties of the samples made with different infill shapes were determined by performing three-point bending tests. Designs with squared pores were stronger but less elastic compared to those with triangled pores. This study further suggests that the infill pattern can impact the overall mechanical properties of 3D-printed foods. The detailed, internal fracture mechanism of 3D-printed food structures and its interaction with infill patterns remain however unelucidated. This lack of clarity makes it challenging to modulate infill designs of a 3D-printed food structure to achieve specific texture profiles.
From a material science perspective, many 3D-printed snack bars with macroscopic pores can be classified as sandwich structures, with the top and bottom faces sheeted by solid materials while the core contains macroscopically distributed, porous solids [Citation9]. Sandwich structures made of metal and thermoplastics in other application areas are studied extensively in terms of core shapes and orientations. Those designs are analogous to the infill patterns in the context of 3D food printing [Citation10]. Previous studies showed that upon three-point bending, a sandwich structure experiences a combination of core shear fracture (breaking of the infill structure) and shell delamination (breaking of the shell structure) [Citation11]. Unlike metal or thermoplastic sandwich structures, 3D-printed food structures can exhibit uneven structural changes after post-processing. Such variations in structure can lead to less controllable bulk mechanical properties compared to samples made with other engineered materials, resulting in altered fracture mechanics. Elucidating their detailed fracture mechanics of 3D-printed foods can provide insights to tailor structure designs and post-processing parameters to modulate mechanical properties of 3D-printed food texture.
To complement the mechanical analysis, the fracture process can be recorded by a digital camera and analysed with digital image correlation (DIC). Based on the frame-by-frame image analysis, the DIC algorithm tracks the displacement of a deformed material surface relative to a reference (the undeformed surface) to quantify the material deformation. Previous studies applied the DIC analysis as a complementary method to mechanical texture analysis of surimi and plant-based meat analogue [Citation12,Citation13]. The results from DIC visualise the strain distribution on the surface of a material, making it an effective method to characterise fracture mechanics of complex food materials such as 3D-printed snack bars.
This study systematically characterises the fracture mechanics of 3D-printed snack bars as impacted by various infill designs. It should be noted that the infill design is not the only factor to determine the textural properties of 3D-printed foods. Composition and processing parameters are other known factors that can impact the overall texture of foods, but in the context of 3D food printing, it is hypothesised that the design flexibility can further modulate the texture of foods made of the same composition and processes. To test this hypothesis, pea-based snack bars are 3D-printed into sandwich structures with solid shells and various infill designs, all having the same solid fraction (i.e. the same caloric content). The 3D-printed snack bars are baked and then subjected to 3-point bending tests coupled with DIC to examine their fracture mechanics upon flexure. The obtained fracture mechanics information is related to design parameters such as the infill angle and layer orientation. The insights gained from various measurements are used to modify the infill designs and produce 3D-printed snack bars with a diverse range of flexural properties.
2. Materials and methods
2.1. Sample preparations
A pea-based formulation was modified from Venkatachalam et al. [Citation14] as the printing material throughout this study. This formulation was selected due to the sustainable source of pea ingredients, the suitable material consistency, and reliable printability. Insoluble fibre, pregelatinized starch, native starch, and protein were kindly provided by Cosucra (Belgium). To prepare 100 g of the printing material, 13.7 g of insoluble fibre, 12 g native starch, 6.8 g of soluble protein, and 1.7 g of pregelatinized starch were mixed for 1 min using a kitchen mixer (Kenwood Kitchen Mixer, UK). After dry mixing, 65.9 g of water was gradually added to the mixing bowl and mixed for 5 min to produce a consistent paste. The sample is further homogenised and degassed using a vacuum mixer (Thinky Vacuum Mixer ARV-310LED, USA) at a speed of 2000 rpm and a pressure of 30 kPa for 2 min at 20°C. The sample was then equilibrated at room temperature (20°C) for 1 h prior to the 3D printing experiments.
2.2. 3D printing and post-processing
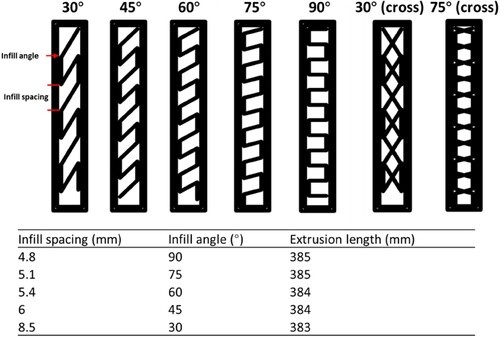
The pea-based printing material was loaded into a 200-mL syringe, which was connected to a pneumatic dispenser (Performus, Nordson EFD, USA). The pneumatic dispenser is controlled by a 3-axis precision motion stage (PI, Germany) to perform the extrusion-based 3D food printing. The printing path was designed using 3D printing control software (SPiiPlusSPC, ACS Motion Control, Israel). An overview of the printing designs can be found in . A cuboid of 60 mm × 10 mm × 10 mm was filled with different rectilinear patterns, of which the infill angles and spacings were varied to create different infill designs with almost identical extrusion lengths, leading to consistent weights of the 3D-printed samples. The rectilinear pattern was chosen in this study due to its simplicity and high 3D printing accuracy as reported in a previous study [Citation15]. In preliminary experiments, the sample with an infill angle of 0° did not maintain its shape and collapsed during post-processing, so it was not included in the subsequent experiments. The infill orientation was also alternated for the samples with infill angles of 30° and 75° to create crossed infill patterns. The alternation occurred every layer or every other layer to create binary crossed and ternary crossed infill patterns. The designs were 3D-printed in duplicates using a nozzle size of 1.2 mm at 40 mm/s with a layer height of 0.7 mm. Fourteen layers were printed in total, resulting in a design height of 9.8 mm.
Figure 1. An overview of the rectilinear infill designs (60 mm × 10 mm × 10 mm): top view of the infill structure, infill spacing, infill angles, and their corresponding extrusion length.
After 3D printing, the samples were frozen at −20°C for 3 h and then baked in a convection oven (Leventi, Levens Middleby, the Netherlands) at 140°C between 15 and 18 min to reach a final moisture content of 25 ± 1%. The baked samples were placed in an air-tight container at room temperature (20°C) to allow moisture equilibration for at least 12 h. The moisture-equilibrated samples were then used for further texture and/or x-ray tomographic analysis.
2.3. Finite element modelling
Finite element modelling (FEM) was conducted to evaluate the flexural properties of the rectilinear designs used in the 3D food printing experiments. 3D models were drawn based on the 2D designs in using SolidWorks (Dassault Systèmes, Vélizy-Villacoublay, France) for FEM simulation of a 3-point bending test. To simulate the 3-point bending test, two supports and one impactor bars were assembled with the 3D structure. The support bars have a span of 40 mm and were fixed on one of the solid shell of the design as the displacement boundary. Preliminary experiments showed that a mesh size of 0.5 to 1.5 mm results in mesh size independence. For all simulations, the 3-point bending assembly (3D structure, supports, and impactor) were meshed with a size of 1.2 mm to obtain about 100,000 tetrahedron elements. The impactor was set to deflect a flexure displacement of 2 mm from the centre of the top shell of 3D structure. To evaluate the impact of the designs of the structures on their flexural properties, material properties of low density polyethylene (LDPE) were taken as reference. The model was solved using the nonlinear analysis option in SolidWorks in a pseudo-time span of 1 s. In the solved model, the meshes contacting the impactor were selected and the von Mises stress of the meshes was averaged to approximate the flexure stress measured in a three-point bending test. The corresponding displacement of the impactor was recorded to calculate the flexural modulus of each design.
2.4. Texture analysis and digital image correlation
The baked samples were subjected to a three-point bending test using a universal testing machine equipped with a 2000 N load cell (Instron, Illinois, USA). A solid shell side of the sample was placed on the support span (L) of 40 mm, and the impactor flexed the sample from the mid-point of the top shell at a deformation rate of 2 mm/min for a flexure distance of 20 mm. The flexure test was terminated when the load cell measured less than 0.1 N of force or when the impactor travelled the total flexure distance (20 mm). The corresponding force (f) over the flexure distance (y) was recorded to calculate the flexure strain (ϵFlex) and stress (σFlex) using Equations (1) and (2) [Citation16]:
(1)
(1)
(2)
(2) where w is the width (mm) of the cuboid, H is the height (mm) of the rectangular rod.
Prior to the 3-point bending test, the front surface of the sample was spray-painted with black speckles (OK Spuitlak Mat, Wolvega, the Netherlands) for the digital imaging correlation (DIC) analysis. The randomly distributed black speckles enhance the contrast of the DIC analysis. A digital camera (Sony 4 K FDR-AX53) equipped with a Zeiss 2.0/4.4–88 mm lens recorded the 3-point bending process at 25 frames per second. The DIC analysis was then conducted using the recorded videos to visualise the strain deformation on the surface of the 3D-printed samples.
The 3-point bending videos were analysed with the open-source software ‘Ncorr2’ developed by Blaber et al. [Citation17]. The speckled surface of the sample was selected as the region of interest (ROI), and the software divided the ROI into a virtual grid with subsets. The deformation within each subset was represented by the correlation between the current image and the reference image (i.e. the non-deformed sample). A correlation coefficient was then calculated between the original position of the subset P (x, y) and the deformed position P′ (x′, y′). Based on this approach, all subset movements during the 3-point bending test were calculated using the DIC method. The calculated correlation matrix was then scaled into the distance space, and the flexural deformation of the sample was visualised by plotting the local strains of each subset on a heatmap.
2.5. X-ray tomographic analysis
The internal structure of selected 3D-printed samples was analysed with X-ray tomography (GE Phoenix v|tome|x m tomographer, General Electric, Wunstorf, Germany). A 240 kV micro focus tube with a tungsten target produced X-rays with a voltage of 100 kV and a current of 100 μA. X-ray images were recorded by a GE Dynamic41|200 detector array with 2024 × 2024 pixels (pixel size 200 µm). The samples were placed 117 mm from the X-ray source to obtain a spatial resolution of 30 µm. To avoid beam hardening, a 0.1 mm Cu filter was placed in front of the detector. 2D scans of the sample were performed from the frontal and transversal perspectives to visualise the layer stacking and internal porosity of the 3D-printed samples. The obtained X-ray images were compared to the DIC strain visualisations to gain complementary insights about flexural deformation of the 3D-printed samples.
3. Results & discussion
3.1. Flexural properties impacted by infill angles
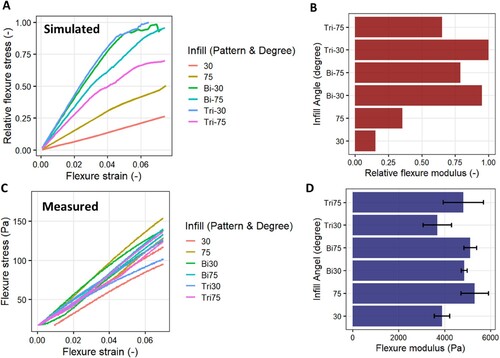
Finite element modelling (FEM) simulations were first conducted to examine the impact of the infill angles on the flexural properties of the designed structures, using a standard engineering material (i.e. low density polyethylene, LDPE). A shows the simulated flexure stress over a range of 0.07 flexure strain. To facilitated easy comparison amongst the designs, relative flexure stress is reported here with the highest flexure stress scaled to 1. It is clear that the infill angle impacts the flexural deformation of the structures. Within the 0.07 strain, the flexural deformation is generally elastic as indicated by the linear relation between the flexural stress and strain. The corresponding flexure modulus each design is calculated and shown in B. Normalisation is used to highlight the difference among the designs (i.e. the highest flexural modulus was scaled to 1). The sample with 90° infill has the largest flexural modulus in the elastic regime. While variations in flexure moduli are observed among infill angles of 60°, 45°, and 75°, the sample with 30° infill has a much smaller flexural modulus, indicating a weaker structure upon bending. The results from the FEM simulation suggests that even with the same solid fraction, designs with different infill angles lead to variations in flexural behaviour in the elastic regime.
Figure 2. A: simulated stress over flexure strain of the designs varied in infill angles. B: relative flexure modulus calculated based on A. C: measured flexure stress over flexure strain (0 to 0.07) based on three-point bending tests (n = 2). D: flexure modulus (Pa) calculated based on the stress-strain curves shown in C, the error bar represents standard deviation from duplicated measurements. Significant differences (P < 0.05) are indicated by the lowercase letters.
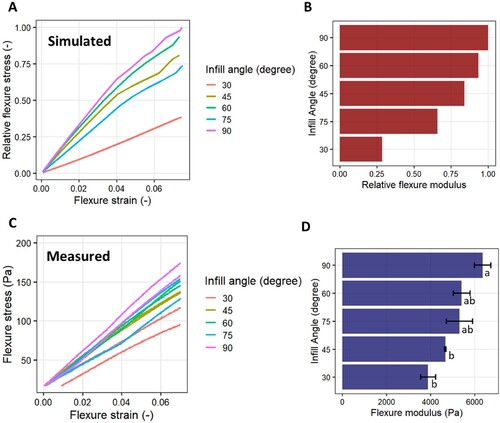
Three-point bending tests were performed to experimentally characterise the flexural behaviour of 3D-printed snack bars made of different infill angles. C shows the measured flexure curve with a flexure strain range of 0 to 0.07. In the elastic regime, a similar trend in the flexural moduli is observed between the simulated and the measured results. This agreement shows that FEM simulations are effective to estimate the flexure moduli among different rectilinear infills when designing rigid 3D-printed food structures. A similar conclusion was drawn by Fahmy et al. [Citation3] who successfully simulated Young’s modulus of 3D-printed cereal snacks based on compression tests. According to our simulated relative flexural moduli (D), an increase of the infill angle perpendicular to the outer shell generally results in a more rigid structure in terms of the flexural modulus. The elastic flexure of the sandwich structure is largely determined by the thickness of the shell and the relative density of the core [Citation11]. For the printed structures in this study, both the thickness of the shell and relative density of the core were set to be identical among the infill designs. The differences in elastic flexure therefore come from the core structure’s resistance to the shell flexure. With a 90° infill, the sample’s core is structured perpendicular to the shell, creating the largest resistance to flexure upon bending. When the infill angle reduces and the structure becomes more parallel to the shell, the resistance to flexure may weaken, leading to more shell flexure as observed in .
Moreover, the experimentally obtained flexural curve from three-point bending tests provides insights beyond the elastic regime. After the initial linear-elastic response between the flexure stress and strain, a non-linear phase is observed during which the flexure stress gradually approaches a plateau while the flexure strain continues to increase (). The final phase of the flexure curve involves a fluctuation falling phase typical of porous structures, where different elements of the structure fails with a rapid decrease of the overall flexure stress with fluctuations [Citation11]. reveals differences in the maximal flexure stress and failure strain (i.e. largest flexure strain with a stress measurement) of the 3D-printed snack bars. To highlight the differences, A summarises the flexural properties into a texture map by plotting the maximal flexure stress against its corresponding strain of bars with varied infill angles. Although with some variations in repetitions, the design with 90° infill is still the most rigid with the highest maximal flexure stress measured, while the design with 30° infill has the lowest maximal flexure stress. Overall, the maximal flexure stress decreases as the infill angle reduces, indicating that the perpendicular core support of the 90° infill gives the most resistance to flexure, similar to what is observed for flexure moduli (). Although with less rigidity, the 30° infill design shows the most flexural deformation with the largest flexure strain (A). This indicates the classic strength-deformation trade-off reported by Maldonado-Rosas et al. [Citation8] and among previous studies in food packaging films [Citation18,Citation19]. The rectilinear infill structures designed in this study therefore have the potential to modulate the flexural properties of 3D-printed snack bars by adjusting their strength and elongation balance.
Figure 3. Measured flexure stress over flexure strain of the designs varied in infill angles obtained from three-point bending tests (n = 2).
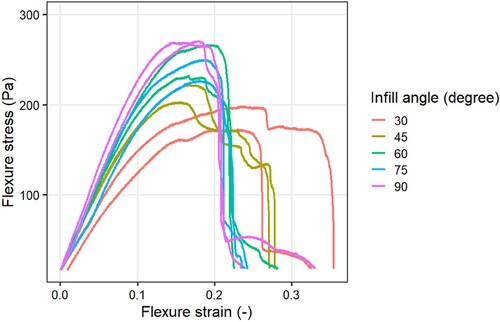
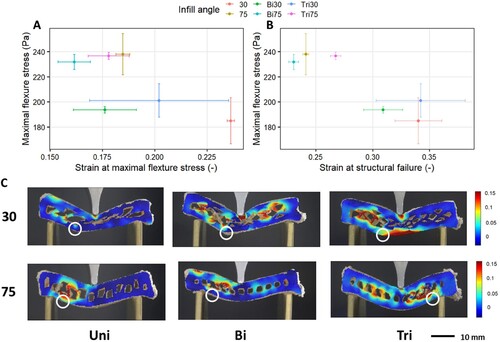
Figure 4. A: texture map (fracture strain vs fracture stress) of 3D-printed samples varied in infill angles. B: DIC strain map of a 3D-printed sample with 30° infill angle at fracture point. C: DIC strain map of a 3D-printed sample with 90° infill angle at fracture point. D: texture map (failure strain vs fracture stress) of 3D-printed samples varied in infill angles. E: DIC strain map of a 3D-printed sample with 30° infill angle at failure point. F: DIC strain map of a 3D-printed sample with 90° infill angle at failure point. The heatmap represents the strain changes with respect to the undeformed image of each sample.
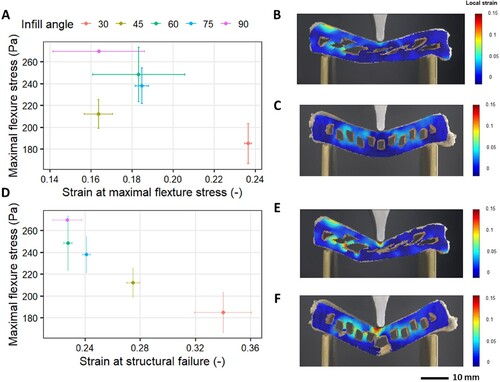
To further characterise the behaviour under flexure, B,C highlight the strain maps of bars made with 30 and 90° infills when reaching the maximal flexure stress, respectively. At maximal flexure stress, strain mostly occurs in the core of the sandwich structure. This is similar to what Liu et al. [Citation11] reported on composite sandwich structures made of carbon fibre-epoxy resin. The maximal flexure stress is associated with breakage of the infill structure, indicative of core fracture. Although both samples exhibited core fracture, the strain distributions are different between the samples with 30° and 90° infill. Specifically, for the 30° infill design, one side of the structure shows the most strain changes while the rest of the infill structure remains relatively less impacted (B). When the infill angle is changed to 90°, in C, the core strain is equally distributed across the infill structure, giving more rigidity against flexure compared to the sample with 30° infill design. The strain distributions confirm the different fracture mechanics measured by the mechanical tests in .
After reaching the maximal flexure stress, the 3-point bending proceeded until complete failure of the structure. At this failure point, the shell of the structures is completely deformed and all perceivable stress has gone. D show that the bar with 90° infill has the lowest elongation and failed at a flexure strain of around 0.22. In general, the elongation increases (i.e. the flexure strain at failure increases) as the design’s infill angle decreases. D confirms the strength-elongation balance mentioned before, indicating that rectilinear infill angles can modulate the overall flexural elongation by compensating the flexural strength. Shell delamination occurs as highlighted by the largest local strain close to the impactor (E,F). The impactor compressed on the top shell of the structure, leading to a severe deformation but no failure of the structure. Failure of the sandwich structures occurs when the bottom shell is tensioned apart, which is a common source of deformation found in 3-point bending tests [Citation16]. Maldonado-Rosas et al. [Citation8] also reported that tension from the bottom layer caused 3D-printed cookies to fail during a 3-point bending test. Therefore, reinforcing the bottom shell with higher solid fraction may improve flexure strength of 3D-printed snack bars. Overall, with all samples containing the same solid fraction, changing the rectilinear infill angles can result in different flexural properties of the 3D-printed snack bars. The strength-elongation balance is identified both at fracture and failure points in the 3-point bending tests, and flexural properties can be potentially modulated by changing the infill angles to create either elongated but soft samples (e.g. 30° infill angle) or strong but brittle samples (e.g. 75° and 90° infill angle).
3.2. Flexural properties impacted by layer orientations
Another parameter to consider when designing rectilinear infill is the layer orientation. In 3D-printing applications, it is common to alternate orientations among different layers to create crossed structures as reinforcement. In this section, we examined 2 types of crossing, a binary cross (i.e. alternating every other layer) and a ternary cross (i.e. alternating every 2 layers). The FEM-simulated results are first shown in A,B. Alternating the layers improved the overall strength of the structure compared to the uniformly stacked layers for both samples with 30 and 75° infill. However, the trend resulted from FEM (A,B) did not agree with the measured flexural curve (C,D). In the three-point tests, similar flexure progression in the near-linear regime was observed between the crossed and uniformly stacked samples, and no significant (P > 0.05) improvement in terms of flexure modulus was found. The mismatch between the simulated results using model material and the experimental results of the 3D-printed snack bars can be expected. The FEM simulation assumed ideal 3D printing performance with a perfect structure build-up, whereas the actual 3D printing of the snack bars is often prone to defects. Further structure analysis is needed to reveal the inner structure of the 3D-printed snack bars with crossed infill designs.
Figure 5. A: simulated stress over flexure distance of the designs varied in infill angle orientations (Bi: binary alternation, Tri: ternary alternation). B: relative flexure modulus calculated based on A. C: measured flexure stress over flexure strain (0 to 0.07) based on three-point bending tests. D: flexure modulus (Pa) calculated based on B. The error bar represents the standard deviation from duplicate measurements. No significant differences (P > 0.05) are found.
reveals the entire three-point bending measurements of designs varied in infill angle orientations. Layer orientation did not impact the fracture and failure behaviours of the 3D-printed snacks, whereas some differences are observed between the 30° and 75° infill designs. To further examine the flexural property difference, A shows a texture map comparing the maximal flexure stress of the crossed and stacked designs. Alternating the layer orientation resulted in no significant difference (P < 0.05) in terms of maximal flexure stress. The differences in flexure properties still originate from the infill angle difference (i.e. 30° vs 75°). Designs with 30° infill angle were more deformable and less rigid compared to the ones made with 75° infill, similar to what was observed in . When considering structural failure points, a similar trend is observed in B: designs with 30° infill have larger shell elongation as compared to the samples made with 75° infill. The results from 3-point bending tests further confirm that the crossed infill designs do not have improved flexural properties compared to other the other structures assessed in this study.
Figure 6. Measured flexure stress over flexure strain of the designs varied in infill angle orientations obtained from three-point bending tests (n = 2).
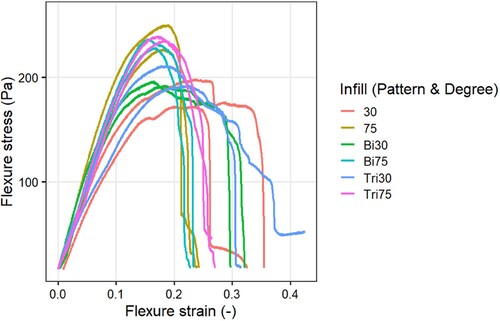
Figure 7. A: texture map (fracture strain vs fracture stress) of 3D-printed samples varied in infill angle orientations (Bi: binary alternation, Tri: ternary alternation). B: texture map (failure strain vs fracture stress) of 3D-printed samples varied in infill angle orientations. C: DIC strain maps of 3D-printed samples varied in infill angle orientations at failure point. The right circles indicate the failure positions on each sample.
The DIC analysis visualises the strain distribution of stacked and crossed structures at failure (C). The failure pattern is similar across the designs with 30° infill, as indicated by the red circles on the C. Even though the impactor indented and compressed the top shell with large deformation, the failure of the structure still originates from the tensioned bottom layer. Among the designs with 75° infill, the failure strain maps are also similar, with one side of the inner structure having the most strain changes. The shell delamination again occurs at the bottom, showing a consistent shell failure mechanism. Overall, the DIC strain maps agree with the mechanical measurements showing minimal difference in fracture mechanics between the stacked and crossed samples. The primary difference in fracture mechanics may be caused by the infill angle of the rectilinear designs rather than the layer orientations. Our results also suggest that crossed rectilinear structures do not improve flexure strength, and that layer orientation is an ineffective parameter to modulate the texture for 3D-printed snack bars.
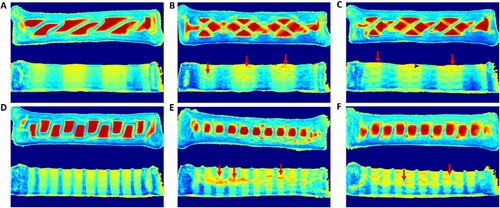
The observations made are counterintuitive and against the common insight that triangle shapes reinforce the flexure strength of beam structures [Citation20]. A possible reason for this disagreement is improper fabrication of the crossed structure using 3D food printing. Since 3D food printing builds a structure layer-by-layer, the infill layer crosses are made by suspending food materials over the previously printed layer. The pea-based paste used in this study may be insufficiently capable of achieving overhanging, and without proper overhanging, the printed layer can fall onto the previous layer, resulting in local collapse preventing proper formation of crossed structures. shows an X-ray image of the stacked and crossed samples made with 30° and 75° infill. In A, the transversal scan reveals a uniformly stacked infill structure (30°) with minimal cavities. However, when the layers are crossed, cavities and curved filaments (as pointed by the red arrows) can be observed in B,C. These cavities and curved filaments are due to undesired collapse and distortion that occurred during 3D-printing and/or baking. A similar inner structure trend is found in samples made with 75° infill. Cavities and inconsistent layer fusion in the crossed structure (E,F). Compared to the uniformly stacked samples, the crossed samples also suffer from poor layer fusion. Layer fusion is a known challenge of 3D food printing, as most food materials do not go through an active fusion process similar to melting and solidification of thermoplastics. Without proper layer fusion, the crossed structure cannot be regarded as uniform. Instead, some interface between the layers should be included when simulating the flexure process. The FEM simulation made in this study ignores any local collapse or poor layer fusion, which can explain the disagreement observed between the simulated and measured results. In summary, mechanical texture analysis, DIC analysis, and X-ray tomography confirm that 3D-printed snack bars made from a pea-based paste cannot fabricate crossed structures with proper fusion and intact triangle supports.
Figure 8. Frontal (top) and transversal (bottom) X-ray scans of no-alternation at 30° infill angle (A), binary alternation at 30° infill angle (B), ternary alternation at 30° infill angle (C), no-alternation at 75° infill angle (D), binary alternation at 75° infill angle (E), ternary alternation at 75° infill angle (F). The red arrows indicate the cavities and improper overhangs.
3.3. Modifying infill designs to modulate flexural properties
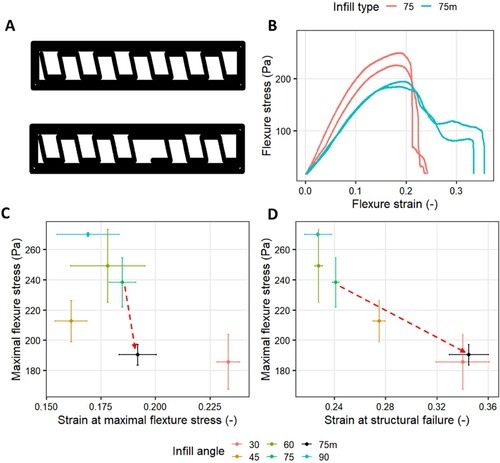
After understanding the fracture mechanics of 3D-printed snack bars during a 3-point bending test, the 75° rectilinear infill design was modified to alter its flexural properties based on the visualised strain fields shown in Section 3.1. The uniformly stacked 75° rectilinear infill design showed high flexural strength, but less elongation based on the 3-point bending test (). The near-perpendicular infill structure provides rigid support to the shell when deformed by the impactor. To improve flexural elongation, the modified design removes a support core in the middle of the structure but includes additional shell thickness (A). This infill design change maintains the overall solid fraction of the structure, while it improves the elongation of the shell reducing the core support structure. B compares the flexural properties between the original and modified designs. Overall, the modified structure had lower maximal flexure stress compared to the original design, while having a larger elongation upon bending. This is again an elongation-strength trade-off demonstrated by a simple change of the infill design. When comparing the modified design with the original stacked designs, C shows that a weakened core support at the bending position reduces flexural strength, and the fracture point may have occurred when the impactor punctured the top shell of the modified structure. After reaching the maximal flexure stress, B shows an irregular decrease of the flexure stress after reaching the maximal stress, indicating a sequential fracture of the top and bottom shells. This fracture behaviour leads to more elongation during the 3-point bending test, as shown by the large flexure strain at failure in D. In terms of the failure mechanics, the modified 75° infill design is very similar to the original 30° infill design with a low flexure strength and a high elongation. This design change demonstrates how a simple change in structure design can result in a large difference in flexure properties of 3D-printed snack bars. We can thus create a specific modification of the infill design, by systematically characterising the fracture mechanics of 3D-printed snack bars. These insights will allow us to create food products with a diverse range of flexure properties.
Figure 9. A: original (top) and modified (bottom) 75° infill design. B: measured flexure stress over flexure strain of original (75) and modified (75 m) infill structures. C: texture map (fracture strain vs fracture stress) of original (75) and modified (75 m) infill structures. D: texture map (failure strain vs fracture stress) of original (75) and modified (75 m) infill structures.
This design modification was based on the observations with the DIC strain visualisation of the 3D-printed snacks shown in previous sections. While the mechanical texture analysis measures the overall strength and elongation, the strain visualisation provided additional information about the local deformation and failure of a given structure. Understanding localised deformation is especially helpful in 3D food printing applications as this technology can quickly modify food structures. The visualised strain fields provide feedback to food structure designs, which can guide structural optimizations to modulate food textures. The vision-guided design modifications can be potentially extended to other food structuring applications. For example, Schlangen et al. [Citation13] applied tensile tests coupled with DIC to visualise and understand anisotropic structures in plant-based meat analogues. The obtained visualised deformation data can potentially direct future formulation and processing parameter optimizations when producing meat analogue products. With low-cost video cameras and open-source analysis software available, combining mechanical texture analysis with DIC becomes a feasible option for food science researchers to comprehensively modulate and adapt the mechanical properties of food structures.
4. Conclusions
This study systematically characterised the flexural properties of 3D-printed snack bars made with various infill designs. With a constant solid fraction and the same post-processing parameters, the infill angle of a 3D-printed structure can impact its flexural properties and result in a specific strength-elongation balance. Flexural strength can be improved by changing the infill angle perpendicular to the outer shell to provide more core support, while an infill angle more parallel to the outer shell improves the structure’s flexural elongation. Creating crossed layer structures shows minimal improvement for the overall flexural strength due to poor layer fusion and insufficient overhang of the pea-based printing material. Baking of the 3D-printed snack bars leads to structural variations, highlighting the uniqueness of food structures to traditional engineered sandwich structures. The flexural deformation process is analysed by digital image correlation (DIC), which visualised the local strain changes during the 3-point bending test.
The visualised fracture mechanics can guide the modification of the infill design to optimise the flexural properties of 3D-printed snack bars. For future research, the structures characterised by mechanical tests can be further evaluated through sensory panels to understand texture perceptions induced by 3D-printed snack bars. A thorough understanding of how the 3D structure design modulates the food texture may accelerate the production of personalised foods and will help to mature 3D food printing into a consumer-ready technology.
Acknowledgements
The authors thank Miek Schlangen from Wageningen University for detailed discussions on digital image correlation. The authors also appreciate technical assistance from Maaike Nieuwland on X-ray tomography. The X-ray tomography equipment used in this study is owned by Shared Research Facilities and subsidised by Ministry of Economic Affairs and the province of Gelderland, the Netherlands.
Disclosure statement
No potential conflict of interest was reported by the author(s).
Data availability statement
The data obtained from this study are available from the corresponding author, LZ, upon reasonable request.
Additional information
Funding
References
- Ma Y, Zhang L. Formulated food inks for extrusion-based 3D printing of personalized foods: a mini review. Current Opinion in Food Science. 2022;44:100803. doi:10.1016/j.cofs.2021.12.012
- Derossi A, Caporizzi R, Paolillo M, et al. Programmable texture properties of cereal-based snack mediated by 3D printing technology. J Food Eng. 2021;289:110160. doi:10.1016/j.jfoodeng.2020.110160
- Fahmy AR, Vogt UT, Jekle M, et al. Hardness targeted design and modulation of food textures in the elastic-regime using 3D printing of closed-cell foams in point lattice systems. J Food Eng. 2022;320:110942. doi:10.1016/j.jfoodeng.2022.110942
- Chow CY, Thybo CD, Sager VF, et al. Printability, stability and sensory properties of protein-enriched 3D-printed lemon mousse for personalised in-between meals. Food Hydrocoll. 2021;120:106943. doi:10.1016/j.foodhyd.2021.106943
- Liu Z, Dick A, Prakash S, et al. Texture modification of 3D printed air-fried potato snack by varying Its internal structure with the potential to reduce Oil content. Food Bioproc Tech. 2020;13(3):564–576. doi:10.1007/s11947-020-02408-x
- Pant A, Ni Leam PX, Chua CK, et al. Valorisation of vegetable food waste utilising three-dimensional food printing. Virtual Phys Prototyp. 2023;18(1):e2146593, doi:10.1080/17452759.2022.2146593
- Zhu S, Ruiz de Azua IV, Feijen S, et al. How macroscopic structure of 3D printed protein bars filled with chocolate influences instrumental and sensory texture. LWT. 2021;151:112155. doi:10.1016/j.lwt.2021.112155
- Maldonado-Rosas R, Pérez-Castillo JL, Cuan-Urquizo E, et al. The role of controlled voids shape on the flexural properties of 3D printed food: an approach for tailoring their mechanical properties. Virtual Phys Prototyp. 2024;19(1):e2284816. doi:10.1080/17452759.2023.2284816
- Rajpal R, Lijesh KP, Gangadharan KV. Parametric studies on bending stiffness and damping ratio of Sandwich structures. Additive Manufacturing. 2018;22:583–591. doi:10.1016/j.addma.2018.05.039
- Zaharia SM, Enescu LA, Pop MA. Mechanical performances of lightweight sandwich structures produced by material extrusion-based additive manufacturing. Polymers (Basel). 2020;12:1740. doi:10.3390/polym12081740
- Liu Z, Liu J, Zhang M, et al. Study of three-point bending behaviors of composite sandwich structure with re-entrant honeycomb cores. Polym Compos. 2023;44(1):673–684. doi:10.1002/pc.27128
- Park HW, Park JW, Yoon WB. The relationship between penetration, tension, and torsion for the fracture of surimi gels: application of digital image correlation (DIC). Processes. 2023;11(1):265. doi:10.3390/pr11010265
- Schlangen M, Schlangen E, van der Goot AJ. Advanced tensile testing as a new tool to quantify properties of food. Current Research in Food Science. 2023;7:100577. doi:10.1016/j.crfs.2023.100577
- Venkatachalam A, Balasubramaniam A, Wilms PFC, et al. Impact of varying macronutrient composition on the printability of pea-based inks in extrusion-based 3D food printing. Food Hydrocoll. 2023;142:108760. doi:10.1016/j.foodhyd.2023.108760
- Ma Y, Potappel J, Schutyser MAI, et al. Quantitative analysis of 3D food printing layer extrusion accuracy: contextualizing automated image analysis with human evaluations. Current Research in Food Science. 2023;6:100511. doi:10.1016/j.crfs.2023.100511
- van Vliet T. Rheology and fracture mechanics of foods. Boca Raton: CRC Press; 2013.
- Blaber J, Adair B, Antoniou A. Ncorr: open-source 2D digital image correlation matlab software. Exp Mech. 2015;55(6):1105–1122. doi:10.1007/s11340-015-0009-1
- Fabra MJ, Talens P, Chiralt A. Tensile properties and water vapor permeability of sodium caseinate films containing oleic acid–beeswax mixtures. J Food Eng. 2008;85(3):393–400. doi:10.1016/j.jfoodeng.2007.07.022
- Tong WY, Ahmad Rafiee AR, Leong CR, et al. Development of sodium alginate-pectin biodegradable active food packaging film containing cinnamic acid. Chemosphere. 2023;336:139212. doi:10.1016/j.chemosphere.2023.139212
- Deshpande VS, Fleck NA. Collapse of truss core sandwich beams in 3-point bending. Int J Solids Struct. 2001;38(36):6275–6305. doi:10.1016/S0020-7683(01)00103-2