
 ?Mathematical formulae have been encoded as MathML and are displayed in this HTML version using MathJax in order to improve their display. Uncheck the box to turn MathJax off. This feature requires Javascript. Click on a formula to zoom.
ABSTRACT
The development of fast and reliable finite element (FE) simulation codes has increased the relevance of FE simulations in predicting the outcomes of additive manufacturing (AM) processes and in the post-processing of additively manufactured components. The accuracy of FE simulations relies heavily on the quality of inputs such as material data, physical properties, numerical settings, and simulation methods. We review models used for simulating AM processes and the post-processing of AM components based on macro-scale continuum FE simulations. Particular attention is given to phase transformation and microstructure-based models because they determine the properties of AM components along manufacturing process chains and their subsequent performance. However, it's noted that FE simulations of AM components usually only consider the post-processing of AM components rather than complete process chains that include both AM and post-processing. A process chain simulation framework is proposed to model the entire manufacturing chain of AM parts.
| Abbreviations | ||
| FE | = | Finite element |
| AM | = | Additive manufacturing |
| ASTM | = | American society for testing and materials |
| PBF | = | Powder bed fusion |
| LPBF | = | Laser powder bed fusion (Selective laser melting) |
| ICME | = | Integrated computational material engineering |
| DED | = | Direct energy deposition |
| L-DED | = | Laser based DED |
| WA-DED | = | Wire Arc DED (wire arc additive manufacturing) |
| BJT | = | Binder jetting |
| GTAW | = | Gas tungsten arc welding |
| GMAW | = | Gas metal arc welding |
| HAZ | = | Heat-affected zone |
| JMAK | = | Johnson-Mehl-Avrami-Kolmogrov |
| JMA | = | Johnson-Mehl-Avrami |
| KM | = | Koistinen–Marburger |
| = | Alpha phase | |
| = | Alpha prime phase | |
| = | Beta phase | |
| EDM | = | Electrical discharge machining |
| DRX | = | Dynamic recrystallization |
1. Introduction
Additive manufacturing (AM) or 3D printing refers to a group of manufacturing processes that construct 3D components layer by layer from 2D prints. AM is a vital technology required to implement Industry 4.0 because it provides unparalleled design freedom and ease of process automation. Advances in AM have considerably enhanced process design by lowering costs and speeding up prototype generation. AM can produce parts with complex geometries, thereby replacing multiple components manufactured by traditional techniques, reducing lead time, and simplifying assembly. Manufacturing costs can be reduced in hot forging by printing near-net-shape preforms to ensure a single hit of components during forging, thereby lowering the number of dies in multi-stage forging. Furthermore, AM can replace metal casting in applications that require low porosity, short lead times, and complex geometries [Citation1]. AM is expected to reach an estimated market value of $50 billion between 2029 and 2031 [Citation2]. AM and conventional manufacturing processes can be combined to expand their applicability domain (hybrid-metal AM). Pragana et al. [Citation3] conducted a review of hybrid-metal AM. They demonstrated that hybrid process routes increase flexibility, and the limitations of AM are mitigated by combining AM and traditional manufacturing operations. According to the ASTM F42 standard, the most prevalent methods for AM of metals are BJT, DED, and PBF [Citation4].
Despite the enormous interest in AM technology, the reliability of AM components is generally low due to production flaws that can result in parts with inferior strength and fatigue performance compared to wrought components. During the solidification of the component, high-temperature gradients may prevail because of the re-melting of the deposited material and rapid cooling of some portions of the part. This leads to the formation of unusual microstructures and mechanical properties in AM components compared to components manufactured by traditional methods [Citation4]. Fan et al. [Citation5] highlighted the dependency of AM part microstructures on the cooling rate from molten temperature. Controlling the cooling rate is essential to achieving the desired microstructures, which directly influence the mechanical properties and performance of the final components. AM processes also introduce residual stresses and distortions in components [Citation6]. High tensile residual stresses promote crack formation, especially in corrosive environments, and reduce fatigue resistance [Citation7]. Multiple thermal cycles and the impracticality of directly measuring the temperature and microstructure evolution in AM experiments make experimental methods very expensive and time-consuming for AM process optimisation. For instance, Yadroitsev [Citation8] stated that about 130 parameters affect LPBF, and about 20 are first-order parameters. This complexity makes experimental optimisation time-consuming and costly. The microstructures of AM components are usually altered in post-processing operations. As-built AM components usually have unique microstructures characterised by material discontinuities, highly textured columnar grains, complex phases, and compositional variation [Citation9]. AM operations are usually part of process chains that include other manufacturing processes. Subsequent manufacturing operations are conducted on AM components to improve their mechanical properties, achieve grain refinement, close voids in components, reduce anisotropy, and minimise geometrical defects.
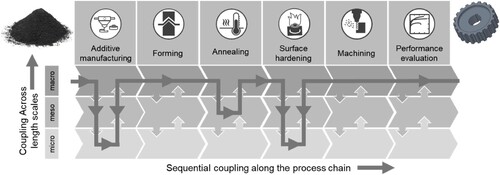
FE simulations are a low-cost method to understand the underlying physical processes in AM. FE simulations enable estimation of process outcomes before actual manufacturing, thus reducing the need for extensive trial designs and facilitating tailored experimental procedures. The outputs from FE simulations can be calibrated to mechanical, microstructural, and thermal properties obtained from experiments. To advance the adoption of FE simulation-based product development of AM components in the manufacturing industry, it is imperative to integrate microstructure evolution and phase change phenomena across entire manufacturing process chain simulations. According to existing literature, this integration entails performing FE simulations across three domains: process, material, and product [Citation10]. FE modelling of process chains is performed by combining process models within an integrated computational materials engineering (ICME) framework. ICME integrates multi-scale (micro, meso, and macro) simulation results as inputs to subsequent simulations in a process chain, as shown in . The goal of ICME is to create holistic systems that will accelerate material development, transform the engineering design optimisation process, and unify design and manufacturing [Citation11]. ICME focuses on determining the properties of finished components while considering property alterations in the parts’ manufacturing history [Citation12]. The processes in the simulation chain in can be simulated at all scales. Micro- and mesoscale simulations are time consuming at the part scale. To better model details on the microstructure, AM and surface hardening can be modelled at macro-, meso-, and micro-scales, while annealing is modelled using macro- and meso-scale simulations.
Figure 1. Illustration of ICME paths for simultaneous materials and process design of additively manufactured components.
1.1. Multiscale modelling of AM processes
Metal additive manufacturing processes are challenging to model because of the occurrence of multiple physical phenomena and the multiscale nature of these phenomena. In addition, coupling the interactions of mechanical properties and microstructure evolution to temperature change is very demanding due to the transient nature of AM [Citation13]. To address these challenges, AM is modelled at micro, meso, and macro scales based on the domain of interest, as shown in . The information from micro- and mesoscale models can be incorporated into the macroscale. Francois et al. [Citation14] presented a review of AM simulation at different lengths and time scales and highlighted the challenges and opportunities in multiscale AM simulation. Similarly, Gatsos et al. [Citation15] reviewed process-microstructure-property relationships in metal AM processes at different FE simulation scales and proposed creating a feedback-based approach to link the simulations and experiments.
Figure 2. Different scales of study in modelling metal additive manufacturing processes (top) and the fundamental physical phenomena occurring in and around the melt pool region at the scale of the powder (bottom) [Citation16].
![Figure 2. Different scales of study in modelling metal additive manufacturing processes (top) and the fundamental physical phenomena occurring in and around the melt pool region at the scale of the powder (bottom) [Citation16].](/cms/asset/2f389fc5-8cf5-44d9-8556-515d3e197905/nvpp_a_2356079_f0002_oc.jpg)
Microscale models.
Microscale simulations are essential for modelling physical and material properties. However, executing micro-scale simulations at the part scale is extremely time-consuming, which limits their practicality in industry settings. They can replicate properties such as surface tension anisotropies or kinematic coefficients in the rapid solidification regime [Citation17]. At the solid–liquid interface, phase-field (PF) models are used to predict detailed morphologies and the dynamics of microstructure solidification [Citation18]. PF models shed light on experimentally observed microstructures, produce quantitative predictions, and reveal the local grain orientation. The crystal structures of the phases are assigned Gibbs energy models and can be performed on CALPHAD and cellular automata. Monte Carlo models have also been employed for microstructure prediction [Citation19]. Crystal plasticity FE models can link the results from PF and Monte Carlo micromodels to mesocale FE models [Citation20].
Mesoscale models.
Mesoscale models are powerful at capturing the molten pool dynamics as a function of the powder, free surface flows, describing phase transformation, and determining the effects of processes and material parameters [Citation21]. Mesoscale simulations can be calibrated to link the physical characteristics observed in micromodels to macroscale simulations [Citation22]. The mesoscale model can be grouped as follows:
Computational fluid dynamics (CFD) models: CFD models are good at predicting the thermal-fluid flow and geometry in AM; however, they are poor at capturing the structural response. As a result, coupling thermal-fluid results from CFD solvers to FEM to obtain the structural response has been explored. Employing the hybrid simulation method, Chen and Yan [Citation23] proposed a high-fidelity model to simulate GMAW. Similarly, Mathews et al. [Citation24] simulated L-DED of SS 316L and validated the residual stresses.
Smoothed Particle Hydrodynamics (SPH) models: A recent review on numerical simulation of metal AM based on particle methods highlights the advantages of SPH methods, including the potential of particle methods to achieve realistic powder morphology, their strength at modelling AM of complex geometries, and their straight-forward implementation to solve multi-physics problems [Citation16]. The research group also developed new algorithms based on a neighbour-search scheme [Citation25] and dynamic refinement-coarsening [Citation26] to speed up SPH simulations. However, SPH simulations suffer from numerical instability, poor surface representation, and boundary treatment.
Lattice Boltzmann methods (LBM) models: LBM is the only method capable of modelling all the physical processes observed in the molten pool and is fully explicit, which offers massive parallelisation options [Citation27]. LBM can model phenomena up to the mesoscale.
The review was conducted on models used in macro-scale (part-scale) FEM because they save time needed to model detailed phenomena in large industrial parts. Bayat et al. [Citation28] stated that, given today’s computing capabilities and existing modelling approaches, it is currently impossible to simulate all relevant physical phenomena, including stress evolution and fluid flow, in macroscale simulations. Currently, it is only possible to simulate detailed phenomena for a few tracks at the mesoscale [Citation26]. Additionally, manufacturing processes are optimised by part-scale simulations. Although the macroscale finite volume method (FVM) has proven to be faster at performing part scale AM simulations than FEM [Citation29], FVM is poor at handling problems involving structural responses often present in post-AM processes.
1.2. Aim of the review
Currently, few studies have reported simulations of AM and the post-AM processing of components in a process chain. Complete process chain simulations are required for process optimisation, enhancing mechanical properties, and extending the service life of AM components. This can be achieved by phase change and microstructure-based simulation at each stage in process chains. Such an approach requires material models that are valid at each stage in a process chain. Thus, it is necessary to review material models used for AM and subsequent processes at a part-scale to establish frameworks for process chain simulation.
The aim of this review is fourfold: (1) To provide an overview of the models used in macro-scale FE simulations of AM processes. (2) To outline models used in FE simulation of the post-processing of AM components. (3) To review studies with process chain simulations. (4) To propose a framework to implement the processing-structure–property-performance of AM components and achieve AM process chain optimisation.
The review is structured as follows: The theoretical background and models used in FE simulations of AM processes are presented in Chapter 2. Chapter 3 presents models for simulating and evaluating post-AM components. Chapter 4 introduces studies with process chain simulations. In Chapter 5, we present a discussion and outlook on process chain simulation. Chapter 6 provides conclusions.
2. Macroscale finite element analysis of AM
2.1. Theoretical background of macroscale continuum AM simulation
Macroscale AM simulations can be modelled based on continuum mechanics by differential equations governing the conservation of mass, internal energy, momentum and current continuity [Citation30].
(1)
(1)
(2)
(2)
(3)
(3)
(4)
(4)
From the first law of thermodynamics, the general thermal energy balance in a closed system is determined by
(5)
(5) where
,
,
, and
represent the rate of heat generation, conduction, convection and radiation, respectively. For an isotropic volume, the heat conduction equation can be defined by Fourier’s law:
(6)
(6) where
is the thermal conductivity,
is the density,
is the specific heat capacity,
is the temperature, and
is the time. The thermal boundary conditions for convection and radiation are calculated at the part surface by
(7)
(7)
(8)
(8) where
refers to the heat transfer coefficient,
is the emissivity,
represents the Stefan–Boltzmann constant.
,
and
are the surface temperature, surrounding temperature, and absolute zero temperature respectively. The FE simulation programme works by solving the heat transfer problem:
(9)
(9) where
is thermal conduction, with an assumption of quasi-static equilibrium at the current time step.
(10)
(10) where
refers to the stress. In Equation (9), convection is assumed to be zero for a solid body and heat loss by radiation is omitted. The constitutive law to solve the mechanical problem is defined by:
(11)
(11)
(12)
(12) where
is a the forth order stiffness matrix tensor,
,
,
,
, and
represent the total strain, elastic strain, plastic strain, thermal strain, and strain due to phase transformation, respectively. The elastic strain is defined by
. The plastic strain is calculated by
. Where
is the plastic strain rate and
is the yield function. The direction for plastic strain increment is given by
. The thermal strain is defined by
. where
is the temperature and
is the coefficient of thermal expansion. The phase transformation strain is determined based on the transformation law in section 2.6. The strains and displacements obey the following:
(13)
(13) The continuum assumption erases the molecular discontinuities by averaging the microscopic quantities in small sampling volumes. The representative volume of the component is assumed to be large enough to erase the microscopic fluctuations but also small enough to point out the macroscopic variations in quantities of interest. All the macroscopic quantities (stresses, strains, temperature, etc.) are assumed to vary continuously from point to point within the bodies. The continuum assumption inherently limits the ability to simulate details of the process at lower scale lengths but provide the average values of quantities over the volume.
2.2. An overview on macro-scale FE simulation
The basics of FE modelling of AM processes draw upon the works of Rosenthal and Goldak et al. on modelling of welding operations that include the energy source, filler material, and build structure [Citation31,Citation32]. Owing to the similarities between multi-pass welding and AM, AM is simulated like multi-pass welding, and data from welding simulations is often used in AM simulations. The temperature is highest in the molten region where the material is deposited. Heat transfers from the newly deposited material to the previous layers mainly by conduction and causes thermal cycles in the previously deposited layers. High temperatures cause changes in the mechanical and metallurgical properties of the molten area and heat-affected zone (HAZ). presents a flowchart summarising AM simulation process. The algorithm works by solving the thermal and mechanical problems with dedicated solvers. Apart from the heat source model, the rest of the algorithm is required for post AM simulations.
Figure 3. Flowchart of a thermo-metallurgical-mechanical coupling model for the SLM process [Citation33].
![Figure 3. Flowchart of a thermo-metallurgical-mechanical coupling model for the SLM process [Citation33].](/cms/asset/414b6ec1-080a-46f5-9e69-452899c07384/nvpp_a_2356079_f0003_oc.jpg)
In the rest of chapter 2, thermal, mechanical, phase transformation, and microstructural models used in the macroscale FE simulation of AM are presented. The effects of model parameters on FE simulation, advanced modelling techniques, and the interactions between parameters of different phases are highlighted.
2.3. Thermal features
2.3.1. Heat source models
The Goldak (volumetric heat source) model is often used to describe the heat source in AM and welding processes for macro-scale continuum FE simulations [Citation32]. The Goldak is usually used for AM modelling due to its capacity to estimate the molten pool shape. The Goldak model describes the front and rear parts of the ellipsoid formed by the moving heat source.
(14)
(14) where
is the total induced power,
and
are the portions of the heat generated in the frontal and rear parts of the double ellipsoid (
).
and
are geometric parameters that define the size and shape of the ellipses. The weld pool energy is determined by
where
is the efficiency of the heat source,
and
are the voltage and current of the heat source. Recent reviews present the state of the art on heat source models for macroscale continuum FE simulations [Citation34,Citation35]. Such heat source models do not reveal process details; however, they are the basis for calculating the temperature, residual stresses, and fusion zone shape and size. Continuum FE simulations of multiple layers and hatches are ‘ … critical to understanding the structure and properties of the entire build … ’ in AM [Citation20].
2.3.2. Coefficient of thermal expansion
Heat input in AM processes causes a temperature rise that leads to thermal expansion. AM parts contract upon cooling. The temperature drop causes residual stresses to develop and distort components. The coefficient of thermal expansion defines the increase in length of a specimen per unit temperature increase. The coefficient of thermal expansion increases with temperature [Citation36,Citation37]. Blumm and Henderson [Citation38] measured the volumetric coefficient of thermal expansion of alloy 718 in the temperature range in a dilatometer test. The volumetric thermal coefficient was transformed into a linear coefficient. At high temperatures, the thermal expansion coefficient of the material is considered zero because the material is assumed to be in a liquid state and no straining occurs. Zhang et al. [Citation39] modified the values of the thermal expansion coefficient from the ASTM standards to obtain the distortion measured in the welding experiments of two AF1410 steel plates. Perić et al. [Citation40] demonstrated that the coefficient of thermal expansion has a significant influence on part deflection in AM simulation. In the same light, Park et al. [Citation41] showed that distortion increased with an increase in the coefficient of thermal expansion using experimental and numerical analyses in the WA-DED of a group of 8 metals.
Some studies consider the influence of multiple phases on the coefficient of thermal expansion. Zhang et al. [Citation6] implemented multiple thermal expansion coefficients in modelling the transformation plasticity of multi-phase AF1410 steel. Babu et al. [Citation42] calculated the average coefficient of thermal expansion of the individual phases using the rule of mixture. Caron et al. [Citation43] revealed that the residual stresses in FE simulations depend on the portion of formed martensite.
2.3.3. Thermal conductivity
Thermal conduction is the process of heat transfer from the hotter to the colder ends of a material and is quantified by thermal conductivity. The thermal conductivity of bulk materials is significantly higher than that of powder materials due to the close arrangement of particles. Zhu and Chao [Citation44] proved that thermal conductivity significantly affects the transient temperature distribution. The thermal conductivity gradually increases with temperature up to the solid-to-liquid transition temperature and is followed by a sudden increase at temperatures where the material is completely liquid [Citation36,Citation45]. The high values at the melting point are explained by the effect of convection stirring in the molten pool [Citation46]. Draxler et al. [Citation47] determined the conductivity of the mushy zone by extrapolating the thermal conductivity of the metal and liquid phases using a linear mixture rule.
(15)
(15) where
is the volume fraction of the solid,
and
are extrapolated thermal conductivities of the solid and liquid phases. It was assumed that the temperature of the mushy zone lies between the temperature of the solid and liquid phases. Zhang et al. [Citation6] modelled the transformation plasticity of multi-phase AF1410 steel using the multiple thermal conductivities of different phases. In some studies, the thermal conductivity reduces with an increase in temperature until the solid-to-liquid transformation, before a sudden rise when the material is fully liquid [Citation36,Citation48,Citation49]. Ding et al. [Citation50] described a heat conduction equation that considers the direction of thermal conductivity. Perić et al. [Citation40] demonstrated that thermal conductivity influences the heat-affected zone (HAZ) in welding simulations. High thermal conductivities lead to large HAZs, and vice versa.
2.3.4. Thermal radiation and convection
The freshly deposited material loses heat to the environment through radiation and convection during cooling of the AM component. The thermal problem becomes non-linear because of the high temperatures, so it's critical to have a proper estimate of the thermal radiation and convection at the component surface [Citation51]. Thermal radiation and convection increase with temperature [Citation37]. Tran et al. [Citation52] performed a parametric study to determine an accurate convection coefficient (natural convection) in the laser cladding of Ti-6Al-4 V. Furthermore, they adjusted the critical phase transformation temperature to obtain the fusion zone and HAZ measured by optical microscopy.
2.4. Mechanical features
2.4.1. Elastic modulus
The high temperatures in AM cause a reduction in the force required to achieve deformation. As a result, the elastic modulus decreases with increasing temperature. The elastic modulus is defined at specific temperatures, ranging from room temperature to molten temperature. Some studies express the elastic modulus as a function of temperature [Citation42,Citation47]. Based on experiments conducted by Outinen and Mäkeläinen [Citation53], Perić et al. [Citation40] developed formulas to describe the evolution of the elastic modulus with temperature. Two equations were used to describe the elastic modulus above and below 600°C. Similarly, Draxler et al. [Citation47] proposed an isotropic ‘soft’ material model to determine the elastic modulus when the metal turns to a liquid state.
(16)
(16) where
is the Poison’s ratio and
refers to the bulk modulus. The elastic modulus of the mushy zone was approximated using a linear mixture rule for temperatures above the coherent temperature (
= 1278°C). The mushy zone was assumed to have the same elastic modulus as the liquid state at temperatures above
since the mush cannot transmit tensile loads above the coherent temperature. The elastic modulus of the mush zone was written as
(17)
(17) where
is the elastic modulus of the solid phase extrapolated to the mushy zone and
is the volume fraction of the solid. Zhang et al. [Citation6] included the effect of transformation plasticity in the welding of AF410 steel to improve the prediction of the residual stresses and distortion. The linear mixture rule was used to model the elastic moduli of the phases.
(18)
(18)
= 1,2,3,4 are phase fractions of the initial state, austenite, bainite and martensite.
2.4.2. Yield stress
Similar to the elastic modulus, the yield stress reduces with an increase in temperature as lower forces are required to deform materials at high temperatures [Citation54,Citation55]. Park et al. [Citation41] showed that distortion moderately increased with an increase in elastic modulus and yield stress. Chiumenti et al. [Citation36] coupled a temperature-dependent J2-yield surface and temperature evolution in multi-pass welding of nickel super-alloy 718. The yield surface contracted with an increase in temperature. Zhang et al. [Citation56] showed that the dependence of the yield strength for metallic materials on temperature and strain is described by:
(19)
(19) where
refers to the reference yield strength, at room temperature
and strain rate
. The melt, current, and reference temperatures are represented by
,
, and
, respectively.
and
are the elastic modulus at temperatures
and
.
and
are the Poisson’s ratio at temperatures
and
. The current strain rate is defined by
.
,
, and
are material parameters obtained from fitting experimental data. Ali and Han [Citation57] implemented the law of linear weight to obtain the average yield strength of individual phases in WA-DED of EH36 steel. Zhang et al. [Citation6] included the yield strength of different phase fractions.
2.4.3. Flow stress
In AM simulations, the flow stress is usually defined till the yield point to make the analysis easier. This is because little plastic deformation is thought to happen in AM, and part distortion is thought to be mostly caused by elastic springback [Citation37,Citation58]. The plastic part of the flow stress and yield functions is included in AM FE simulations to improve the accuracy of predicted residual stresses and distortion [Citation59]. Manurung et al. [Citation60] used mechanical parameters determined by JMATpro software to predict distortion in the WA-DED of SS3I6L with good accuracy. Deng et al. [Citation61] performed FE simulations to calculate the residual stresses of a multi-pass butt-welded joint using several material laws (perfect plastic, isotropic strain hardening, kinematic strain hardening, and mixed isotropic-kinematic strain hardening). The residual stresses were influenced by the yield strength and the strain-hardening model. Temperature-dependent flow stresses were implemented by Malmelöv et al. [Citation62] to introduce the temperature dependence of mechanical properties. Chen et al. [Citation63] used the Prager-Ziegler kinematic hardening model and the Von-Mises yield criterion in modelling the yield behaviour of different phases in the powder L-DED of a low-temperature transformation pre-alloyed powder.
2.4.4. Strain rate sensitivity
The strain rate sensitivity is known to be profoundly influenced by temperature [Citation64]. Gkatzogiannis [Citation65] considered the strain rate dependency in welding simulations. Although not as high as the strain rates observed in crash analyses, the strain rate deviates from the static case
. Strain rates approaching
were observed at the interface of the heat-affected zone (HAZ) and the fusion zone in the welding of structural steel S355. The strain rate dependency of the yield stress in the structural analysis was determined using the model proposed by Perzyna [Citation66].
(20)
(20) where
is the equivalent plastic strain rate,
refers to the static yield stress,
defines the yield stress at the investigated strain rate, and
and
are coefficients with no physical meaning. A deviation of 150 MPa was observed in the residual stresses of the FE simulation with the strain rate dependency compared to the FE simulation with a static model. The results imply that the strain rate dependency should be included when high accuracy is required; otherwise, it can be neglected since the deviation had a negligible influence on the overall residual stresses of the profile. Draxler et al. [Citation47] predicted the crack susceptibility in the welding of Varestraint tests of alloy 718. The simulation was performed using data from different strain rates and temperatures. A rate-independent plasticity model was used between
, the Chen’s rate-dependent flow stress model [Citation67] at the temperature range
, a simple rate-dependent material model based on the work of Antonsson and Fredriksson [Citation68] was used between
and a flow stress model for soft isotropic solids was used when
.
2.4.5. Poisson’s ratio
The Poisson’s ratio relates the transverse strain to the axial strain. The Poisson’s ratio increases with temperature [Citation37,Citation54]. This is explained by a change in the flow stress of most materials from elastoplastic behaviour at low temperatures to visco-plastic behaviour at high temperatures. Babu et al. [Citation42] approximated the variation of the Poisson’s ratio () and the temperature as:
(21)
(21) where
refers to the temperature in Celsius. A constant Poisson’s ratio is used in some studies because
has little influence on plastic deformation compared to the Young’s modulus [Citation47,Citation49].
The overall effects of mechanical properties are summarised in [Citation44]. Apart for the yield strength, the mechanical properties at room temperature reasonably predict the transient temperature fields, residual stress, and distortion. The variation of mechanical and thermal features with temperature is well understood and replicable in the low-temperature range. However, measurements become very difficult close to the melting temperatures of materials due to contamination, reliability, and difficulties in fixing specimens.
Some raw data available for the temperature-dependent properties is provided in to serve as a reference for finite element modelling. The raw data is mainly provided by government agencies and manufacturers. Temperature-dependent properties of several nickel-base, cobalt–nickel and iron-nickel super alloys are provided on the website of Special Metals Corporation and the nickel institute [Citation69].
Table 1. List of publications with raw data on temperature dependent physical properties.
2.5. Phase transformation
Layer-by-layer material deposition in AM causes repeated melting and re-melting of the material, as indicated in . The numerous solid-state and liquid–solid phase transformations modify the microstructure and properties of AM components. The thermal history of the part is different at each point and depends on the AM process, deposition strategy, and process parameters. This leads to the creation of multi-phase components with a heterogeneous distribution of the phases, microstructure, and residual stresses [Citation81]. Phase transformations are predicted by density-based models that couple macroscale heat transfer to create the process-microstructure simulation rather than predict the actual grain morphology evolution [Citation82]. The volumetric phase fractions are derived from phase transformation kinematic models that use volumetric field data (time, temperature, and strain rate).
Figure 4. Diagram of physical state change between raw/liquid/solid states (RLS) [Citation83].
![Figure 4. Diagram of physical state change between raw/liquid/solid states (RLS) [Citation83].](/cms/asset/e2767169-d2bd-4c2f-892d-bc56f8ca81e7/nvpp_a_2356079_f0004_oc.jpg)
The choice of phase transformation models depends on the AM material and process conditions. In the following sections, we present a summary of materials commonly used in AM and semi-empirical phase transformation models.
2.5.1. Commonly used materials in AM
FE simulations of metal AM has mainly concentrated on steels, titanium, nickel, and aluminium alloys. AM also offers the possibility of developing new alloy systems by mixing material powders or rods and altering process conditions to achieve desired properties. It is widely accepted that the next critical step in the advancement of metal AM will be the development of process-specific alloys [Citation84]. shows the different metal alloys investigated in AM processes in the decade between 2013–2023 (source: clarivate web of science).
Steels
Figure 5. A pie chart of publications of the recent 10 years (2013–2023) for different AM alloy systems.
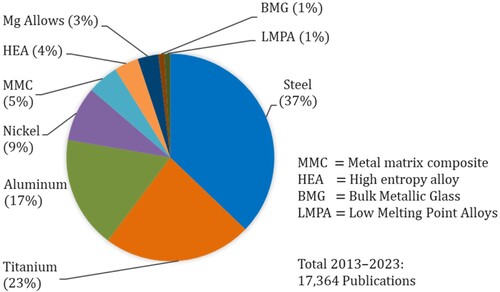
Steels are among the most widely used materials in AM due to their low cost, good corrosion resistance, high ductility, and reasonable strength. As the material solidifies at the liquidus temperature, the martensite start-temperature is determined by the carbon content of the steel, while the ferrite and bainite transformation kinematics are mainly influenced by the alloying elements (manganese, nickel, and chromium). The alloying elements control the driving force for austenite decomposition. During rapid weld thermal cycles, alloying elements and precipitates fail to completely solutionize and cause inhomogeneity in the austenite. Hence, continuous cooling transformation (CCT) diagrams derived from short-time holds in the austenitic temperature range are more suitable for predicting the HAZ_CCT behaviour in AM than the conventional approach of holding the specimen for over an hour above the austenite temperature [Citation85]. Due to high solidification rates, columnar cellular or dendritic microstructures have been observed in AM steel components, compared to equiaxed grain structures in the wrought or annealed state [Citation86].
Titanium
Most research on FE simulations of AM of titanium has been performed on the Ti-6Al-4 V alloy because of its beneficial properties, such as lightweight, high strength, good corrosion resistance, and excellent mechanical performance at high temperatures. At room temperature, Ti-6Al-4 V comprises a hexagonal closed-packed α phase () and a 5-10% body-centred cubic β phase (
). At temperatures approaching the transus temperature (882°C), the α phase converts to the body-centred cubic β phase. The phase transformation that occurs as the material temperature decreases below the transus temperature depends on the cooling rate. For example, the
phase of Ti-6Al-4 V changes to
phase for diffusionless transformation and
phase for diffusion transformation, as shown in . Pegues et al. [Citation87] present some commonly observed microstructures in the AM of Ti-6Al-4 V and their influence on mechanical properties.
Aluminum
Figure 6. (a) Phase transformations of titanium alloys. (b) Overview of phase change model for Ti-6Al-4 V.[Citation88]
![Figure 6. (a) Phase transformations of titanium alloys. (b) Overview of phase change model for Ti-6Al-4 V.[Citation88]](/cms/asset/d7b93738-7cc2-445b-a595-2c23c3d70b68/nvpp_a_2356079_f0006_oc.jpg)
The commercial usage of AM components made from aluminium is limited compared to parts made from steel and titanium alloys. Nevertheless, the cost of AM aluminium components is lower compared to the other alloys. Aluminium is hardened mainly by the formation of precipitates (solid-state transformation) that are formed in different alloy systems. The main alloy systems in most AM studies consist of the Al–Si (Mg) system, the Al-Cu system, the Al-Zn-Mg system, and the Al-Mg-Sc-Zr system [Citation89]. The dissolution of the alloying elements occurs by holding the material at elevated temperatures. The formation of phases after cooling depends on the ageing temperature. At first, small clusters of solute atoms are formed, which evolve into larger clusters. The clusters induce elastic straining in the surrounding matrix, which strengthens the alloy. Kannan et al. [Citation90] reviewed the AM of AA2024 and AA6061, two heat-treatable alloys with high strength and a good strength-to-weight ratio.
Inconel
Inconel is a nickel-based superalloy extensively used in aerospace, energy, and other industries because of its excellent properties (tensile strength, creep strength, weldability, and corrosion resistance at elevated temperatures). Repeated heating in the AM produces components with substantially different microstructures compared to parts made by casting and forging. Inconel is hardened by precipitation. Lu et al. [Citation91] studied the evolution of precipitates in multi-layer and multi-pass WA-DED using thermo-mechanical-metallurgical phase transformation kinematics. The microstructure changes include nucleation, growth, and collision of grains. Gao et al. [Citation92] investigated the effects of different solution heat treatments on the microstructure and high-temperature mechanical properties of Inconel 718. The distribution and morphology of the δ phase in the γ matrix determined the mechanical properties.
2.5.2. Semi-empirical phase transformation equations
In this section, mainly semi-empirical models that predict the decomposition of the austenite into different phases upon cooling are presented, since the heating process to austenitic temperatures typically has negligible influence on the final phase distribution. The semi-empirical models are derived from CCT diagrams. The models used in the heating process are presented when provided in the literature. Above the austenite temperature, the parent (austenite) phase is assumed to constitute 100% of the material. The phase fracture of the products depends on the cooling rate. Commonly used phase transformation models in macroscale simulations are presented in .
Table 2. Phase transformation kinematic models.
Most studies use the KM model for diffusionless phase transformation and the JMAK (JMA) for diffusion phase transformation. Diffusion phase transformation refers to phase transformations that occur by atomic diffusion, i.e. an interchange of the positions of different atom species in the crystal lattice. Diffusional transformations usually happens when the cooling rate from the austenitic temperature is slow (lower than ∼400); otherwise, non-diffusional transformations occur. A few studies use the Leblond model to simulate diffusional phase transformation. In most studies, austenite decomposition is modelled by a combination of diffusional and non-diffusional transformations to replicate experimental findings. The linear mixture rule [Citation42], the nonlinear mixture rule [Citation57], the rule of mixtures [Citation97], the lever rule, or Scheil’s additive rule are commonly used to define the mixture rule of phase transformations. presents phase transformation models and materials in the AM literature.
Table 3. A summary of phase transformation models in AM simulation.
2.5.2.1. Diffusional phase transformations
Johnson-Mehl-Avrami-Kolmogrov (JMAK) model
Diffusion transformation in AM is widely modelled using the austenite decomposition procedure proposed by Johnson and Mehl [Citation117], Avrami [Citation118], and Kolmogorov (1937). The model and its derivatives is usually abbreviated as JMA, JMAK, or KJMA and describes the time evolution of transformed phase fractions of materials (Ti-6Al-4 V, steels, and Inconel). Fan et al. [Citation5] modelled the phase transformation in the laser AM of Ti-6Al-4 V. The heating phase was performed using the JMA model. Superheating and undercooling were controlled by the k and n parameters of the JMA model. Depending on the rate of cooling, the β-phase is transformed into the α and/or αʹ-phase(s). Vastola et al. [Citation103] compared the evolution of the microstructure of Ti-6Al-4 V manufactured by electron beam-DED and LPBF. At fast cooling rates, the dissolution of the β-phase into the αʹ-phase was described as in [Citation119].
(22)
(22) The distribution of the αʹ-phase was more abrupt in LPBF compared to electron beam-DED, which is explained by the lower build temperature and higher thermal gradients in LPBF, which limit the areas for martensite formation.
Murgau et al. [Citation99] coupled the phase fraction and microstructure evolution (α lath size) in FE simulation to solve the temperature field, phase change, and microstructural evolution problems in GTAW of Ti-6Al-4 V. It was envisaged that the microstructure from the FE simulations could predict the future material properties of AM components. Irwin [Citation101] implemented Kelly's microstructure model and Charles’ lath width model to study the influence of process parameters (dwell time) on the microstructure in AM of Ti-6Al-4 V. The growth and nucleation of the α-phase were described by the JMA model. The α lath width is defined by the work of Charles, following the Arrhenius equation.
(23)
(23) where kw is the prefactor, −Tact is the activation temperature and Ti is the actual temperature.
Babu et al. [Citation42] presented a microstructural thermo-mechanical model to predict residual stresses and distortion in the AM of Ti-6Al-4 V. The phase evolution was defined by the JMA model. An advanced isotropic plasticity model (with long- and short-range stress components, a hardening process, and the evolution of immobile dislocation density) was used to define the flow stress. Beyond the fourth welding pass, there was no change in the material’s microstructure. This is corroborated by results from the literature.
Leblond
The Leblond diffusion-controlled phase transformation model [Citation96] has been implemented in the FE simulation of AM. Chen et al. [Citation63] investigated the microstructure evolution and resulting residual stresses in the AM of low-temperature transformation (LTT) pre-alloyed powders. The Leblond model was used to describe the ferrite-austenite transformation during heating and cooling. The KM phase transformation model expressed the inverse displacive-controlled transformation from austenite to martensite. Gkatzogiannis [Citation65] examined the effects of strain rate in the FE investigation of welding and included the effect of Leblond phase transformation. Ali and Han [Citation57] investigated the influence of five scanning strategies on the residual stresses and warpage in WA-DED with a single-layer deposition. Two material models (with Leblond phase change and without phase change) were simulated to determine the influence of phase change on the predictions.
2.5.2.2. Diffusionless transformations
Koistinen–Marburger (KM)
The KM model mainly describes rapid cooling (diffusionless transformation) in the literature and is valid for many ferrous alloys [Citation120]. Jimenez et al. [Citation98] compared the residual stresses (XRD) in WA-DED of B91 steel to data from thermo-mechanical simulations. The residual stress prediction improved in the phase transformation model by over 230%, demonstrating that phase transformation should be included in the simulation of WA-DED in the process development stage. Zhang et al. [Citation6] modelled the phase transformation of AF1410 steel based on continuous cooling transformation (CCT) curves obtained by thermomechanical tests. The residual stresses from the FE simulations were validated by the advanced contour method and X-ray diffraction (XRD). In the same light, Zhang et al. [Citation39] showed that the microstructure of AF1410 steel in multi-pass welding is mainly composed of martensite. Phase transformation caused deformation and residual stresses during cooling. Depradeux et al. [Citation106] performed thermo-mechanical-metallurgical FE analyses of the rapid additive forging of TA6 V.
2.5.2.3. Combining phase transformation equations
Most AM studies with phase transformations include diffusional and diffusionless phase transformations. Zhang et al. [Citation83] presented a combined experimental and numerical methodology to estimate the process-structure–property-performance relationships of AM components. The KM model was used to simulate rapid cooling, while the JMA model was used to predict slow cooling and (re)heating operations. The methodology was verified on Ti-6Al-4 V and steel 5140. Salsi et al. [Citation102] combined the JMAK and KM phase change laws to predict the phases in the LPBF of Ti-6Al-4 V. The JMAK model was used to model the slow cooling of the β phase to alpha Widmanstätten , while the K-M model was used to predict fast cooling (formation of alpha martensite,
). The additivity rule is used to describe phase evolution. Reheating was performed to account for incomplete and multiple-phase transformations in AM. Baykasoğlu et al. [Citation82] simulated the microstructure of Ti-6Al-4 V produced by powder L-DED. The metallurgical phase transformation from the beta-transus temperature included the effects of Widmanstätten colony alpha, basketweave alpha, grain boundary at slow cooling rates, and martensite alpha at high cooling rates. The microstructure evolution model was validated by comparing the volumetric phase fractions of the model to the literature. Murgau et al. [Citation109] developed analytical models that predict solid-state transformations of Ti-6Al-4 V subjected to arbitrary temperature changes. The
phase dissolves into three
phases (widmannstätten αwid, grain boundary αgb, and martensite) after cooling. The diffusionless transformation (
) was modelled in the KM model. The JMAK model was modified to include incomplete transformation, multiple-phase transformation, and multiple heating and cooling cycles.
2.5.2.4. Phase transformation in multiple heating and cooling
The phase composition of a material may alter if the material is heated to sufficiently high temperatures by successive AM layers. The previous heating cycles have an effect on the phase transformation during reheating. In light of this, Xie et al. [Citation104] implemented a general physics-based framework to perform thermal and mechanical analysis of AM. Rapid cooling was modelled with the KM model. The JMA model was used for slow cooling and re-heating. Similarly, Crespo [Citation94] modified the diffusional transformations in the AM of Ti-6Al-4 V with repeated heating and cooling cycles. If the deposited material is composed mainly of, reheating leads to diffusion-controlled
transformation. Alternatively, if the microstructure is martensitic (
), at temperatures above 400°C
converts to
. The second diffusion transformation of the fraction of the α phase
is described by the JMA equation:
(24)
(24) where
is the reaction rate constant and
is the Avrami exponent at the temperature
for the time interval,
. In the next reheat interval, the transformation temperature is assumed as
. If we consider the phase fraction of α in the previous step
, the α phase in the next time interval
is obtained by
(25)
(25)
The generalised form of the equation of the α phase fraction at an arbitrary time step at temperature
is written as
(26)
(26) If martensitic decomposition is incomplete, the microstructure consists of
. During cooling, the
phase converts to
phase if the cooling rate is lower than ∼400
. At cooling rates higher than 410°C/s, the
phase is retained or converted to
phase depending on the volume fraction of
. The martensitic transformation was modelled using the KM transformation. Confer [Citation94] for the full definition of terms in Equations (24)–(26). Klusemann and Bambach [Citation110] used the modified JMAK in [Citation109], the KM model, and the parabolic growth rate to predict the martensite phase in laser metal deposition of Ti-6AL-4 V. shows the phase evolution with temperature in the AM of Ti-6Al-4 V.
Figure 7. (a) Temperature variations vs time. (b) Corresponding simulated αgb, αwid, and β phase fractions vs time. (c) Corresponding simulated αgb, αwid, and β phase fractions vs. temperature. [Citation99].
![Figure 7. (a) Temperature variations vs time. (b) Corresponding simulated αgb, αwid, and β phase fractions vs time. (c) Corresponding simulated αgb, αwid, and β phase fractions vs. temperature. [Citation99].](/cms/asset/16eaa014-d393-4e8d-8c66-96fb4046c2a8/nvpp_a_2356079_f0007_oc.jpg)
The studies presented so far are mainly based on CCT and TTT. However, AM processes cause isothermal, non-isothermal, and kinematic transformations due to multiple heating and cooling. Tchuindjang et al. [Citation100] proposed a new concept to simplify phase change modelling that considers the time-temperature transformation (TTT), continuous cooling transformation (CCT), and continuous heating transformation (CHT). They introduced a time-phase transformation block (TTB) to account for TTT, CCT, and CHT since the temperature and process parameters in AM are constantly changing and affect the microstructure. The different phase transformation mechanisms were activated depending on the temperature value and the heating or cooling rate. The microstructure can be predicted based on a good understanding of the phase changes predicted by phenomenological models like JMAK, KM, or neural network-based models.
2.5.3. Hardness prediction from phase transformation
The hardness of the material is thought to be the same as the weighted average hardness of its different phases. This is based on mixture laws that explain how different fractions of a single phase affect hardness. Costa et al. [Citation105] identified martensite and austenite as the main phases in AISI 420 steel. They used the following equation to derive the hardness of the AM component:
(27)
(27) where
and
refer to the hardness of austenite and martensite respectively, and
is the volume fraction of austenite. The softening of the material caused by non-isothermal tempering of martensite was approximated by Réti et al. [Citation121] using the following equation:
(28)
(28) where
defines the hardness of martensite,
is the universal gas constant,
refers the activation energy, and
and
are fitting constants. Using the same formulation, Costa et al. [Citation122] coupled the hardness and volume fraction of martensite to the temperature evolution in laser powder deposition of a thin wall of AFNOR NF 50CV2 steel. Similarly, Crespo and Vilar [Citation107] investigated the phase transformation of Ti-6Al-4 V using the JMA equation. Anisothermal conditions and the additivity rule were used to obtain the phase concentrations. A rule of mixtures is used to calculate hardness.
2.6. Coupling of physical metallurgical effects in macroscale AM simulations
High temperatures in AM processes lead to changes in the microstructure of materials, affecting the mechanical properties of AM components [Citation88]. Achieving a homogeneous microstructure in entire AM parts facilitates process design; however, certain components may require varied microstructures in various portions. Thermo-mechanical FE simulations can be conducted to match the microstructure and temperature evolution of AM components without explicitly coupling them. For instance, Tran et al. [Citation52] correlated the microstructure and temperature evolution at 3 points in laser cladding involving re-melting stages. Rapid heating rates caused a shift of the transformation points, including, and solidus, while re-melting caused pseudo-isothermal annealing. While such models improve the predictability of FE simulations, coupling microstructure to FE simulations is essential for process chain simulations and performance evaluation.
2.6.1. Physically based flow stress
Physically-based flow models can model the properties of individual phases and microstructure evolution, thereby providing a better description of phenomena in AM simulations. In the last decade, microstructure-coupled FE simulations have been employed to predict AM component microstructure, minimise statistical variability, and simplify design [Citation123]. Physically based flow stress models of materials are determined using a material volume that represents the slip systems, mobile dislocations, grain size, etc. The models assume that the motions of dislocations are the dominant source of plastic strain. The physically-based flow stress models can reveal intrinsic physical mechanisms and represent multifaceted microstructure evolution [Citation124,Citation125]. The models can be found in [Citation42,Citation88,Citation126,Citation127]. The flow stress consists of the long-and short-range stress components.
(29)
(29) where,
refers to the interactions with the dislocation substructure (forest dislocations),
is the Hall-Petch effect, and
is the friction stress needed to move dislocations through the lattice and to go pass short-range obstacles (solutes or precipitates).
2.6.1.1. Long-range stress component
The long-range stress component is the physical basis for the strain hardening of metals and is defined by [Citation128] as
(30)
(30) where
is the Taylor orientation factor,
refers to the proportionality factor,
represents the shear modulus,
is the Burger’s vector and
represents the immobile dislocation density. The evolution of the dislocation density,
in Equation (30) is computed to describe the hardening and restoration processes.
(31)
(31)
During hardening, mobile dislocations are assumed to move a distance (mean free path) on average before they are annihilated or immobilised. The mobile dislocation densities and their velocities are assumed to be proportional to the effective plastic strain rate
[Citation129].
(32)
(32) where
refers to the density of mobile dislocations,
describes the average velocity of dislocation densities, and
is the Taylor lattice factor. The immobile dislocation density
is also assumed to follow the same relationship as the mobile dislocation densities [Citation130]. Thus,
is defined as
(33)
(33)
The mean free path is determined by the grain size (g) and dislocation sub cell or sub grain diameter (s) as follows:
(34)
(34) others here represent obstacles like precipitates, martensite lathes, interstitial elements, etc. The formation and evolution of the sub cells are based on a relationship proposed by [Citation131].
(35)
(35)
The restoration processes
Babu et al. [Citation42] considered the mechanisms in restoration processes as a combination of dislocation glide, dislocation climb, and globularization.
(36)
(36) Dislocation glide is modelled based on the Bergström formulation.
(37)
(37) where
refers to a temperature dependent function. Militzer et al. [Citation132] proposed a model for dislocation climb based on the works of [Citation133] and [Citation134].
(38)
(38) where
is a material coefficient,
is the apparent diffusivity that includes the weighted factions of the phases, and
defines the equilibrium value of the dislocation density. Sargent et al. [Citation135] observed static and dynamic coarsening of grains in Ti-6Al-4 V at elevated temperatures (850°C). Coarsening results in the grains becoming more globular, hence the term globularization. Babu and Lindgren [Citation126] modelled the evolution of the dislocation density during globularization. The effect of grain growth on the reduction of flow stress is considered above the critical value of dislocation density
where
is a calibration constant and
is the rate of globularization. Based on the observation that during deformation and shortly afterwards, globularization is due to dislocation sub-structuring resulting in boundary split and edge spheroidization in Ti-6Al-4 V by Semiatin et al. [Citation136], Thomas and Semiatin [Citation137] modelled a two-stage process of static and dynamic recrystallization. They proposed Equation (39) to model globularization since there are similarities between recrystallization and globularization.
(39)
(39) where
,
and
are the volume fractions of the total, dynamic and static components of the globularization respectively. If the grain growth and static recrystallization are assumed to be driven by the same driving force, the static recrystallization can be determined by
(40)
(40) where
is a material parameter. The rate of globularization is modelled based on [Citation137]
(41)
(41) where
and
are material parameters.
2.6.1.2. Hall-Petch
The Hall-Petch effect leads to the activation of slip systems in neighbouring grains and is derived from
(42)
(42) where
refers the grain size and
is a coefficient that depends on the critical resolved shear stress of the material and shear modulus. The Hall-Petch effect has an indirect temperature dependence due to changes in elastic properties and is defined as
(43)
(43) where
defines the shear modulus at the current temperature and
is the shear modulus at room temperature. However, the temperature dependency of
is not valid for very small grain sizes.
2.6.1.3. Short-range stress component
The short-range stress component is the material’s resistance to plastic deformation due to short-range interactions formulated by Mecking and Kocks [Citation130]
(44)
(44) where
describes the activation energy needed to overcome lattice resistance,
is the reference strain rate,
refers to the shear strength in the absence of thermal energy,
represents the dislocation velocity,
is the temperature in Kelvin,
is the Boltzmann constant and
are calibration parameters. Furthermore, phenomena like precipitation hardening, vacancy annihilation and a fine α lath width increase
.
2.6.1.4. Precipitation hardening
Lindgren et al. [Citation88] included the contribution of precipitate hardening in the AM of Inconel. The stress required to move a dislocation past an obstacle is defined based on [Citation138] by:
(45)
(45) where
refers the mean obstacle strength and
is the average particle spacing in the slip plane.
2.6.1.5. Vacancy evolution and annihilation
Materials generate excess vacancies when subjected to deformation or temperature changes. Assuming that only long-range stress causes vacancy formation and considering the contribution of temperature change, Militzer et al. [Citation132] proposed the following model for excess vacancy concentration with generation and annihilation components:
(46)
(46) where
is the atomic volume,
is the fraction of mechanical energy spent on vacancy generation, and
is the neutralisation effect by vancancy emitting and absorbing jogs.
2.6.1.6. α lath width prediction
The α lath width is a key microstructural parameter that determines the mechanical properties of Ti-6Al-4 V. Irwin [Citation101] modelled the α lath width by
(47)
(47) where
refers to the α phase fraction, and
describes the equilibrium α lath width, determined by,
(48)
(48) where
describes the Arrhenius pre-exponential factor and
is the activation energy. Furthermore, Yang et al. [Citation113] modelled the dislocation density at the interior and boundary of the
lath using 2 separate equations to consider the pile-up effect.
lath interior (
) was defined by
(49)
(49) where
refers to the Youngs modulus of
,
defines the thickness of
,
is the Poisson’s ratio,
represents the shear modulus of
,
is the burgers vector of
,
describes the transformation strain from β.
lath boundary (
) was defined by
(50)
(50) where
is the number of
dislocations per metre of boundary,
represents the lath perimeter and
is the
section area. Other definitions used in the model are found in [Citation113].
2.6.2. AM studies with physically based flow stress
Microstructure-coupled FE simulations have been performed principally on Ti-6AL-4 V due to the highly desired characteristics of AM components made from Ti-6AL-4 V. Lindgren et al. [Citation88] implemented a multi-class approach to modelling the nucleation, growth, and coarsening of precipitates. The method predicts the distribution and evolution of particle size in spatial space based on the dislocation density. The athermal long-range contribution of the flow stress was modelled while considering the interactions of dislocations and dislocation substructures (strain hardening) and the interactions between mobile and immobile dislocation densities (the Hall-Petch effect).
The size dependency of AM components increases the necessity of determining the microstructure by FE simulation before production. Promoppatum et al. [Citation112] investigated the effect of feature size on the cooling rate, phase composition, and grain size of laser-deposited Ti-6AL-4 V. The Hall-Petch model determined the grain size. Overall, there was a slight change in the yield strength and phase composition due to part size. Mirkoohi et al. [Citation139] compared the residual stresses predicted by a physical model and the Johnson-Cook empirical flow stress model in the direct metal deposition of Ti-6Al-4 V. The physically-based model outperformed the Johnson-Cook model because it included material attributes like grain size and dislocation density in the flow stress. To reduce the simulation time, Lundbäck and Lindgren [Citation140] applied the lumping of welds with a physically based material model. Overall, the computed temperatures and part displacements were close. However, microstructural investigations were not performed to validate the approach.
The FE determination of the mechanical properties of AM components made from materials other than Ti-6AL-4 V is in the initial stages and not widely reported in the literature. Eskandari Sabzi and Rivera-Díaz-del-Castillo [Citation141] proposed a methodology to predict the yield strength of three different alloys (Ti-6Al-4 V, IN718, and 316L) produced by LPBF. Hardening and softening were revealed by four principal mechanisms: Kock-Mecking’s contribution , Taylor strengthening
, thermal straining
, and heat dissipation cooling
. Kock-Mecking’s, Taylor strengthening, and thermal straining are the mechanisms that control superior mechanical properties. Kock-Mecking’s contribution had the most significant effect on yield strength.
It remains challenging to predict the mechanical properties of AM components because of the influence of multiple process parameters on the microstructure. A summary of the literature on physically based flow stress models used in AM process simulation is provided in .
Table 4. Summary of physically based models in AM simulation.
3. Modelling the post-processing of AM components
Models used in the post-processing of AM are divided into the following categories: flow stress models for forming operations, performance analysis models, and models used in machining operations. FE simulations of the processes require material models that account for thermal, mechanical, and microstructural phenomena. Coret and Combescure [Citation108] described the coupling mechanisms in material models for traditional manufacturing processes in .
Figure 8. Coupling mechanisms [Citation108].
![Figure 8. Coupling mechanisms [Citation108].](/cms/asset/0134d12d-f1ee-4010-9445-df9c5ee8650d/nvpp_a_2356079_f0008_ob.jpg)
3.1. Forming AM components
Post-forming of AM components is usually executed using empirical flow stress models [Citation4,Citation143]. Empirical flow stress models assume that AM components are homogenous with no metallurgical alterations (phases or microstructures). However, AM parts undergo significant thermal fluctuations in production, resulting in enormous microstructure variation within a single part and across production batches.
Hot forging is commonly applied to large AM components to reduce processing and solidification defects, attain anisotropic properties, and modify the microstructure to improve the mechanical properties. Empirical flow stress models based on experimental data have been developed to simulate hot forging [Citation144–146]. Niu et al. [Citation147] compared the predictive power of empirical (Johnson-Cook, Fields-Backofen, and strain-compensated Arrhenius) models in predicting flow stresses during the hot forming of powder L-DED Ti6-Al-4 V alloy. Motallebi et al. [Citation148] reviewed the hot deformation behaviour and empirical flow stress models used in the deformation of AM components. In this section, only semi-empirical and physically-based flow stress models are reviewed to propose process chain simulation frameworks that include the effects of microstructure and phase change.
Semi-empirical and physically based models
Few studies have used semi-empirical or physically-based flow stress models in the FE simulation of AM components. Bambach and Sizova [Citation149] presented a semi-empirical model of the flow stresses in the hot working of Inconel 718 specimens produced by LPBF, powder L-DED, and a conventional wrought alloy that considers DRX. The flow stress due to strain hardening or softening is defined by
(51)
(51)
They also defined the peak strain, maximum low stress, critical strain for initiation of DRX, and phase change DRX kinematics. The rule of mixture was used to define the interaction of the phases:
(52)
(52) In another work, Bambach et al. [Citation150] correlated the microstructure and flow stress of Ti-6AL-4 V processed by powder L-DED, LPBF, and the wrought material. The model considers the microstructure (α+β phases) and predicts the flow stresses for the individual processes. The flow stress of the β-phase is derived from the following equation:
(53)
(53)
and
are defined as:
(54)
(54)
(55)
(55) where
refers to the peak stress,
is the peak strain,
represents the steady-state stress,
is the steady-strain strain, and c,
,
are constants. The flow stress of the α-phase was modelled based on the physical flow stress model implemented in [Citation151]. The flow stress
is defined by:
(56)
(56) where
represents the average Taylor factor,
refers to the athermal long-range component of the flow stress which includes the effects of grain boundaries and stress field of dislocation forests, and
is the thermally activated stress. The microstructure model was performed by defining the dislocation density, grain size, and globularization. The Hall-Petch coefficient
was defined and the dislocation density was calculated using the Kocks-Mecking model, which considers dynamic recovery and work hardening. The complete definition of terms is found in [Citation150].
Other investigations have been done on forming post-AM components using physically-based flow stress models. Galindo-Fernández et al. [Citation152] developed a physically based model to describe the flow stress and yield strength of Ti-6Al-4 V with seven different microstructures (3 for cast and wrought components and 4 AM components). The model considered relevant microstructural features by linking the strengthening mechanisms, grain size, the former grain boundary morphology, and phase volume fractions. The yield strength was mainly determined by the relative fractions and morphologies of the α, and β phases. Hayes et al. [Citation153] developed a physically based model to predict the yield strength of Ti-6Al-4 V across 3 heat treatments (stress relief annealing in the α+β phase field, hot isostatic pressing in the α+β phase field, and β-annealing) to an accuracy of 5%. A summary of studies using these models is presented in .
Table 5. Summary of physical models used in modelling forming operations of post-AM components.
3.2. Machining of AM components
Subtractive manufacturing operations (machining) are usually performed after AM to achieve part accuracy and precision. However, machining may negatively affect the residual stress state on the part surface and reduce fatigue life [Citation155]. Hence, FE simulations on the machining of AM components are required to develop strategies to minimise unfavourable residual stresses and geometrical deviations induced in AM and to study complete process chains that involve machining.
Salonitis et al. [Citation156] predicted the residual stresses and geometry of a structural steel manufactured by the laser cladding process and subsequently processed by high-speed machining (HSP) in FE simulations. The thermal and mechanical loads imposed by the tool were neglected. Only elastic properties were assigned to the AM component. Machining was performed by deleting elements in the target area. The FE simulation results were not validated with experiments. Koenis et al. [Citation157] performed EDM after wire L-DED to achieve part geometrical accuracy. The mesh of the final component was included in the original mesh and used throughout the process chain simulation to facilitate the transfer of previous simulation results by mapping the original mesh, thus limiting errors. Machining was performed as proposed by Salonitis et al. [Citation156]. The process chain simulation results matched the temperature and deformation profiles measured in the experiments. Furthermore, Afazov et al. [Citation158] developed a method for the precision manufacture of nuzzles with high geometrical accuracy and surface tolerance. The additive and subtractive processes were performed using element birth-and-death techniques. Additive-subtractive hybrid manufacturing was performed on thin-walled 316 steel parts [Citation77,Citation159,Citation160]. Experiments and simulations revealed that machining induces compressive stresses, which reduce the residual stresses from the AM process. Luo et al. [Citation160] present good agreements between temperature and deviation for AM experiments and simulations. The residual stresses post-milling mostly followed the same trend in the experiment and simulation; however, the forces in the milling operation were different in the experiment and FE simulation. The flow chart implemented to simulate the machining operation in He et al. [Citation159] is presented in .
Figure 9. Flowchart of additive manufacturing and machining FE simulations [Citation159].
![Figure 9. Flowchart of additive manufacturing and machining FE simulations [Citation159].](/cms/asset/5818aa83-b3df-4db9-b315-abf783b49373/nvpp_a_2356079_f0009_oc.jpg)
3.3. Performance analysis
Repeated heating in AM may alter the microstructure, cause phase transformation, and modify the crystallographic texture [Citation161]. In some instances, moderate to superior mechanical properties have been observed in AM components compared to wrought materials. For instance, Spierings et al. [Citation162] revealed that the fatigue life of SS316L produced by LPBF was 25% lower than the conventional material at low-stress values, and the fatigue life is comparable at high-stress. Bronkhorst et al. [Citation163] showed that as-built AM 316L steel has 1.7 times the flow stress of wrought and heated-treated samples. The flow stress difference was attributed to the complex grain morphology and high initial dislocation density (2.5 times) in the as-built material compared to the wrought material. Riemer et al. [Citation164] found that the fatigue performance of as-built 316L steel produced by LPBF compared to conventionally processed material.
Porosity, incomplete fusion, and other defects may negatively affect the performance of AM components. To utilise AM components in load-bearing applications, it is essential to understand their mechanical response under static and dynamic loading before they can be adopted in engineering material selection and processing. In addition, the effects of deposition strategies and other process parameters on the part’s performance need to be identified. Experiments and FE simulations have been performed to describe the deformation and failure of AM components.
3.3.1. Forming limits of AM components
The forming limits of AM components have been investigated using in-plane tests, uniaxial tensile tests, notched tension, equibiaxial tension, and shear tests. The lower bound of test results is often considered the forming limit of AM components due to the wide scatter of mechanical properties [Citation165]. The mechanical properties of the components are usually defined by flow curves derived from empirical laws and yield criteria. The forming limits are defined by various ductile failure formulations. Stress-based forming limit diagrams have been investigated due to the dependency of failure on the stress state. A few studies are reviewed in the following paragraphs to indicate commonly implemented failure models used in forming limit predictions in FE simulations of AM components (see ).
Table 6. Flow laws, yield criteria and failure models used in forming limit prediction of AM components.
Roth et al. [Citation1] compared the microstructure and mechanical properties of AM (LPBF) and cast AlSi10Mg. FE simulations were performed with a stochastic Voce hardening law, a non-quadratic plasticity model with in-plane isotropy, and the probabilistic Hosford-Coulomb fracture initiation model. The ductility was lower for LPBF-printed parts. The proposed stochastic models can be used to assess the performance gap when replacing castings with LPBF parts. Along similar lines, Nalli et al. [Citation166] investigated the ductile fracture of wrought and LPBF-produced AlSi10Mg, Ti-Al-4 V, and 17-4PH in different stress triaxialities. The maximum formability was calibrated for four failure criteria. The wrought parts had higher formability than the AM components, and formability increased for the machined AM parts.
Formability is strain rate-dependent for some materials. Li et al. [Citation4] compared the rate-dependent plasticity of stainless steel 316L produced by the LPBF process and wrought material, see . The Hill yield parameter and a combination of the Swift and Voce models were used to describe the hardening law in FE simulations to match the tension tests. Failure was defined by the Johnson and Cook failure model. Similarly, Tancogne-Dejean et al. [Citation167] determined the rate-dependent mechanical properties and the fracture behaviour of binder-jetted stainless steel 316L. The modified Johnson-Cook flow stress model, Hill’s 48 non-associated flow role, and the Hosford-Coulomb ductile failure model were used to describe the stresses and strains in the tension experiments. Binder-jetted parts had equivalent plastic strains that were consistently lower than wrought (cold-rolled) material and LPBF parts. The low formability was explained by the porosity of parts, which was revealed by the fractured surfaces.
Figure 10. Comparison of the properties of additively manufactured (AM, solid lines) with cold-rolled (dashed lines) stainless steel 316L: (a) Engineering stress-strain curves as obtained from quasi-static uniaxial tension experiments at nominal strain rate of 0.001/s at 0°, 45° and 90° with respect to the building or rolling direction. (b) Hosford-Coulomb fracture envelopes for plane stress conditions in the equivalent plastic strain versus stress triaxiality plane and (c) fracture surface as a function of triaxiality and Lode angle parameter [Citation4].
![Figure 10. Comparison of the properties of additively manufactured (AM, solid lines) with cold-rolled (dashed lines) stainless steel 316L: (a) Engineering stress-strain curves as obtained from quasi-static uniaxial tension experiments at nominal strain rate of 0.001/s at 0°, 45° and 90° with respect to the building or rolling direction. (b) Hosford-Coulomb fracture envelopes for plane stress conditions in the equivalent plastic strain versus stress triaxiality plane and (c) fracture surface as a function of triaxiality and Lode angle parameter [Citation4].](/cms/asset/322b1053-c2af-4b6d-b305-a8bd762464f7/nvpp_a_2356079_f0010_oc.jpg)
The build orientation and process parameters may cause anisotropy in AM components that influence flow stress and failure. Wilson-Heid et al. [Citation168] proposed a plasticity model for Ti-6Al-4 V LPBF that predicts the anisotropy and stress state-dependent mechanical behaviour. The Swift law was used to describe the evolution of yield strength before necking. The Hill 1948 anisotropic yield function was used to model the multiaxial plastic behaviour. In another study, Wilson-Heid et al. [Citation169] compared the accuracy of the anisotropic Hosford-Coulomb and anisotropic Mohr-Coulomb fracture criteria to predict the failure of LPBF austenitic stainless steel 316L in two orientations. Both models predict the shape of the forming limit diagram. However, the anisotropic Hosford-Coulomb fracture criterion is more performant because it is more sensitive to stress triaxiality and the Lode parameter, and it depends on all three principal stresses. Furthermore, Wilson-Heid and Beese [Citation170] evaluated the performance of six failure models in predicting stress-state-dependent failure of LPBF Ti-6Al-4 V in two build orientations. The modified Mohr-Coulomb (MMC) failure criterion was the best model for predicting the forming limits; however, the MMC requires many tests for calibration. The maximum shear test can predict the failure strains using one test.
Some studies were conducted to investigate the effect of heat treatment on the formability of AM components. Yang et al. [Citation171] characterised the forming limits of annealed and solution-aged Ti-Al-4 V produced by LPBF in different build directions. The annealed material had higher strength and better ductility than the solution-aged material. Similarly, Qin et al. [Citation172] investigated the forming limits of LPBF Inconel 625 in the as-built and stress-relieved states. They showed that stress relief annealing decreased the fracture strain by 45% in the direction perpendicular to the build and increased the fracture strain by 36% in the build direction. The formation of the 10% δ -phase during stress relief annealing explains the difference.
3.3.2. Fatigue and creep limits of AM components
The mechanical properties like yield stress, ultimate tensile strength, and maximum elongation of AM components may be comparable to those of wrought materials [Citation173]. However, process-induced defects usually reduce the fatigue and creep performance of AM parts. This arises from a heterogeneous microstructure distribution in different directions, randomly dispersed defects, geometry/size effects, etc., observed in AM components [Citation174]. Furthermore, anisotropy and post-AM heat treatment may influence the fatigue behaviour of AM components [Citation175]. Hence, estimating the reliability and lifetime of AM components becomes necessary for part safety and certification, especially in components subjected to oscillating stress and high temperatures like in-service aircraft components.
Fatigue
Fatigue failure is caused by damage accumulation or subcritical crack growth that leads to part failure at stress states below the material’s tensile strength. Although the monotonic stress-stress properties of AM components may be superior to those of the rough part, the mechanical properties under cyclic loading need to be examined. Fotovvati et al. [Citation176] reviewed the influence of the microstructure, residual stresses, and surface roughness on the fatigue performance of AM parts. The studies revealed that the fatigue crack growth properties of LPBF and wrought Ti-6Al-4 V are the same in the steady-state crack growth phase for heat-treated and hot isostatic pressed parts. The fracture toughness value can be improved by heat treatment. Similarly, Molaei et al. [Citation177] presented a review of the fatigue performance of AM Ti-6Al-4 V considering the effects of build orientation, process parameters, fabrication machine, heat treatment, and surface condition. Torries et al. [Citation178] presented models to predict fatigue using microstructure and defect-sensitive models. The review contains mostly experimental works, although a sub-section is dedicated to FE-based fatigue prediction. In this section, we present recent models on FE-based fatigue prediction of AM components, emphasising physically based models and the transferability of results from test coupons to AM components.
Lindström et al. [Citation179] proposed a model to simulate the mid-life behaviour of a nickel-based superalloy subjected to thermomechanical fatigue and rate-independent low-cycle fatigue as in gas turbines operating in high-temperature environments. Mooney et al. [Citation180] demonstrated that the anisotropic Hill model was more accurate in describing the cyclic loading than the isotropic plasticity model. Kourousis et al. [Citation181] compared the performances of four advanced rate-independent plasticity kinematic models (multicomponent Armstrong-Frederick, multicomponent Armstrong-Frederick with a threshold term, Ohno-Wang, and multipoint Armstrong-Frederick with a multiplier) in modelling the cyclic elastoplastic behaviour of LPBF Ti-6Al-4 V. All four models demonstrate satisfactory performance. Lindström et al. [Citation182] estimated the fatigue life of LPBF nickel-based superalloys subjected to isothermal cyclic loading at different temperatures using the Ohno-Wang model developed to describe cyclic elastoplastic midlife fatigue behaviour. A cycle-jumping procedure is used to simulate mid-life behaviour.
The geometric dependency of fatigue has been investigated. Zhang et al. [Citation183] demonstrated using FE simulations of WA-DED parts that the residual stresses near the crack tip in compact tension specimens affect the crack growth rate. High stress intensity was recorded at the crack tip. Huynh et al. [Citation184] showed that microtruss structures have lower fatigue performance compared to dog bone specimens produced by direct metal laser deposition of IN718 under the same process conditions.
Li et al. [Citation185] introduced probabilistic dependency to the fatigue limit prediction of AM components to model the dispersion observed in the failure of AM components. Trends in the median fatigue performance of test coupons were transferred to AM components for fatigue prediction. Hypothetically increasing crack initiation sites in the fatigue model of the material by 200% led to a decrease in the median fatigue performance of the test coupon and component by 10% and 5%, respectively. The material changed from a homogenous stress state to a heterogeneous stress state for the coupon and component. This indicates that the results of test coupons can be implemented in designs after considering the size effect. Arbeiter et al. [Citation186] proposed a proof-of-concept to enable rapid, easy, and reliable estimation of the lifetime of AM components from test coupons. FE simulations and fatigue tests were performed to estimate the lifetime of AM coupons under different fatigue conditions. The fatigue life is estimated based on the stress intensity factor , defined as:
(57)
(57) where
refers to the applied nominal stress,
defines a geometry dependent function, and
is the crack length. The Paris’ law was used to describe crack advancement (
) for an increment of cycles (
) as a function of the stress intensity factor (
, ‘I’ for tension opening mode).
(58)
(58)
The estimated number of cycles before failure is given by Paris’ law.
(59)
(59) where
,
and
are dependent on the geometry
.
and
define the initial and final crack lengths measured postmortem on the fractured surface. The approach provides a means to upscale fatigue results from test coupons to AM components. Although the methodology was applied to the lifetime prediction of an AM-processed wrench made from poly (lactic acid), it can be adapted for AM of metallic components. A schematic representation of the procedure is presented in .
Figure 11. (a) Fracture mechanics-based lifetime estimation of an arbitrary component based on material parameters. (b) Finite element analysis [Citation186].
![Figure 11. (a) Fracture mechanics-based lifetime estimation of an arbitrary component based on material parameters. (b) Finite element analysis [Citation186].](/cms/asset/debf4737-3ee4-4f02-bd83-b42a08eef6d7/nvpp_a_2356079_f0011_oc.jpg)
Physical models have been implemented to predict fatigue. Torries et al. [Citation187] proposed a microstructure-sensitive fatigue model for powder L-DED Ti-6Al-4 V based on pore size, second-phase particle size, grain size, porosity, and other factors. The microstructure-sensitive fatigue model was calibrated for the average size of the inclusions and fitted for as-built and heat-treated specimens. Rutherford et al. [Citation188] quantified the relationship between the microstructure and mechanical properties (tensile and strain-control fatigue) of AA6061 processed by additive friction stir-deposition. The component’s fatigue life was expressed as a sum of three parts: (1) The crack incubation stage (inc). (2) Microstructurally small crack growth (MSC) and physically small crack (PSC) growth. (3) Long crack (LC) growth.
(60)
(60)
The incubation stage () is defined by the modified Coffin-Manson expression as:
(61)
(61)
The microstructurally-physically small crack stage
(62)
(62)
The long crack (LC) growth was modelled based on linear elastic fracture mechanics. Using a physically based lifetime estimation, Blinn et al. [Citation175] investigated the effect of heat treatment on the fatigue performance of LPBF AISI 316L stainless steel. They estimated fatigue caused by surface, subsurface, and internal defects.
Creep
Models have been developed to describe the influence of heat treatment and high temperatures on the creep performance of AM components. Pröbstle et al. [Citation189] revealed that LPBF Inconel 718 shows superior creep strength in all heat treatment conditions compared to conventional cast and wrought materials. Higher volume fractions of the strengthening phases and process-induced sub-grains lead to superior creep of the LPBF material. Kim et al. [Citation190] controlled the microstructure of the LPBF Ti-Al6-4 V alloy to improve high-temperature creep properties. The interface acts as an obstacle in dislocation motion during creep, thereby increasing the creep resistance. The heat-treated specimen had better creep resistance than the as-fabricated specimens due to the development of the Widmanstätten structure. The creep time was estimated by the Garofali-Dorn model, and the Sherby-Dorn equation calculated the steady-state creep rate.
(63)
(63) where
represents the Dorn constant,
refers to the applied stress,
is the stress exponent,
describes the activation energy for creep,
is the ideal gas constant and
is the gas constant. A similar formulation was employed by Uzan et al. [Citation191] in the LPBF of AlSi10Mg. Cardon et al. [Citation192] added more parameters to the model and included temperature dependence in steady-state creep rate prediction. He et al. [Citation193] examined the creep performance of LPBF Ti6Al4 V at various temperatures and build directions. The creep property was worse at 0° compared to 45° and 90°. The LPBF samples had a longer creep rupture time than the forged samples but lower ductility. Furthermore, they modified the Wen-Tu creep model to describe the anisotropic behaviour:
(64)
(64)
(65)
(65)
(66)
(66)
(67)
(67)
where ,
,
are materials constants,
refers to the anisotropic tensor,
represents the creep time,
is the equivalent stress,
is the deviatoric stress tensor,
is the damage rate,
is the hydrostatic stress,
is the creep strain rate,
is the multiaxial failure strain, and
is the uniaxial creep ductility.
Physically-based constitutive models have been developed for creep prediction. Paoletti et al. [Citation194] described the creep of LPBF AlSi10Mg and considered the coarsening and ripening phenomena of Si-particles. The time for the minimum creep rate of the as-built specimen was estimated by
(68)
(68) The model considers Ostwald ripening phenomena that describe Si particle evolution during annealing and the accelerating effects of strain on the progressive softening of the alloy. The material model was described by these sets of equations:
(69)
(69)
(70)
(70)
(71)
(71)
(72)
(72)
Furthermore, Paoletti et al. [Citation195] applied the model to predict the effect of low-temperature annealing (225 °C/2 h) on the creep response of heat-treated LPBF AlSi10Mg and compared the mechanical response of the as-built material and heat-treated specimens. Kim et al. [Citation196] proposed another set of physically based creep prediction models to describe the compressive creep properties of an LPBF-built equiatomic CoCrFeMnNi high-entropy alloy. They employed the Sherby-Dorn equation to describe the strain rate in steady-state creep (). They estimated the activation volume by Equation (73) to have a better insight into the creep mechanism:
(73)
(73)
where represents the Taylor factor and
is the Boltzmann’s constant. They further stated that viscous glide is responsible for creep deformation in the material at low strain rates and dislocation climb at high strain rates. The viscous glide was modelled by
(74)
(74) where
refers the Poisson’s ratio,
represents the solute-solvent size difference,
is the solute concentration,
is the chemical diffusivity of the solute atoms,
is the Burgers vector and
is the shear modulus.
4. Studies on AM process chain simulation
FE simulation of AM is still maturing, and far less research has addressed the process chains involving AM and post-processing of AM components [Citation157]. Process chain simulations provide parametric-associative modelling and knowledge integration that can assist engineers in designing components and assemblies, thus supplying information flow within manufacturing process chains [Citation197]. Current research primarily focuses on low-fidelity and fast simulation approaches that ignore AM process details such as molten pull fluid flow, phase change, etc. The same mesh is usually used throughout process chain simulations to limit errors when transferring results between processes [Citation198]. Afazov et al. [Citation199] developed a Finite Element Data Exchange System (FEDES) for manufacturing process chain simulation. FEDES can map FEA data between six commercial FE packages and different mesh types generated by 2D and 3D linear or quadratic element types. Studies that include AM process chain simulations and welding include the following:
Fisk and Lundbäck [Citation127] predicted the residual stresses of Inconel (Alloy 718) after welding, followed by global and local heat treatment using physically based flow-stress data defined by the dislocation density. Deepu and Phanikumar [Citation97] performed process chain simulations to predict the temperature and microstructure evolution in gas arc metal welding of DP980 and performed post-welding tensile tests. Ahn et al. [Citation93] demonstrated that implementing phase transformation models had a marginal influence on the residual stress prediction and distortion in fibre laser welding of Ti-6Al-4 V. They performed post-welding heat treatment to reduce the tensile residual stresses observed at the HAZ.
Studies on process chain simulations of AM components include: Zhang et al. [Citation115] modelled the LPBF of Ti-6Al-4 V and performed tensile tests on the AM specimens. The yield strength of the component was modelled based on a Hall-Petch relationship that is mainly dependent on the martensitic and
phases. After the LPBF simulation, the part with its local mechanical properties was imported into a mechanical solver to conduct tensile tests. The yield and ultimate stresses were converted to true stress and strains by fitting the Ramberg-Osgood power-law equation. Koenis et al. [Citation157] developed a virtual framework to perform process chain simulations of AM components to determine the influence of all the steps in the manufacturing chain on the final product (see ). The final part dimension was obtained by EDM because EDM has a minimal effect on the surface residual stresses. The virtual framework thus provides a fast method to determine the influence of the various operations in a process chain.
Figure 12. Evolution of the process induced residual stress field for different process chains obtained by the process chain simulations. [Citation157].
![Figure 12. Evolution of the process induced residual stress field for different process chains obtained by the process chain simulations. [Citation157].](/cms/asset/e6972b36-46da-4400-8082-05bde9350870/nvpp_a_2356079_f0012_oc.jpg)
The inherent strain method that directly applies strains in the FE model was used in AM process chain simulation instead of the traditional method of predicting process temperature and using a thermal expansion model to compute thermal strains [Citation200]. O’Brien et al. [Citation201] performed complete manufacturing process chain simulations of an impeller made from Inconel 718 using the inherent strain method. The process chains involved LPBF, heat treatment (HT), shot peening (SP), or laser shock peening (LSP). The inherent strain method is used in simulating the LSP. The Johnson-Cook flow stress model was used in the LSP and SP simulations. Similarly, Yaghi et al. [Citation202] adopted the inherent strain method to simulate LPBF. Distortion and stresses in AM and post-AM machining were predicted by FE simulations and verified with experiments.
The feasibility of utilising process chain simulation in industrial settings was analysed to reduce the experimental effort in AM product design. Yaghi et al. [Citation203] assessed the maturity of modelling and simulation methods used in AM (LPBF) based on the Modelling and Simulation Readiness Level (MSRL) scale derived from the Technology Readiness Level (TRL) of NASA. Seven relevant categories and maturity factors were considered and analysed on a scale ranging from level 0 (no capability exists) to level 5 (operational), as shown in . The processes in the manufacturing process chain were: LPBF, machining, heat treatment, laser shock peening, or shot peening. The overall MSRL score of the process chain simulation was 3 (rounded from 2.7), which indicates that the maturity is between ‘applied R&D’ and ‘instrumental.’ This means that LPBF process chain modelling and simulation are not common in industry and are mostly performed by academia and research and technology organisations (RTOs). In addition, ‘LPBF process chain modelling can support low-risk development with a high reliance on simulation experts.’ Thus, FE simulations can be used for qualitative assessment of process chains, defining design structure, constraining design space, ranking alternative designs and solutions, and replacing some experimental trials.
Figure 13. MSRL of the reported LPBF process chain [Citation203]
![Figure 13. MSRL of the reported LPBF process chain [Citation203]](/cms/asset/863a137e-8c39-4088-95c8-3898b829689e/nvpp_a_2356079_f0013_oc.jpg)
Afazov et al. [Citation22] presented an overview of the modelling techniques used in PBF process chains involving AM, heat treatment, machining operations, and surface engineering. They highlighted the need to validate process chain simulations with experimental results and develop accurate models that predict the mechanical response of macro-FE simulations to reduce errors. A summary of studies with process chain simulations involving AM and welding are presented in .
Table 7. Summary of process chain simulations involving AM and welding.
5. Discussion and outlook
The macro-scale FE simulations presented in this review provide information on the global stress state, temperature distribution, component geometry, phase transformations, etc. However, including the process details is required to improve the prediction accuracy of the simulations. In this chapter, the challenges to macroscale simulations are out lined. This is followed by future development directions and an outlook on performing process chain simulation and component performance analysis.
5.1. Challenges to the implementation of macro scale process chain simulation frameworks
Numerical simulations of traditional manufacturing processes have been investigated for several decades and can be considered mature. In this section, mainly the challenges to macroscale AM simulation are discussed and how simulation results can be linked to other simulations to form process chains. The challenges are summarised as phenomenological and methological in .
Figure 14. Challenges to the implementation of macroscale AM process chain simulations
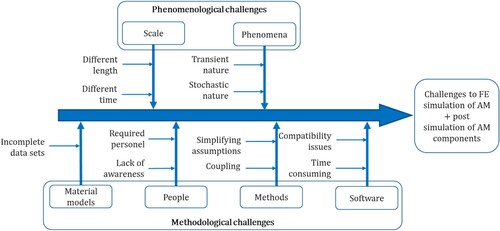
Phenomenological challenges
The phenomena in AM simulation occur at multiple scales, as highlighted in section 1.1. Some phenomena occurring at lower length and time scales cannot be replicated at the part scale, which reduces AM simulation accuracy. For example, a deeper understanding of powder properties, a description of properties at the molten state, and the interactions of the solid–liquid-gas in AM are required to improve simulation accuracy.
The fact that some events in AM are transient and occur for very short periods of time makes it challenging to replicate them in part-scale simulations.
AM processes have inherent variation, even for the same set of parameters. This stochastic nature increases the effort needed to model the processes.
Methodological challenges
Complete material properties are often rare to find in databases due to cost factors. In addition, material data in the simulations is often derived from the literature, which may be different from the investigated material. Furthermore, simulations are usually performed using the properties of the bulk material in powder-based processes, which induce errors due to variations in bulk and powder material properties.
Highly qualified personnel are required to implement process chain simulation in industry, which limits their application potential. However, the high interest and progress in AM process modelling promise better integration in future. The integration of AM in process chains can be facilitated by developing AM modules in existing CAD/CAM and FE simulation packages.
Powder-based AM processes are modelled as a continuum solid with isotropic properties. Such oversimplifications, the multi-physics nature of AM, and a limited understanding of the intricate evens in AM processes reduce accuracy. In addition, the effects of gravity on the displacement and distortion of the molten metal are often omitted.
The actual scanning or material deposition path is often replaced by complete deposition layers to reduce computational time in AM simulations, which may lead to errors in phase prediction.
Heat loss from the free surfaces to the surrounding area caused by thermal radiation and conduction at the bottom surface of the substrate is often neglected, which reduces the accuracy of simulations. In addition, macro-scale models usually ignore the details of the heat focus, mass transfer, the role of powders in deposition, porosity, material interactions, and fluid flow in the fusion zone during AM.
Finding and coupling interactions between the multi-physics problems in AM is challenging.
Software incomparability may result from using different software packages for modelling the processes in the chain. In addition, transferring simulation results to other process simulations may cause problems due to the need to perform remeshing. This can be eliminated by using the same software package or by developing platforms for the exchange of data between softwares.
5.2. Future development directions in AM process chain simulations
Linking data from micro, meso, and macroscale FE simulations in an AM ICME process chain framework remains a major challenge since many process parameters may not be within the material calibration domain and the parameters may have different time and length scales [Citation204]. In addition, a huge amount of experimental and computational effort is required to develop ICME models. Since simulating at lower scales is currently very time-consuming, it seems more feasible to perform mainly macroscale simulations. The studies with process chain simulations presented in section 4 mainly employ empirical models and omit phase transformation and microstructure. In this section, we propose some strategies to enhance the results of macroscale simulations and achieve the goal of process chain simulation.
5.2.1. Implementing physically based material models
Physically based models offer the possibility of describing process-structure–property-performance relationships for AM components at the macroscale. Such models can describe variations in the microstructural properties with changes in temperature and stress. Some researchers have addressed this by developing multiscale, physically based models for AM components and also studying the influence of post-AM processes [Citation205–208]. However, these models are often complex and have several variables. It is required to identify important parameters and reduce variables [Citation209].
5.2.2. Including mesoscale features in macroscale FE simulations
Some features that are typically observed in mesoscale simulations can be simplified and investigated with macroscale FE simulations. For example, in powder melting in LPBF, a statistical distribution of the powder is often used to describe the area of interest rather than the actual distribution of the powder in the process [Citation22]. Pores that can be observed in mesoscale simulations can be detected by X-ray computed tomography (X-ray CT) and can be included in the mesh of macroscale simulations [Citation210] [Citation211].
5.2.3. Integrating artificial intelligence and big data
Many parameters and interactions between parameters influence the properties and performance of AM components in a process chain. Artificial intelligence models can identify and predict the properties of such complex relationships. Machine learning models should be trained based on the inputs, process parameters, and outputs of FE simulations and experiments to identify the relevant features required to predict component properties and performance. Predictions from a process should be robust before being used as inputs for subsequent predictions. The data from the previous processing stage is indicated in red in . The FE simulations and experimental results can also be integrated into digital manufacturing tools and cloud platforms to create digital production chains.
Figure 15. The principal inputs and outputs from AM process chain simulations
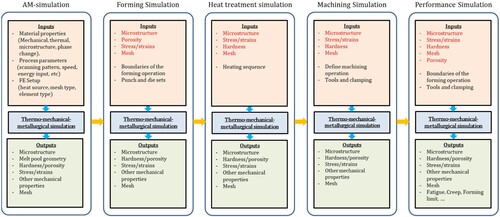
5.3. Outlook on process chain simulation and performance analysis
A framework for process chain simulation that considers the influence of AM on the component microstructure is proposed in . In the framework, FE simulations of individual processes (Pn) in the process chain are performed and calibrated to the results of experiments. FE simulations of subsequent processes use the outputs of the previous FE simulation as inputs until the final component () is obtained. A material modelling approach that meets the requirements is described in [Citation111]. The thermomechanical modelling of the flow curve is based on the phase fractions, which calculates the yield stress using the mixing rule. The special feature is that all the usual phase transformation equations and the phase decomposition kinetics arising under reheating are implemented in an extensible manner. The kinetics as well as the yield stresses themselves should be described depending on superordinate defined parameters such as dislocation densities or grain sizes. To establish the complete process chain simulation, the feedback loop should be executed and boundary conditions adapted until the FE model reasonably reproduces the final properties of the AM component obtained in experiments (microstructure, fatigue, forming limits, etc.). The outputs from AM simulation are required for associative modelling and knowledge integration in component and process design. The process chain simulation sequence permits process control, optimisation, inverse simulation of experiments and a reliable tool for predicting manufacturing quality and can serve in digital twin frameworks. An additional facet of future simulation will include the virtual comparison of various production chains via the use of multifunctional benchmark tests [Citation111, Citation212].
Figure 16. Process-chain simulation with AM indicating the material properties, process parameters and evaluation.
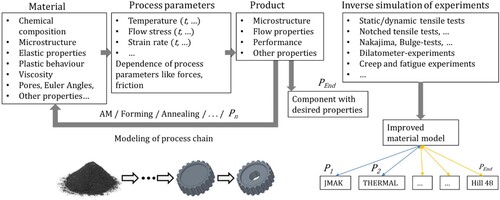
Advances in phase transformation modelling and microstructure prediction in macroscale AM simulations are promising. As such, AM simulations should be included in subsequent process simulations to achieve process chain simulation.
6. Conclusions
Process chain simulation is required to facilitate the design of AM components. However, most research studies separate AM process simulation from the simulation of post-AM components. This review aimed to present the state of the art in macro-scale AM process chain simulation and explore means for AM process chain simulation. The following conclusions were drawn from the review:
Research should be dedicated to developing physics-based and phase change models that describe the microstructure evolution of materials at different process conditions rather than using empirical models that have no physical meaning. Physics-based models permit the transfer of microstructure properties through process chain simulations. The development of physical models is also required to simulate process chains without AM.
Given the large amount of available simulation and experimental data for some materials, like Ti-6Al-4 V, Inconel 718 and their industrial relevance, AM process chain simulations should be conducted and validated to benchmark standards for process simulation of such materials.
Physically based models often contain many parameters, which, in combination with the multiple forming steps, would create a huge set of material input parameters. By employing parameter identification and reduction techniques, the number of input parameters can be reduced while maintaining an acceptable level of accuracy.
Pores and other defects observed in experiments and mesoscale simulations can be calibrated in the performance evaluation of macroscale FE simulations to reduce the experimental and numerical effort.
AM is characterised by randomness. Stochastic parameters should be included in AM modelling to describe the randomness.
Disclosure statement
No potential conflict of interest was reported by the author(s).
Data availability statement
The data that support the findings of this study are available from the corresponding author upon reasonable request.
References
- Roth CC, Tancogne-Dejean T, Mohr D. Plasticity and fracture of cast and SLM AlSi10Mg: high-throughput testing and modeling. Addit Manuf. 2021. doi:10.1016/j.addma.2021.101998
- Tofail SA, Koumoulos EP, Bandyopadhyay A, et al. Additive manufacturing: scientific and technological challenges, market uptake and opportunities. Mater Today. 2018. doi:10.1016/j.mattod.2017.07.001
- Pragana J, Sampaio R, Bragança I, et al. Hybrid metal additive manufacturing: a state–of–the-art review. Adv Ind Manuf Eng. 2021. doi:10.1016/j.aime.2021.100032
- Li X, Roth CC, Tancogne-Dejean T, et al. Rate- and temperature-dependent plasticity of additively manufactured stainless steel 316L: characterization, modeling and application to crushing of shell-lattices. Int J Impact Eng. 2020. doi:10.1016/j.ijimpeng.2020.103671
- Fan Y, Cheng P, Yao YL, et al. Effect of phase transformations on laser forming of Ti–6Al–4V alloy. J Appl Phys. 2005. doi:10.1063/1.1944202
- Zhang K, Dong W, Lu S. Transformation plasticity of AF1410 steel and its influences on the welding residual stress and distortion: experimental and numerical study. Mater Sci Eng A. 2021. doi:10.1016/j.msea.2021.141628
- Bai L, Jiang K, Gao L. The influence and mechanism of residual stress on the corrosion behavior of welded structures. Mat Res. 2018. doi:10.1590/1980-5373-mr-2018-01660
- Yadroitsev I. Selective laser melting: direct manufacturing of 3D-objects by selective laser melting of metal powders. Saarbrucken: Lambert Academic Publishing; 2009.
- Collins PC, Brice DA, Samimi P, et al. Microstructural control of additively manufactured metallic materials. Annu Rev Mater Res. 2016. doi:10.1146/annurev-matsci-070115-031816
- Bariani PF, Dal Negro T, Bruschi S. Testing and modelling of material response to deformation in bulk metal forming. CIRP Ann. 2004. doi:10.1016/S0007-8506(07)60030-4
- National Research Council (U.S.). Integrated computational materials engineering: A transformational discipline for improved competitiveness and national security. Washington: National Academies Press; 2008.
- Schmitz GJ, Prahl U. ICMEg – the integrated computational materials engineering expert group – a new European coordination action. Integr Mater Manuf Innov. 2014. doi:10.1186/2193-9772-3-2
- Bonifaz EA. In: Rodrigues JMF, Cardoso PJS, Monteiro J, Lam R, Krzhizhanovskaya VV, Lees MH, Dongarra JJ, Sloot PM (eds) Computational Science – ICCS 2019. Springer International Publishing, Cham, pp 647–659; 2019.
- Francois MM, Sun A, King WE, et al. Modeling of additive manufacturing processes for metals: challenges and opportunities. Curr Opin Solid State Mater Sci. 2017. doi:10.1016/j.cossms.2016.12.001
- Gatsos T, Elsayed KA, Zhai Y, et al. Review on computational modeling of process–microstructure–property relationships in metal additive manufacturing. JOM. 2020. doi:10.1007/s11837-019-03913-x
- Afrasiabi M, Bambach M. Modelling and simulation of metal additive manufacturing processes with particle methods: A review. Virtual Phys Prototyp. 2023. doi:10.1080/17452759.2023.2274494
- Hoyt J. Atomistic and continuum modeling of dendritic solidification. Mater Sci Eng: R: Rep. 2003. doi:10.1016/S0927-796X(03)00036-6
- Moelans N, Blanpain B, Wollants P. An introduction to phase-field modeling of microstructure evolution. Calphad. 2008. doi:10.1016/j.calphad.2007.11.003
- Kattner UR. The Calphad method and its role in material and process development. Tecnologia em metalurgia, materiais e mineracao. 2016. doi:10.4322/2176-1523.1059
- Wei HL, Mukherjee T, Zhang W, et al. Mechanistic models for additive manufacturing of metallic components. Prog Mater Sci. 2021. doi:10.1016/j.pmatsci.2020.100703
- Panwisawas C, Qiu C, Anderson MJ, et al. Mesoscale modelling of selective laser melting: thermal fluid dynamics and microstructural evolution. Comput Mater Sci. 2017. doi:10.1016/j.commatsci.2016.10.011
- Afazov S, Roberts A, Wright L, et al. Metal powder bed fusion process chains: an overview of modelling techniques. Prog Addit Manuf. 2022. doi:10.1007/s40964-021-00230-1
- Chen F, Yan W. High-fidelity modelling of thermal stress for additive manufacturing by linking thermal-fluid and mechanical models. Mater Des. 2020. doi:10.1016/j.matdes.2020.109185
- Mathews R, Nagaraja KM, Zhang R, et al. Temporally continuous thermofluidic–thermomechanical modeling framework for metal additive manufacturing. Int J Mech Sci. 2023. doi:10.1016/j.ijmecsci.2023.108424
- Afrasiabi M, Lüthi C, Bambach M, et al. Multi-Resolution SPH simulation of a laser powder Bed fusion additive manufacturing process. Appl Sci. 2021. doi:10.3390/app11072962
- Lüthi C, Afrasiabi M, Bambach M. An adaptive smoothed particle hydrodynamics (SPH) scheme for efficient melt pool simulations in additive manufacturing. Comput Math Appl. 2023. doi:10.1016/j.camwa.2023.03.003
- Cattenone A, Morganti S, Auricchio F. Basis of the Lattice Boltzmann method for additive manufacturing. Arch Computat Methods Eng. 2020. doi:10.1007/s11831-019-09347-7
- Bayat M, Dong W, Thorborg J, et al. A review of multi-scale and multi-physics simulations of metal additive manufacturing processes with focus on modeling strategies. Addit Manuf. 2021. doi:10.1016/j.addma.2021.102278
- Wang J, Wang Y, Shi J. On efficiency and effectiveness of finite volume method for thermal analysis of selective laser melting. EC. 2020. doi:10.1108/EC-03-2019-0106
- Sampaio R, Pragana J, Bragança I, et al. Modelling of wire-arc additive manufacturing – A review. Adv Ind Manuf Eng. 2023. doi:10.1016/j.aime.2023.100121
- Rosenthal D. The Theory of Moving Sources of Heat and Its Application to Metal Treatments; 1946.
- Goldak J, Chakravarti A, Bibby M. A new finite element model for welding heat sources. MTB. 1984. doi:10.1007/BF02667333
- Tan P, Shen F, Li B, et al. A thermo-metallurgical-mechanical model for selective laser melting of Ti6Al4V. Mater Des. 2019. doi:10.1016/j.matdes.2019.107642
- Behúlová M, Babalová E. Heat source models for numerical simulation of laser welding processes – a short review. J Phys: Conf Ser. 2024. doi:10.1088/1742-6596/2712/1/012018
- Kik T. Heat source models in numerical simulations of laser welding. Materials (Basel, Switzerland). 2020. doi:10.3390/ma13112653
- Chiumenti M, Cervera M, Salmi A, et al. Finite element modeling of multi-pass welding and shaped metal deposition processes. Comput Methods Appl Mech Eng. 2010. doi:10.1016/j.cma.2010.02.018
- Buhl J, Israr R, Bambach M. Modeling and convergence analysis of directed energy deposition simulations with hybrid implicit / explicit and implicit solutions. J Mach Eng. 2019. doi:10.5604/01.3001.0013.4086
- Blumm J, Henderson J. Measurement of the volumetric expansion and bulk density of metals in the solid and molten regions. High Temp-High Press. 2000. doi:10.1068/htwu520
- Zhang K, Dong W, Lu S. Residual stress and distortion in thick-plate weld joint of AF1410 steel: finite element simulations and experimental studies. Mater Res Express. 2022. doi:10.1088/2053-1591/ac4c5d
- Perić M, Tonković Z, Garašić I, et al. An engineering approach for a T-joint fillet welding simulation using simplified material properties. Ocean Eng. 2016. doi:10.1016/j.oceaneng.2016.10.006
- Park S-C, Bang H-S, Seong W-J. Effects of material properties on angular distortion in wire arc additive manufacturing: experimental and computational analyses. Materials (Basel, Switzerland). 2020. doi:10.3390/ma13061399
- Babu B, Lundbäck A, Lindgren L-E. Simulation of Ti-6Al-4V additive manufacturing using coupled physically based flow stress and metallurgical model. Materials (Basel, Switzerland). 2019. doi:10.3390/ma12233844
- Caron J, Heinze C, Schwenk C, et al. Effect of continuous cooling transformation variants on numerical calculation of welding induced residual stresses. Weld J. 2010;89(7):151–160.
- Zhu XK, Chao YJ. Effects of temperature-dependent material properties on welding simulation. Comput Struct. 2002. doi:10.1016/S0045-7949(02)00040-8
- Sun L, Ren X, He J, et al. Numerical investigation of a novel pattern for reducing residual stress in metal additive manufacturing. J Mater Sci Technol. 2021. doi:10.1016/j.jmst.2020.05.080
- Zhao H, Zhang G, Yin Z, et al. Three-dimensional finite element analysis of thermal stress in single-pass multi-layer weld-based rapid prototyping. J Mater Process Technol. 2012. doi:10.1016/j.jmatprotec.2011.09.012
- Draxler J, Edberg J, Andersson J, et al. Modeling and simulation of weld solidification cracking part III: simulation of solidification cracking in Varestraint tests of alloy 718. Weld World. 2019. doi:10.1007/s40194-019-00784-3
- Nijhuis B, Geijselaers H, van den Boogaard AH. Efficient thermal simulation of large-scale metal additive manufacturing using hot element addition. Comput Struct. 2021. doi:10.1016/j.compstruc.2020.106463
- Nycz A, Lee Y, Noakes M, et al. Effective residual stress prediction validated with neutron diffraction method for metal large-scale additive manufacturing. Mater Des. 2021. doi:10.1016/j.matdes.2021.109751
- Ding D, Zhang S, Lu Q, et al. The well-distributed volumetric heat source model for numerical simulation of wire arc additive manufacturing process. Mater Today Commun. 2021. doi:10.1016/j.mtcomm.2021.102430
- Farias RM, Teixeira P, Vilarinho LO. An efficient computational approach for heat source optimization in numerical simulations of arc welding processes. J Constr Steel Res. 2021. doi:10.1016/j.jcsr.2020.106382
- Tran H-S, Tchuindjang JT, Paydas H, et al. 3D thermal finite element analysis of laser cladding processed Ti-6Al-4V part with microstructural correlations. Mater Des. 2017. doi:10.1016/j.matdes.2017.04.092
- Outinen J, Mäkeläinen P. Mechanical properties of structural steel at elevated temperatures and after cooling down. Fire Mater. 2004. doi:10.1002/fam.849
- Maekawa A, Kawahara A, Serizawa H, et al. Fast three-dimensional multipass welding simulation using an iterative substructure method. J Mater Process Technol. 2015. doi:10.1016/j.jmatprotec.2014.08.004
- Suman S, Biswas P. Thermo-mechanical study of single and multi-pass welding of CSEF steel for residual stresses and deformations considering solid state phase transformation. Mater Today Proc. 2020. doi:10.1016/j.matpr.2019.12.299
- Zhang X, Li W, Ma J, et al. A novel temperature dependent yield strength model for metals considering precipitation strengthening and strain rate. Comput Mater Sci. 2017. doi:10.1016/j.commatsci.2016.12.005
- Ali MH, Han YS. Effect of phase transformations on scanning strategy in WAAM fabrication. Materials (Basel, Switzerland). 2021. doi:10.3390/ma14247871
- Montevecchi F, Venturini G, Grossi N, et al. Finite element mesh coarsening for effective distortion prediction in wire arc additive manufacturing. Addit Manuf. 2017. doi:10.1016/j.addma.2017.10.010
- Huang H, Ma N, Chen J, et al. Toward large-scale simulation of residual stress and distortion in wire and arc additive manufacturing. Addit Manuf. 2020. doi:10.1016/j.addma.2020.101248
- Manurung YHP, Prajadhiana KP, Adenan MS, et al. Analysis of material property models on WAAM distortion using nonlinear numerical computation and experimental verification with P-GMAW. ArchivCivMechEng. 2021. doi:10.1007/s43452-021-00189-4
- Deng D, Zhang C, Pu X, et al. Influence of material model on prediction accuracy of welding residual stress in an austenitic stainless steel multi-pass butt-welded joint. J Mater Eng Perform. 2017. doi:10.1007/s11665-017-2626-6
- Malmelöv A, Lundbäck A, Lindgren L-E. History reduction by lumping for time-efficient simulation of additive manufacturing. Metals. 2020. doi:10.3390/met10010058
- Chen W, Xu L, Han Y, et al. Control of residual stress in metal additive manufacturing by low-temperature solid-state phase transformation: An experimental and numerical study. Addit Manuf. 2021. doi:10.1016/j.addma.2021.102016
- Johnson GR, Cook WH. A constitutive model and data for materials subjected to large strains,: high strain rates, and high temperatures. Proc. 7th Inf. Sympo. Ballistics:541–547; 1983.
- Gkatzogiannis S. Strain rate dependency of simulated welding residual stresses. J Mater Eng Perform. 2018. doi:10.1007/s11665-018-3418-3
- Perzyna P. In: Advances in Applied Mechanics Volume 9. Elsevier, pp 243–377; 1966.
- Chen F, Liu J, Ou H, et al. Flow characteristics and intrinsic workability of IN718 superalloy. Mater Sci Eng A. 2015. doi:10.1016/j.msea.2015.06.093
- Antonsson T, Fredriksson H. The effect of cooling rate on the solidification of Inconel 718. Metall and Materi Trans B Volume 36B, February 2005—85; 2005.
- High-temperature high-strength nickel-base alloys: A practical guide to the use of nickel-containing alloys. Number. 393
- Benson M, Raynaud P, Wallace J. Weld Residual Stress Finite Element Analysis Validation: Part II-Proposed Validation Procedure”. US.NRC, NUREG-2228; 2020.
- MRP E. Materials reliability program: welding residual stress dissimilar metal butt-weld finite element modeling handbook (MRP-317, revision 1). Electric Power Research Institute (EPRI); 2015.
- Seshacharyulu T, Medeiros SC, Frazier WG, et al. Microstructural mechanisms during hot working of commercial grade Ti–6Al–4V with lamellar starting structure. Mater Sci Eng A. 2002. doi:10.1016/S0921-5093(01)01448-4
- Rangaswamy P, Choo H, Prime MB, et al. High Temperature Stress Assessment in SCS-6/Ti-6A1-4V Composite Using Neutron Diffraction and Finite Element Modeling; 2000.
- Venkatkumar D, Ravindran D. Effect of boundary conditions on residual stresses and distortion in 316 stainless steel butt welded plate. High Temp Mater Processes. 2019. doi:10.1515/htmp-2019-0048
- Li Y, Zhou K, Tan P, et al. Modeling temperature and residual stress fields in selective laser melting. Int J Mech Sci. 2018. doi:10.1016/j.ijmecsci.2017.12.001
- Denlinger ER. In: thermo-mechanical modeling of additive manufacturing. Elsevier; 2018. pp 183–195.
- Wu X, Zhu W, He Y. Deformation prediction and experimental study of 316L stainless steel thin-walled parts processed by additive-subtractive hybrid manufacturing. Materials (Basel, Switzerland). 2021. doi:10.3390/ma14195582
- Vishwanath MM, Lakshamanaswamy N, Ramesh GK. Numerical simulation of heat transfer behavior of dissimilar AA5052-AA6061 plates in fiction stir welding: An experimental validation. Strojnícky casopis – J Mech Eng. 2019. doi:10.2478/scjme-2019-0011
- El-Sayed MM, Shash AY, Abd-Rabou M. Finite element modeling of aluminum alloy AA5083-O friction stir welding process. J Mater Process Technol. 2018. doi:10.1016/j.jmatprotec.2017.09.008
- Sedighi M, Afshari D, Nazari F. Investigation of the effect of sheet thickness on residual stresses in resistance spot welding of aluminum sheets. Proc Inst Mech Eng, Part C: J Mech Eng Sci. 2018. doi:10.1177/0954406216685124
- DebRoy T, Wei HL, Zuback JS, et al. Additive manufacturing of metallic components – Process, structure and properties. Prog Mater Sci. 2018. doi:10.1016/j.pmatsci.2017.10.001
- Baykasoğlu C, Akyildiz O, Tunay M, et al. A process-microstructure finite element simulation framework for predicting phase transformations and microhardness for directed energy deposition of Ti6Al4V. Addit Manuf. 2020. doi:10.1016/j.addma.2020.101252
- Zhang Q, Xie J, Gao Z, et al. A metallurgical phase transformation framework applied to SLM additive manufacturing processes. Mater Des. 2019. doi:10.1016/j.matdes.2019.107618
- Zhang D, Sun S, Qiu D, et al. Metal alloys for fusion-based additive manufacturing. Adv Eng Mater. 2018. doi:10.1002/adem.201700952
- Harrison PL, Farrar RA. Application of continuous cooling transformation diagrams for welding of steels. Int Mater Rev. 1989. doi:10.1179/imr.1989.34.1.35
- Zhang K, Wang S, Liu W, et al. Characterization of stainless steel parts by laser metal deposition shaping. Mater Des. 2014. doi:10.1016/j.matdes.2013.09.006
- Pegues JW, Shao S, Shamsaei N, et al. Fatigue of additive manufactured Ti-6Al-4V, Part I: the effects of powder feedstock, manufacturing, and post-process conditions on the resulting microstructure and defects. Int J Fatigue. 2020. doi:10.1016/j.ijfatigue.2019.105358
- Lindgren L-E, Lundbäck A, Fisk M, et al. Simulation of additive manufacturing using coupled constitutive and microstructure models. Addit Manuf. 2016. doi:10.1016/j.addma.2016.05.005
- Fiocchi J, Tuissi A, Biffi CA. Heat treatment of aluminium alloys produced by laser powder bed fusion: a review. Mater Des. 2021. doi:10.1016/j.matdes.2021.109651
- Senthamarai Kannan C, Sai Sree Chandra S, Punith Krishnan G, et al. A review on additive manufacturing of AA2024 and AA6061 alloys using powder bed fusion. IOP Conf Ser: Mater Sci Eng. 2020. doi:10.1088/1757-899X/988/1/012002
- Lu X, Li MV, Yang H. Simulation of precipitates evolution driven by non-isothermal cyclic thermal history during wire and arc additive manufacturing of IN718 superalloy. J Manuf Process. 2021. doi:10.1016/j.jmapro.2021.03.032
- Gao Y, Zhang D, Cao M, et al. Effect of δ phase on high temperature mechanical performances of Inconel 718 fabricated with SLM process. Mater Sci Eng A. 2019. doi:10.1016/j.msea.2019.138327
- Ahn J, He E, Chen L, et al. Prediction and measurement of residual stresses and distortions in fibre laser welded Ti-6Al-4V considering phase transformation. Mater Des. 2017. doi:10.1016/j.matdes.2016.11.078
- Crespo A. In: Ahsan A (ed) Convection and Conduction Heat Transfer. InTech; 2011.
- Celleri HM, Portela IV, Passarella DN. Comparison of metallurgical models during quenching using open source software. Asociación Argentina de Mecánica Computacional; 2014.
- Leblond JB, Devaux J. A new kinetic model for anisothermal metallurgical transformations in steels including effect of austenite grain size. Acta Metall. 1984. doi:10.1016/0001-6160(84)90211-6
- Deepu MJ, Phanikumar G. ICME framework for simulation of microstructure and property evolution during gas metal arc welding in DP980 steel. Integrating Materials and Manufacturing Innovation. 2020. doi:10.1007/s40192-020-00182-4
- Jimenez X, Dong W, Paul S, et al. Residual stress modeling with phase transformation for wire arc additive manufacturing of B91 steel. JOM. 2020. doi:10.1007/s11837-020-04424-w
- Murgau C, Lundbäck A, Åkerfeldt P, et al. Temperature and microstructure evolution in gas tungsten arc welding wire feed additive manufacturing of Ti-6Al-4V. Materials (Basel, Switzerland). 2019. doi:10.3390/ma12213534
- Tchuindjang JT, Paydas H, Tran H-S, et al. A New concept for modeling phase transformations in Ti6Al4V alloy manufactured by directed energy deposition. Materials (Basel, Switzerland). 2021. doi:10.3390/ma14112985
- Irwin J. In: thermo-mechanical modeling of additive manufacturing. Elsevier; 2018. pp 117–135.
- Salsi E, Chiumenti M, Cervera M. Modeling of microstructure evolution of Ti6Al4V for additive manufacturing. Metals. 2018. doi:10.3390/met8080633
- Vastola G, Zhang G, Pei QX, et al. Modeling the microstructure evolution during additive manufacturing of Ti6Al4V: A comparison between electron beam melting and selective laser melting. JOM. 2016. doi:10.1007/s11837-016-1890-5
- Xie J, Oancea V, Hurtado J. Phase transformations in metals during additive manufacturing processes. NAFEMS World Congress 2017; 2017.
- Costa L, Vilar R, Reti T, et al. Rapid tooling by laser powder deposition: process simulation using finite element analysis. Acta Mater. 2005. doi:10.1016/j.actamat.2005.05.003
- Depradeux L, Robitaille C, Duval G, et al. Numerical simulation of Rapid Additive Forging (RAF) process. MATEC Web Conf. 2020. doi:10.1051/matecconf/202032103036
- Crespo A, Vilar R. Finite element analysis of the rapid manufacturing of Ti–6Al–4V parts by laser powder deposition. Scr Mater. 2010. doi:10.1016/j.scriptamat.2010.03.036
- Coret M, Combescure A. A mesomodel for the numerical simulation of the multiphasic behavior of materials under anisothermal loading (application to two low-carbon steels). Int J Mech Sci. 2002. doi:10.1016/S0020-7403(02)00053-X
- Murgau CC, Pederson R, Lindgren LE. A model for Ti–6Al–4V microstructure evolution for arbitrary temperature changes. Modelling Simul Mater Sci Eng. 2012. doi:10.1088/0965-0393/20/5/055006
- Klusemann B, Bambach M. In: Author(s), p 140012; 2018.
- Buhl J, Klöppel T, Merten M, et al. Numerical prediction of process-dependent properties of high-performance Ti6Al4 in LS-DYNA. ESAFORM 2021; 2021. doi:10.25518/esaform21.1496
- Promoppatum P, Taprachareon K, Chayasombat B, et al. Understanding size-dependent thermal,: microstructural, mechanical behaviors of additively manufactured Ti-6Al-4V from experiments and thermo-metallurgical simulation. J Manuf Process. 2022. doi:10.1016/j.jmapro.2022.01.068
- Yang X, Barrett RA, Tong M, et al. Prediction of microstructure evolution for additive manufacturing of Ti-6Al-4V. Procedia Manuf. 2020. doi:10.1016/j.promfg.2020.04.170
- Nitzler J, Meier C, Müller KW, et al. A novel physics-based and data-supported microstructure model for part-scale simulation of laser powder bed fusion of Ti-6Al-4V. Adv Model and Simul in Eng Sci. 2021. doi:10.1186/s40323-021-00201-9
- Zhang Q, Xie J, London T, et al. Estimates of the mechanical properties of laser powder bed fusion Ti-6Al-4V parts using finite element models. Mater Des. 2019. doi:10.1016/j.matdes.2019.107678
- Yang X, Barrett RA, Tong M, et al. Towards a process-structure model for Ti-6Al-4V during additive manufacturing. J Manuf Process. 2021. doi:10.1016/j.jmapro.2020.11.033
- Johnson WA, Mehl RF. Reaction kinetics in processes of nucleation and growth. American Institute of Mining and Metallurgical Engineers Technical publication No. 1089; 1939.
- Avrami M. Kinetics of phase change. I general theory. J Chem Phys. 1939. doi:10.1063/1.1750380
- Gil Mur FX, Rodríguez D, Planell JA. Influence of tempering temperature and time on the α′-Ti-6Al-4V martensite. J Alloys Compd. 1996. doi:10.1016/0925-8388(95)02057-8
- Krauss G. Steels: heat treatment and processing principles. Materials Park (Ohio): ASM International; 1990.
- Réti T, Gergely M, Tardy P. Mathematical treatment of non-isothermal transformations. Mater Sci Technol. 1987. doi:10.1179/mst.1987.3.5.365
- Costa L, Deus AM, Reti T, et al. Simulation of layer overlap tempering in steel parts produced by laser cladding. RPD 2002-Advanced Solutions and Development; 2002.
- Lindgren L-E, Lundbäck A. Additive manufacturing and high performance applications. Nanyang Technological University; 2018.
- Wen D, Gao C, Zheng Z, et al. Hot tensile behavior of a low-alloyed ultrahigh strength steel: fracture mechanism and physically-based constitutive model. J Mater Res Technol. 2021. doi:10.1016/j.jmrt.2021.05.100
- Wu H, Xu W, Wang S, et al. A cellular automaton coupled FEA model for hot deformation behavior of AZ61 magnesium alloys. J Alloys Compd. 2020. doi:10.1016/j.jallcom.2019.152562
- Babu B, Lindgren L-E. Dislocation density based model for plastic deformation and globularization of Ti-6Al-4V. Int J Plast. 2013. doi:10.1016/j.ijplas.2013.04.003
- Fisk M, Lundbäck A. Simulation and validation of repair welding and heat treatment of an alloy 718 plate. Finite Elem Anal Des. 2012. doi:10.1016/j.finel.2012.04.002
- Seeger A. The mechanism of glide and work hardening in FCC and HCP metals. In: Fisher J, Johnston WG, Thomson R, Vreeland TJ, editors. Dislocations and mechanical properties of crystals. New York, NY: Wiley; 1956. (65). p. 243–655.
- Orowan E. Problems of plastic gliding. Proc Phys Soc. 1940. doi:10.1088/0959-5309/52/1/303
- Mecking H, Kocks UF. Kinetics of flow and strain-hardening. Acta Metall. 1981. doi:10.1016/0001-6160(81)90112-7
- Holt DL. Dislocation cell formation in metals. J Appl Phys. 1970. doi:10.1063/1.1659399
- Militzer M, Sun WP, Jonas JJ. Modelling the effect of deformation-induced vacancies on segregation and precipitation. Acta Metall Mater. 1994. doi:10.1016/0956-7151(94)90056-6
- Sandström R, Lagneborg R. A model for hot working occurring by recrystallization. Acta Metall. 1975. doi:10.1016/0001-6160(75)90132-7
- Mecking H, Estrin Y. The effect of vacancy generation on plastic deformation. Scr Metall. 1980. doi:10.1016/0036-9748(80)90295-1
- Sargent GA, Zane AP, Fagin PN, et al. Low-Temperature coarsening and plastic flow behavior of an alpha/beta titanium billet material with an ultrafine microstructure. Metall Mat Trans A. 2008. doi:10.1007/s11661-008-9650-y
- Semiatin SL, Stefansson N, Doherty RD. Prediction of the kinetics of static globularization of Ti-6Al-4V. Metall Mat Trans A. 2005. doi:10.1007/s11661-005-0229-6
- Thomas J, Semiatin S. Mesoscale Modeling of the Recrystallization of Waspaloy and application to the simulation of the ingot-cogging process; 2006.
- Nembach E, Neite G. Precipitation hardening of superalloys by ordered γ′-particles. Prog Mater Sci. 1985. doi:10.1016/0079-6425(85)90001-5
- Mirkoohi E, Mahdavi M, Li D, et al. Microstructure affected residual stress prediction based on mechanical threshold stress in direct metal deposition of Ti-6Al-4V. Int J Adv Manuf Technol. 2021. doi:10.1007/s00170-020-06526-w
- Lundbäck A, Lindgren L-E. Modelling of metal deposition. Finite Elem Anal Des. 2011. doi:10.1016/j.finel.2011.05.005
- Eskandari Sabzi H, Rivera-Díaz-del-Castillo PE. Composition and process parameter dependence of yield strength in laser powder bed fusion alloys. Mater Des. 2020. doi:10.1016/j.matdes.2020.109024
- Babu B, Lundäck A. Physically based constitutive model for Ti-6Al-4V used in the simulation of manufacturing chain. X International Conference on Computational Plasticity COMPLAS X; 2009.
- Kale AB, Alluri P, Singh AK, et al. The deformation and fracture behavior of 316L SS fabricated by SLM under mini V-bending test. Int J Mech Sci. 2021. doi:10.1016/j.ijmecsci.2021.106292
- Tao P, Zhong J, Li H, et al. Microstructure, mechanical properties, and constitutive models for Ti–6Al–4V alloy fabricated by selective laser melting (SLM). Metals. 2019. doi:10.3390/met9040447
- Motoyama Y, Tokunaga H, Kajino S, et al. Stress–strain behavior of a selective laser melted Ti-6Al-4V at strain rates of 0.001–1/s and temperatures 20–1000 °C. J Mater Process Technol. 2021. doi:10.1016/j.jmatprotec.2021.117141
- Saboori A, Abdi A, Fatemi SA, et al. Hot deformation behavior and flow stress modeling of Ti–6Al–4V alloy produced via electron beam melting additive manufacturing technology in single β-phase field. Mater Sci Eng A. 2020. doi:10.1016/j.msea.2020.139822
- Niu Y, Sun Z, Wang Y, et al. Phenomenological constitutive models for Hot deformation behavior of Ti6Al4V alloy manufactured by directed energy deposition laser. Metals. 2020. doi:10.3390/met10111496
- Motallebi R, Savaedi Z, Mirzadeh H. Additive manufacturing – A review of hot deformation behavior and constitutive modeling of flow stress. Curr Opin Solid State Mater Sci. 2022. doi:10.1016/j.cossms.2022.100992
- Bambach M, Sizova I. In: Author(s), p 170001; 2018.
- Bambach M, Sizova I, Szyndler J, et al. On the hot deformation behavior of Ti-6Al-4V made by additive manufacturing. J Mater Process Technol. 2021. doi:10.1016/j.jmatprotec.2020.116840
- Gao P, Yang H, Fan X, et al. Unified modeling of flow softening and globularization for hot working of two-phase titanium alloy with a lamellar colony microstructure. J Alloys Compd. 2014. doi:10.1016/j.jallcom.2014.02.110
- Galindo-Fernández MA, Mumtaz K, Rivera-Díaz-del-Castillo P, et al. A microstructure sensitive model for deformation of Ti-6Al-4V describing cast-and-wrought and additive manufacturing morphologies. Mater Des. 2018. doi:10.1016/j.matdes.2018.09.028
- Hayes BJ, Martin BW, Welk B, et al. Predicting tensile properties of Ti-6Al-4V produced via directed energy deposition. Acta Mater. 2017. doi:10.1016/j.actamat.2017.05.025
- Yang X, Barrett RA, Harrison NM, et al. A physically-based structure-property model for additively manufactured Ti-6Al-4V. Mater Des. 2021. doi:10.1016/j.matdes.2021.109709
- Obiukwu O, Nwafor M, Okafor B, et al. The effect of surface finish on the low cycle fatigue of low and medium carbon steel. International Conference on Mechanical and Industrial Engineering (ICMIE'15) (Harare(Zimbabwe), (2015); 2015.
- Salonitis K, D'Alvise L, Schoinochoritiris B, et al. Additive manufacturing and post-processing simulation: laser cladding followed by high speed machining. Int J Adv ManufTechnol. 2016;85:2401–2411.
- Koenis T, van den Brink W, Bosman M. Full process chain simulation of the (wire-based) laser metal deposition process towards fatigue life prediction. Procedia Structural Integrity. 2021. doi:10.1016/j.prostr.2021.12.034
- Afazov S, Ceesay L, Larkin O, et al. A methodology for precision manufacture of a nozzle using hybrid laser powder-bed fusion: A case study. Proc Inst Mech Eng, Part B: J Eng Manuf. 2021. doi:10.1177/0954405420958856
- He Y, Wei J, Peng Y, et al. Deformation prediction and experimental investigation on alternating additive-subtractive hybrid manufacturing of 316L stainless steel thin-walled parts. Int J Adv Manuf Technol. 2023. doi:10.1007/s00170-023-12592-7
- Luo Y, Zheng K, Zhao P, et al. Machining characteristics of 316L stainless steel in hybrid manufacturing via a three-dimensional thermal-mechanical coupled model. J Manuf Process. 2023. doi:10.1016/j.jmapro.2023.06.021
- Novotný L, Béreš M, Abreu Hd, et al. Thermal analysis and phase transformation behaviour during additive manufacturing of Ti–6Al–4V alloy. Mater Sci Technol. 2019. doi:10.1080/02670836.2019.1593669
- Spierings AB, Starr TL, Wegener K. Fatigue performance of additive manufactured metallic parts. Rapid Prototyp J. 2013. doi:10.1108/13552541311302932
- Bronkhorst CA, Mayeur JR, Livescu V, et al. Structural representation of additively manufactured 316L austenitic stainless steel. Int J Plast. 2019. doi:10.1016/j.ijplas.2019.01.012
- Riemer A, Leuders S, Thöne M, et al. On the fatigue crack growth behavior in 316L stainless steel manufactured by selective laser melting. Eng Fract Mech. 2014. doi:10.1016/j.engfracmech.2014.03.008
- Palanivel S, Dutt AK, Faierson EJ, et al. Spatially dependent properties in a laser additive manufactured Ti–6Al–4V component. Mater Sci Eng A. 2016. doi:10.1016/j.msea.2015.12.021
- Nalli F, Cortese L, Concli F. Ductile damage assessment of Ti6Al4V, 17-4PH and AlSi10Mg for additive manufacturing. Eng Fract Mech. 2021. doi:10.1016/j.engfracmech.2020.107395
- Tancogne-Dejean T, Roth CC, Mohr D. Rate-dependent strength and ductility of binder jetting 3D-printed stainless steel 316L: experiments and modeling. Int J Mech Sci. 2021. doi:10.1016/j.ijmecsci.2021.106647
- Wilson-Heid AE, Qin S, Beese AM. Anisotropic multiaxial plasticity model for laser powder bed fusion additively manufactured Ti-6Al-4V. Mater Sci Eng A. 2018. doi:10.1016/j.msea.2018.09.077
- Wilson-Heid AE, Qin S, Beese AM. Multiaxial plasticity and fracture behavior of stainless steel 316L by laser powder bed fusion: experiments and computational modeling. Acta Mater. 2020. doi:10.1016/j.actamat.2020.08.066
- Wilson-Heid AE, Beese AM. Fracture of laser powder bed fusion additively manufactured Ti–6Al–4V under multiaxial loading: calibration and comparison of fracture models. Mater Sci Eng A. 2019. doi:10.1016/j.msea.2019.05.097
- Yang X, Li Y, Duan M, et al. An investigation of ductile fracture behavior of Ti6Al4V alloy fabricated by selective laser melting. J Alloys Compd. 2022. doi:10.1016/j.jallcom.2021.161926
- Qin S, Novak TC, Vailhe MK, et al. Plasticity and fracture behavior of Inconel 625 manufactured by laser powder bed fusion: comparison between as-built and stress relieved conditions. Mater Sci Eng A. 2021. doi:10.1016/j.msea.2021.140808
- Paul SK, Tarlochan F, Hilditch T. Fatigue life prediction of the additively manufactured specimen. Model Simul Mater Sci Eng. 2022. doi:10.1088/1361-651X/ac11b9
- Yadollahi A, Shamsaei N. Additive manufacturing of fatigue resistant materials: challenges and opportunities. Int J Fatigue. 2017. doi:10.1016/j.ijfatigue.2017.01.001
- Blinn B, Krebs F, Ley M, et al. Determination of the influence of a stress-relief heat treatment and additively manufactured surface on the fatigue behavior of selectively laser melted AISI 316L by using efficient short-time procedures. Int J Fatigue. 2020. doi:10.1016/j.ijfatigue.2019.105301
- Fotovvati B, Namdari N, Dehghanghadikolaei A. Fatigue performance of selective laser melted Ti6Al4 V components: state of the art. Mater Res Express. 2019. doi:10.1088/2053-1591/aae10e
- Molaei R, Fatemi A, Sanaei N, et al. Fatigue of additive manufactured Ti-6Al-4V,: part II: The relationship between microstructure, material cyclic properties, and component performance. Int J Fatigue. 2020. doi:10.1016/j.ijfatigue.2019.105363
- Torries B, Imandoust A, Beretta S, et al. Overview on microstructure- and defect-sensitive fatigue modeling of additively manufactured materials. JOM. 2018. doi:10.1007/s11837-018-2987-9
- Lindström T, Nilsson D, Simonsson K, et al. Constitutive model for thermomechanical fatigue conditions of an additively manufactured combustor alloy. Mech Mater. 2022. doi:10.1016/j.mechmat.2022.104273
- Mooney B, Agius D, Kourousis KI. Cyclic plasticity of the As-built EOS maraging steel: preliminary experimental and computational results. Applied Sciences. 2020. doi:10.3390/app10041232
- Kourousis IK, Agius D, Wang C, et al. Constitutive modeling of additive manufactured Ti-6Al-4V cyclic elastoplastic behaviour. Technische Mechanik. 2016;36(1–2):57–72.
- Lindström T, Ewest D, Simonsson K, et al. Constitutive model of an additively manufactured ductile nickel-based superalloy undergoing cyclic plasticity. Int J Plast. 2020. doi:10.1016/j.ijplas.2020.102752
- Zhang J, Wang X, Paddea S, et al. Fatigue crack propagation behaviour in wire+arc additive manufactured Ti-6Al-4V: effects of microstructure and residual stress. Mater Des. 2016. doi:10.1016/j.matdes.2015.10.141
- Huynh L, Rotella J, Sangid MD. Fatigue behavior of IN718 microtrusses produced via additive manufacturing. Mater Des. 2016. doi:10.1016/j.matdes.2016.05.032
- Li P, Warner DH, Phan N. Predicting the fatigue performance of an additively manufactured Ti-6Al-4V component from witness coupon behavior. Addit Manufa. 2020. doi:10.1016/j.addma.2020.101230
- Arbeiter F, Trávníček L, Petersmann S, et al. Damage tolerance-based methodology for fatigue lifetime estimation of a structural component produced by material extrusion-based additive manufacturing. Addit Manuf. 2020. doi:10.1016/j.addma.2020.101730
- Torries B, Sterling AJ, Shamsaei N, et al. Utilization of a microstructure sensitive fatigue model for additively manufactured Ti-6Al-4V. RPJ. 2016. doi:10.1108/RPJ-11-2015-0168
- Rutherford BA, Avery DZ, Phillips BJ, et al. Effect of thermomechanical processing on fatigue behavior in solid-state additive manufacturing of Al-Mg-Si alloy. Metals. 2020. doi:10.3390/met10070947
- Pröbstle M, Neumeier S, Hopfenmüller J, et al. Superior creep strength of a nickel-based superalloy produced by selective laser melting. Mater Sci Eng A. 2016. doi:10.1016/j.msea.2016.07.061
- Kim Y-K, Park S-H, Yu J-H, et al. Improvement in the high-temperature creep properties via heat treatment of Ti-6Al-4V alloy manufactured by selective laser melting. Mater Sci Eng A. 2018. doi:10.1016/j.msea.2017.12.085
- Uzan NE, Shneck R, Yeheskel O, et al. High-temperature mechanical properties of AlSi10Mg specimens fabricated by additive manufacturing using selective laser melting technologies (AM-SLM). Additive Manufacturing. 2018. doi:10.1016/j.addma.2018.09.033
- Cardon A, Mareau C, Ayed Y, et al. In: PROCEEDINGS OF THE 22ND INTERNATIONAL ESAFORM CONFERENCE ON MATERIAL FORMING: ESAFORM 2019. AIP Publishing, p 150018; 2019.
- He Y, Ma Y, Zhang W, et al. Effects of build direction on thermal exposure and creep performance of SLM Ti6Al4V titanium alloy. Eng Fail Anal. 2022. doi:10.1016/j.engfailanal.2022.106063
- Paoletti C, Santecchia E, Cabibbo M, et al. Modelling the creep behavior of an AlSi10Mg alloy produced by additive manufacturing. Mater Sci Eng A. 2021. doi:10.1016/j.msea.2020.140138
- Paoletti C, Cerri E, Ghio E, et al. Effect of low-temperature annealing on creep properties of AlSi10Mg alloy produced by additive manufacturing: experiments and modeling. Metals. 2021. doi:10.3390/met11020179
- Kim Y-K, Yang S, Lee K-A. Compressive creep behavior of selective laser melted CoCrFeMnNi high-entropy alloy strengthened by in-situ formation of nano-oxides. Addit Manuf. 2020. doi:10.1016/j.addma.2020.101543
- Mbang S, Haasis S. Automation of the computer-aided design–computer-aided quality assurance process chain in car body engineering. Int J Prod Res. 2004. doi:10.1080/00207540410001717119
- Afazov SM. Modelling and simulation of manufacturing process chains. CIRP J Manuf Sci Technol. 2013. doi:10.1016/j.cirpj.2012.10.005
- Afazov SM, Becker AA, Hyde TH. Development of a finite element data exchange system for chain simulation of manufacturing processes. Adv Eng Softw. 2012. doi:10.1016/j.advengsoft.2011.12.011
- Wang J, Rashed S, Murakawa H. Mechanism investigation of welding induced buckling using inherent deformation method. Thin-Walled Struct. 2014. doi:10.1016/j.tws.2014.03.003
- O’Brien JM, Montgomery S, Yaghi A, et al. Process chain simulation of laser powder bed fusion including heat treatment and surface hardening. CIRP J Manuf Sci Technol. 2021. doi:10.1016/j.cirpj.2021.01.006
- Yaghi A, Ayvar-Soberanis S, Moturu S, et al. Design against distortion for additive manufacturing. Addit Manuf. 2019. doi:10.1016/j.addma.2019.03.010
- Yaghi A, Afazov S, Villa M. Maturity assessment of laser powder bed fusion process chain modelling and simulation. Digital Manuf Technology. 2021. doi:10.37256/dmt.112021822
- Bleck W, Brecher C, Herty M, et al. In: Brecher C, Özdemir D (eds) Integrative Production Technology. Springer International Publishing. Cham. 2017: 253–364.
- Zhang XX, Lutz A, Andrä H, et al. An additively manufactured and direct-aged AlSi3.5Mg2.5 alloy with superior strength and ductility: micromechanical mechanisms. Int J Plast. 2021. doi:10.1016/j.ijplas.2021.103083
- Zhang XX, Bauer P-P, Lutz A, et al. Microplasticity and macroplasticity behavior of additively manufactured Al-Mg-Sc-Zr alloys: In-situ experiment and modeling. Int J Plast. 2023. doi:10.1016/j.ijplas.2023.103659
- Zhang XX, Andrä H. Crystal plasticity simulation of the macroscale and microscale stress–strain relations of additively manufactured AlSi10Mg alloy. Comput Mater Sci. 2021. doi:10.1016/j.commatsci.2021.110832
- Zhang XX, Knoop D, Andrä H, et al. Multiscale constitutive modeling of additively manufactured Al–Si–Mg alloys based on measured phase stresses and dislocation density. Int J Plast. 2021. doi:10.1016/j.ijplas.2021.102972
- Bambach M, Heppner S, Steinmetz D, et al. Assessing and ensuring parameter identifiability for a physically-based strain hardening model for twinning-induced plasticity. Mech Mater. 2015. doi:10.1016/j.mechmat.2015.01.019
- Siddique S, Imran M, Rauer M, et al. Computed tomography for characterization of fatigue performance of selective laser melted parts. Mater Des. 2015. doi:10.1016/j.matdes.2015.06.063
- Biswal R, Zhang X, Shamir M, et al. Interrupted fatigue testing with periodic tomography to monitor porosity defects in wire + arc additive manufactured Ti-6Al-4V. Additive Manufacturing. 2019. doi:10.1016/j.addma.2019.04.026
- Grüger L, Sydow B, Woll R, et al. Design of a cost-effective and statistically validated test specification with selected machine elements to evaluate the influence of the manufacturing process with a focus on additive manufacturing. Metals. 2023. doi:10.3390/met13111900