
 ?Mathematical formulae have been encoded as MathML and are displayed in this HTML version using MathJax in order to improve their display. Uncheck the box to turn MathJax off. This feature requires Javascript. Click on a formula to zoom.
ABSTRACT
In contrast to traditional intermetallics that are difficult to process and prone to cracking during additive manufacturing, our work demonstrates the successful fabrication of crack-free, high-performance CCIMAs via electron beam powder bed fusion (EBPBF). The microstructures of CCIMAs (NiCoFeAlTiB) fabricated by EBPBF are remarkably complex, exhibiting a multiphase composition where the disordered FCC phase forms the matrix interleaved with L12-ordered intermetallic phase. The unique combination of ordered lattices and high-entropy disordered phases, tuned by optimised EBPBF processing, imparts exceptional mechanical properties with a high tensile strength (∼1 GPa) and a sufficient ductility (∼11%). It is found that additional minor HCP and L21 precipitates can also effectively slow down and block the crack extension. This work demonstrates a pathway for crack-free fabrication of CCIMAs with tailored microstructures using EBPBF which may provide new insights and manufacturing strategies to unlock the potential of these advanced intermetallic alloys.
1. Introduction
Intermetallic alloys exhibit desirable properties including high strength, thermal resistance, corrosion resistance and catalytic activity [Citation1–3], rendering them promising candidates for diverse engineering applications from aerospace to automotive [Citation4–6], motivating significant research interests. Conventional binary intermetallic alloys are mainly limited to chemically simple systems, such as TiAl, NiTi and FeAl-based alloys [Citation7–9], which have only one primary element in each particular sublattice, constraining opportunities for performance optimisation and preventing utility in specialised applications. Recently, a new design concept namely chemically complex intermetallic alloys (CCIMAs) has attracted considerable interest, offering a novel paradigm to overcome this dilemma [Citation10]. Compared to conventional binary intermetallic alloys, CCIMAs are chemically complex, multi-element and multi-component systems, in which each sublattice can be occupied by more than one element and form complex sublattices with specific atomic configurations. This newly emerged CCIMAs have wide space for modulations of compositional, structural and mechanical properties. For example, Zhou et al. prepared a single-phase high-entropy intermetallic compound (FeCoNiMnCu)Al with a B2-type ordered structure by a spark plasma sintering and heating treatment [Citation11]. Feng et al. obtained a high-entropy alloy with a composition of Ni32.3Fe12.1Cr8.8Co16.9Al29.9 (at. %) by induction melting and hot rolling [Citation12]. A multicomponent B2 type intermetallic phase with high elasticity and plastic deformation was found in this alloy. More recently, Yang et al. prepared two CCIMAs, (FeCoNi)86Al7Ti7 (at. %) and Ni43.9Co22.4Fe8.8Al10.7Ti11.7B2.5 (at. %), by arc-melting and cold rolling [Citation13,Citation14]. These two alloys have unique ordered L12 intermetallic nanoparticles and disordered FCC phases with distinctive crystal structures. In brief, CCIMAs exhibit superior mechanical properties, high-temperature performance and more interesting internal microstructures than conventional binary intermetallic alloys [Citation10,Citation14].
Many excellent alloys are often limited by complex or monolithic preparation methods and do not have good prospects for utilisation. Therefore, more attempts should be made to prepare CCIMAs rather than limiting them to conventional casting methods such as arc melting and induction melting. Conventional casting methods have difficulty in overcoming the inherent complexity and meeting the high level of control required to produce homogeneous bulk alloys. In addition, certain post-treatments, such as heat treatments, solution treatments, aging treatments and cold deformation, are required to achieve unique structures. It is obvious that conventional machining techniques are similarly incapable of providing an effective way to achieve the unique crystal structures found in CCIMAs.
In recent years, additive manufacturing (AM) has demonstrated some unique building characteristics, such as high cooling rates, digitised models and the capability to produce complex parts [Citation15–18]. Among them, laser powder bed fusion (LPBF) technology is widely used, with high building accuracy and a wide selection of materials [Citation19]. While electron beam powder bed fusion (EBPBF) technology is more applicable to metallic materials because of its unique advantages over LPBF for building high-temperature metallic materials [Citation15]. For example, the preheating procedure reduces the residual stress and deformation of the material, and the high-energy electron beam facilitates the melting of insoluble metals [Citation20–22]. In numerous efforts of EBPBF additive manufacturing, the composition is mostly concentrated on binary or chemically simple intermetallic compounds [Citation23–26]. Complex types of intermetallic alloys have also been investigated but not more willingly attempted [Citation27,Citation28]. This is because differences of the melting points and coefficients of thermal expansion as well as interactions of different elements can lead to build failures. Furthermore, the exploration of process parameters for AM is also a complex process, and inappropriate parameters can easily lead to blowing powder, or defects such as cracks and pores in the build samples [Citation23,Citation29,Citation30]. Therefore, it is our goal to prepare an intermetallic alloy with no defects and excellent properties using AM.
The present work aims to prepare a crack-free CCIMA with low porosity and excellent properties by optimising the EBPBF process parameters. This study provides a feasible and effective approach for the fabrication of complex intermetallic compounds, which are known for their unique combination of high strength, low density and excellent high-temperature properties. Compared to conventional binary intermetallic alloys, the CCIMA samples fabricated by EBPBF exhibit superior strength and tensile ductility, attributed to the fine-grained microstructure and the formation of a high-entropy phase. Furthermore, this work contributes to the preparation of CCIMAs in the field of AM, offering valuable insights into the processing-microstructure-property relationships of these complex intermetallic materials.
2. Materials and methods
2.1. Materials and the EBPBF process
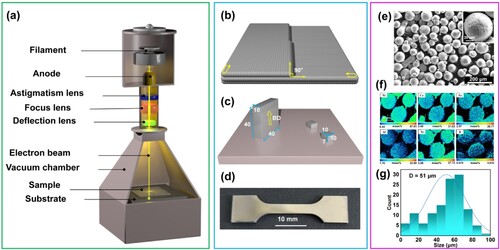
The composition of the gas atomisation powder purchased commercially was Ni43.9Co22.4Fe8.8Al10.7Ti11.7B2.5 (at. %). This composition was derived from the intermetallic alloying elemental ration composition explored by Yang et al [Citation14]. Building was performed using a Qbeam lab 200 type electron beam additive manufacturing equipment (schematic in a). Initially for building, the substrate temperature was preheated to 850-900°C. The build chamber was in a He atmosphere with a vacuum of less than 5 × 10⁻³ Pa. The thickness of each layer of the powder bed was 50 μm. After a new layer of powder was laid down, the powder would be preheated, and then the scanning direction of the electron beam would be rotated by 90° (as in b). Finally, samples with dimensions of 10 × 10 × 7 mm3 and 10 × 40 × 40 mm3 were obtained (as in c), and the pictures of the as-built samples are placed in Supplementary Material Figure S1. The small block samples were used for the exploration of building parameters, and the large block samples were used for characterisation of microstructure and mechanical properties. Dog-bone shaped tensile specimens with a gauge dimension of 12.5 mm (length) × 3.2 mm (width) × 1.3 mm (thickness) were obtained by electric discharge wire cutting and polishing, as shown in d.
Figure 1. EBPBF and gas atomisation powder. (a) Schematic diagram of the EBPBF process. (b) Scanning direction and strategy of the electron beam. (c) Schematic diagrams and dimensions of two samples. (d) Physical drawings of tensile sample cut out from large sample. (e) Scanning electron microscopy (SEM) morphology of gas atomisation powder Ni43.9Co22.4Fe8.8Al10.7Ti11.7B2.5 (at. %). (f) Element distribution mapping of the powder. (g) Particle size distribution of the powder.
To better evaluate the interaction between EBPBF process parameters, the magnitude of the input energy is measured in terms of volumetric energy density (VED), which can be calculated by:
(1)
(1) where VED is the energy density per unit volume (J/mm3), U is the electron beam voltage (kV), I is the electron beam current (mA), v is the electron beam scanning speed (mm/s), h is the electron beam scanning spacing (mm) and t is the thickness of the sliced layer (μm).
In our study, the electron beam voltage of the EBPBF equipment is 60 kV, and the layer thickness and the electron beam scanning spacing are empirically set to 50 μm and 0.1 mm, respectively. A reasonable scanning speed and current are conducive to increasing the depth of the melt pool and fully melting the CCIMAs powder. The specific process parameters with current as the variable are shown in Table S1 (A1–A4), and the process parameters with scanning speed as the variable are shown in Table S1 (A5–A9).
2.2. Microstructural characterisation
The phase constituents and crystal structures of the powder and EBPBFed alloy were determined by X-ray diffraction (XRD) using a Rigaku D\max-2550 diffractometer with Cu-Kα radiation operated at 40 kV. The chemical composition and microstructure of powder and EBPBF samples were analysed using an electron probe microanalyser (EPMA-8050G, Shimadzu, Japan). Optical microscope measurements were performed using a Zeiss SteREO Discovery V20. The microstructural evolution was characterised by SEM using a Gemini SEM 300 equipped with electron backscatter diffraction (EBSD) from Oxford Instruments (NordlysNano). EBSD mapping was performed at step size of 1 μm to quantify the grain sizes, shapes and orientations, and the data were analysed using AztecCrystal software. Transmission electron microscopy (TEM) analysis was carried out using JEM-2100 and JEM-2010 microscope operated at 200 kV. JEM-2100 was equipped with an X-Max 80 TLE EDS unit (Oxford Instruments, UK) for composition analysis. Preparation of the TEM specimens consisted of manually grinding the as-built samples to about 80 μm and stamping them into discs with a diameter of 3 mm, and further mechanical grinding of the discs to a thickness close to 30 μm, and subsequent thinning by ionic thinning and automated dual-jet electrolytic polishing in a mixture of 90% ethanol and 10% perchloric acid. A 30% dilution of aqua regia was used as the corrosion reagent to corrode the EBPBF samples that had completed the polishing treatment, and the corrosion times were 5, 15 and 30 s respectively. When the surface of the block specimen was slightly darkened, it was immediately washed with water, followed by anhydrous ethanol. The different corrosion times are to facilitate the observation of the different precipitated phases, as the corrosion resistance of each precipitated phase is different.
2.3. Mechanical testing and post-test characterisations
Prior to testing, each sample underwent mechanical polishing to eliminate oxides and surface unevenness, maintaining consistent dimensions. Uniaxial tensile tests under quasi-static conditions were conducted on an MTS CMT 5205 at ambient temperature with a strain rate of 1.0 × 10⁻³ s−1. To ensure the repeatability, a minimum of three specimens per state were subjected to tension. Post-testing, fractographic images were analysed using SEM and EBSD. The deformed microstructural changes near the fracture surface were further examined by TEM.
3. Results and discussion
3.1. Powder characterisation
The microstructure and particle size distribution of aerosolised metal Ni43.9Co22.4Fe8.8Al10.7Ti11.7B2.5 (at. %) powder are shown in e–g. It can be seen that the powders have smooth surfaces, high sphericity and few satellite particles. The powder is in spherical shape with some powder of small size adsorbed on the surface, which is formed during the aerosolisation process. The presence of satellite powder reduces the fluidity of the powder, which has some adverse effects on the AM process [Citation31]. The powder particle size is counted using ImageJ software, and the average particle size is about 51 μm (g), meeting the required range of optimal powder particle size (40–150 μm) for the EBPBF equipment. The chemical composition of the powder is examined using quantitative analysis of EPMA and the results are shown in . The element distribution of the powder detected by EPMA are presented in f, showing that all elements in the original powder are uniformly distributed.
Table 1. The chemical composition of the Ni43.9Co22.4Fe8.8Al10.7Ti11.7B2.5 powder.
3.2. Microstructural features and elemental distributions
The optical microscope (OM) images of the interior of the EBPBF formed samples are shown in a–e, which shows the crack-free microstructure. The porosity of the samples is counted using the software ImageJ. Then based on the porosity statistics in f, it can be basically identified that sample A3 (scanning speed: 350 mm/s, and electron beam current: 4.0 mA) and A7 (scanning speed: 400 mm/s, and electron beam current: 3.5 mA) have the best building quality. Accordingly, the relationship between electron beams current (scanning speed) and porosity is displayed in Figure S2. The optimal scanning speed and the range of electron beam current can be derived from these two charts, respectively. Thus, the specific optimum parameters for building are shown in .
Figure 2. OM results of EBPBF samples. (a) OM images of A3 sample showing the crack-free microscopic surface. (b) Schematic OM images of samples A3 and A7. (c) OM images of A7 sample. (d, e) The enlarged images show obvious precipitated phases. (f) Porosity statistical chart of A1-A9 samples.
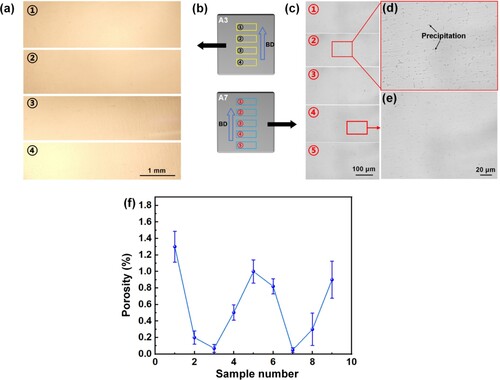
Table 2. Optimal EBPBF parameters for CCIMAs.
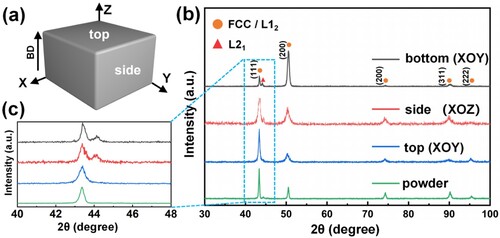
a schematically illustrates the contour of the as-built sample, with the top, bottom and side surfaces selected for XRD analysis to investigate the printing texture and phase composition. b presents the XRD patterns of the powder and bulk samples. The most prominent peaks correspond to the FCC phase, consistent with the L12 peaks (Co3Ti, Ni3Al). A peak of low intensity was also observed at 44.1°, which is attributed to the L21 phase [Citation32], while this peak was not detected in the powders and the top surface of the bulk sample. In the magnified view of c, the intensity of the L21 peak at the bottom of the sample is significantly higher than that at the top. This can be attributed to the heat conduction during the printing process, where the bottom experiences a prolonged exposure to high temperatures, favoring the formation of the L21 phase. Furthermore, the bottom surface exhibits a pronounced (110) orientation, while the top surface shows a (111) orientation. In contrast, the XRD pattern of the side surface reveals a more uniform orientation relationship.
Figure 3. XRD results of EBPBF samples. (a) Relative coordinates and build direction of the sample. (b) XRD pattern of the as-received powders and the EBPBF samples. (c) XRD pattern of the 40-48° interval in (b).
To further investigate the grain morphology and grain size distribution as well as the orientation relationship of the phases, the EBSD on section along the building direction (BD) was performed, as shown in . For ease of observation, we have made the IPF image to show only high-angle grain boundaries (HAGBs) (φ > 10°), and low-angle grain boundaries (LAGBs) will be discussed and analysed subsequently. The grains closer to the bottom substrate exhibit larger sizes, with some grain sizes reaching up to 200 μm, which coincides with the maximum heat flux direction. Due to already solidified grains can provide preferential nucleation sites for the subsequent solidified liquid metal, relatively fine grains can be observed with layers building [Citation33]. Furthermore, we observed the presence of some fine grains near the bottom within a distance of 1 mm, as indicated by red circles in Supplementary Figure S3a,b. The grain sizes in the upper portion of the fine-grained region (as shown in Figure S3b) are nearly identical to those in the top region. During the characterisation process, it was also found that the grains do not differ much from those at the top. In fact, the intermediate region of the sample consists of columnar grains, which are further illustrated in . The appearance of fine grains near the bottom is due to the fact that the printing process enters a set steady state programme at that location, where a series of parameters will change. Specifically, there is a significant temperature increase after a gradual temperature decrease, recrystallisation is likely to occur in this region, resulting in finer grains. The occurrence of equiaxed fine grains during AM has been reported in other reference [Citation34]. And we calculated the equivalent circle diameter of the average grain size as D = 34.9 μm (b). c,d show the crystal inverse pole figure (IPF) at the bottom and top of the examined samples, respectively, sharing the same characteristics as demonstrated in a. The red island-shaped region in e is the previously mentioned L21 phase, and the green regions are the FCC and L12 phases. From the colour distinction, it can be seen that the L21 phase and the FCC/L12 phase have significantly different grain orientations. e shows that the bottom of the sample has a significantly higher percentage of the L21 phase than the HCP phase. In contrast, f indicates the opposite result for the two phases at the top. Again, the building process makes the bottom region of the sample equivalent to a long-time heat treatment, which provides sufficient conditions for grain growth and elemental segregation [Citation35].
Figure 4. EBSD characterisation of EBPBF samples. (a) EBSD pattern of grain distribution at the bottom of the sample along the BD. (b) Grain size distribution. (c) IPF map of the sample at the bottom. (d) IPF map of the sample at the top. (e) Phase distribution map at the bottom of the sample. (f) Phase distribution map at the top of the sample.
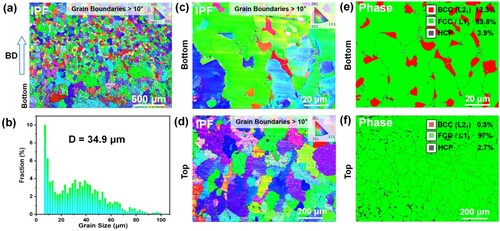
Figure 5. EBSD results for EBPDF samples of parallel BD. (a) IPF at about 2 mm from the bottom. (b) IPF at about 20 mm from the bottom. (c, d) Pole figures corresponding to the images of (a) and (b), respectively.
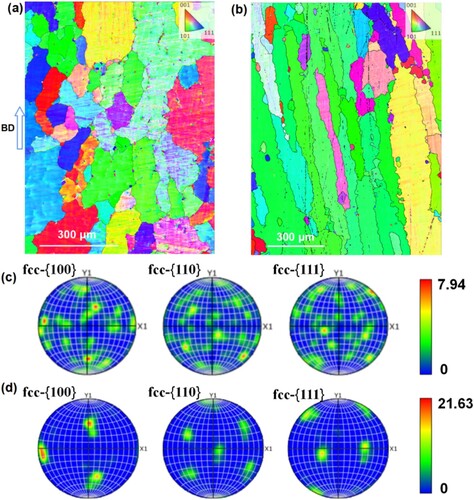
In the present work, the sample used for tensile testing possesses the anisotropy, as it forms columnar crystals along the BD. To clarify this result, the EBSD results are shown in . We analysed grains at different locations of the EBPDFed samples in parallel BD. a shows the IPF at 2 mm from the bottom of the sample, and most of the grains in this region are still equiaxial crystals with no obvious preferred orientation. The region at 20 mm from the bottom is shown in b, and the grains in this region are very clearly with a long bar-shaped columnar crystal. In addition, c,d give the pole figures corresponding to the two positions. There is a high-density pole at (100) in c, but its intensity is only 7.94. While the maximum texture index shown in d reaches 21.63, and the high-density red pole suggests that the sample has a strong (100)//BD fibre texture on the side. Based on the SEM images in , b1 displays columnar crystals, while d3 shows a cross-section of the columnar crystals. Therefore, we can conclude that the predominant structure of the sample is columnar crystals, and the anisotropy in the tensile properties across different orientations mainly stems from this structure. As illustrated in Figure S4, applying tensile forces from two directions with variations in the microstructure, leading to differences in the tensile properties. In this case, the Young's modulus will also differ in the two directions. Previous research has demonstrated that the Young's modulus is orientation-dependent, with slightly lower values along the (100) orientation compared to other orientations [Citation36].
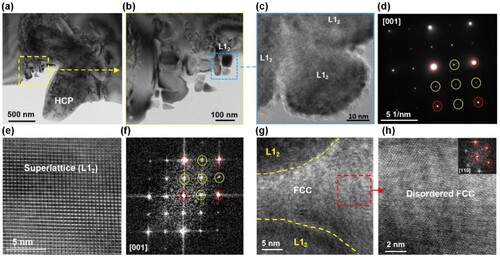
To further understand the more detailed microstructure of the EBPBFed sample, TEM analysis was conducted and the results are shown in . Bright-field (BF) scanning transmission electron microscopy (STEM) images of the EBPBF samples show the TiB-rich (HCP) phase and the L12 phase (a,b). The high-resolution transmission electron microscope (HRTEM) image of the L12 phase is shown in c, and its corresponding selected-area electron diffraction (SAED) pattern is shown in d. A clear superlattice of FCC can be viewed, and similar superlattice of L12 phase nanoparticles has been captured previously [Citation13,Citation14,Citation32]. e shows a sharper HRTEM picture of the L12 precipitated phase, and its corresponding fast Fourier transform (FFT) pattern (f) also shows superlattices. In the middle of the nanoparticles is the FCC phase, as shown in g,h. A clearer explanation of h shows the corresponding FFT pattern of the FCC phase. In addition, we did a similar analysis for the other two precipitated phases (L21 and HCP).
Figure 6. TEM images of L12 and FCC phases. (a) BF-STEM image of the EBPBF sample shows HCP phase and L12 phase. (b) Enlarged view of L12 nanoparticles phase. (c) HRTEM image of the L12 phase. (d) The corresponding SAED pattern of L12 phase in figure c, which shows obvious superlattice diffraction spots (yellow circle). (e) HRTEM image shows the superlattice of the L12 phase. (f) The corresponding FFT pattern of figure e also shows the superlattice diffraction spots. (g) FCC matrix between L12 phases. (h) HRTEM image of FCC phase and corresponding FFT pattern.
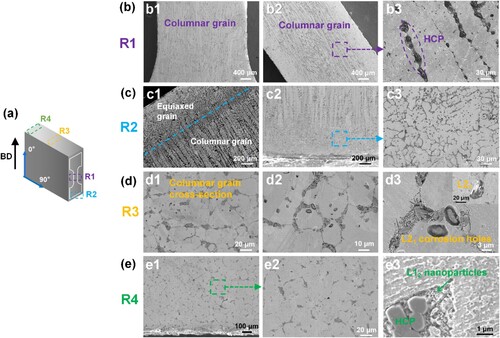
Observing the corroded EBPBF samples, two precipitated phases, i.e. a TiB-rich (HCP) phase with black colour and an Al-rich (L21) phase with grey colour, can be clearly observed in the EPMA mapping, as shown in Figure S5. These two precipitation phases are also found in many references [Citation37,Citation38]. As can be seen, the oxygen content is also examined and its distribution is very homogeneous, implying no oxides are formed in the two precipitated phases. SEM observations are further carried out to examine the microstructure. The sample corroded is shown in Figure S6a, where GBs and TiB-rich phases can be observed. The TiB-rich phases tend to aggregate at the GBs and only a small amount precipitate inside the grains. In Figure S6b, the morphology of the TiB-rich phase becomes more clearly, presenting a regular hexahedral structure that similar to TiB2 crystals as an HCP structure. shows the images obtained under SEM. Three types precipitated phases, i.e. the nanocubic particles L12, the TiB-rich phase, and the island-like L21 phase, can be observed. The TiB-rich phase can be easily distinguished from the backscattered electron (BSE) pattern (b), while L12 and L21 phases are similar to the substrate liner but still can be distinguished. c,d show the morphologies of the L12 phase exhibiting nano-sized particles with sizes less than 300 nm. As demonstrated above, our preliminary analyses indicate that the microstructure of the EBPBFed samples is very complex with various phases. In addition, tensile samples cut from the bulk samples after corrosion were also subjected to SEM characterisation, and the results are demonstrated in . Interestingly, the long bar-like grains, which are the columnar crystals, can be clearly seen in the figure (b1). The columnar crystals grow mainly along the BD, and many HCP phases are found in their GBs. During build process of EBPBF, to maintain the high temperature of the powder bed all the time, preheating is carried out for each layup of powder, which results in a continuous heat transfer from the top to the bottom, thus creating favourable conditions for the formation of columnar grains [Citation39]. It was also found in c2 that both the bottom and top of the tensile samples along the BD are equiaxed crystals with a clear demarcation line from the columnar crystals. In this study, the formation of equiaxed crystals is advantageous due to the smaller temperature gradient. A critical step in the EBPBF process is preheating, where the entire substrate is heated to temperatures exceeding 900 °C. This ensures more uniform grain growth in the vicinity of the substrate. During printing, each layer of powder is preheated, resulting in heat transfer from the top to the bottom. As a consequence, the heat dissipation near the bottom of the substrate becomes insufficient, leading to a small temperature difference that promotes the formation of equiaxed crystals. Additionally, the powder wrapping around the substrate hinders heat dissipation at the bottom, further contributing to this phenomenon. Therefore, the preheating process plays a crucial role in the formation of equiaxed crystals. This observation is consistent with the findings reported in reference [Citation40]. d3, e4 show SEM images of vertical BD, these two areas show the cross section of columnar crystals, where the three precipitation phases mentioned earlier (L12, L21 and HCP) can also be found. The tensile samples cut along different BDs have different microstructures and theoretically show different results in subsequent mechanical tests.
Figure 7. SEM images of EBPBF samples with various precipitates. (a) Surface topography of the sample after 30 s of corrosion. (b) Precipitation phases in BSE mode. (c) Nanoparticles L12. (d) Enlarged view of the L12 nanoparticles.
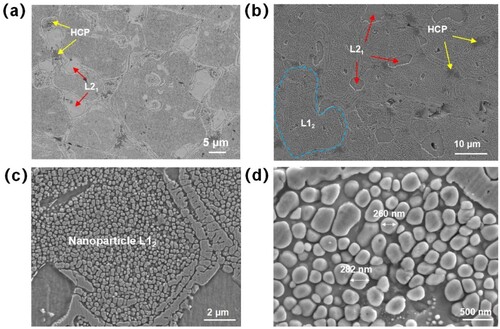
Figure 8. The anisotropy of EBPBF sample structure. (a) Schematic diagram of EBPBF samples and marking each area. (b) R1: SEM images of columnar crystals. (c) R2: SEM images of columnar and equiaxed crystals. (d) R3: L21 phase in columnar crystal cross-section. (e) R4: L12 phase in columnar crystal cross-section.
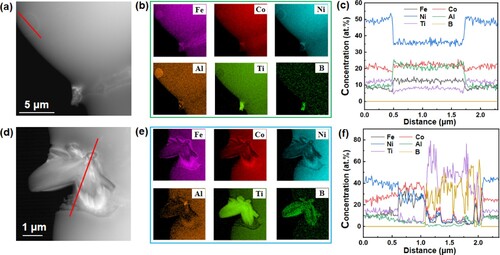
a shows an overview dark-field (DF) STEM image of the TiB-rich (HCP) phase, and the corresponding SAED pattern is presenting in b, showing the diffraction lattice along the [2110] zone axis. c shows the HRTEM of the HCP phase and its corresponding FFT pattern. It is found that the atomic structure of the TiB-rich phase is identical to TiB2 compound. Correspondingly, d shows the BF-STEM image of the L21 phase. The corresponding SAED pattern obtained from the [110] axis is shown in e, where superlattices (yellow circles) characteristic of the L21 phase can be identified. HRTEM image of the L21 phase and the corresponding FFT pattern further confirm the presence of the ordered superlattice structures (f). In addition, the STEM-BF image shown in demonstrates the two precipitated phases as we illustrated above. A detailed EDS mapping of the two precipitated phases is performed and the results are given in a,b and d–e. The mapping of phase L21 clearly shows a large enrichment of Al element and a small enrichment of Fe element. With a line scan (red line in a), the results are basically the same as those of the surface scan, in which Co is also found to be a little enriched, Ni and Ti are obviously reduced, and B is not detected due to its small content (c). In e,f, the surface scan and line scan of the HCP phase are displayed respectively, it can be seen that Ti and B elements are apparently enriched while reduced for the rest elements.
Figure 9. TEM characterisation of HCP and L21 precipitated phases. (a) DF-STEM image of the HCP phase. (b) The corresponding SAED pattern of the HCP phase that obtained from the [2110] zone axis. (c) HRTEM image of the HCP phase and corresponding FFT pattern. (d) BF-STEM image of the L21 phase. (e) The corresponding SAED pattern of the L21 phase that obtained from the [110] zone axis, showing superlattice diffraction spots (yellow circle). (f) HRTEM image of the HCP phase and corresponding FFT pattern.
![Figure 9. TEM characterisation of HCP and L21 precipitated phases. (a) DF-STEM image of the HCP phase. (b) The corresponding SAED pattern of the HCP phase that obtained from the [2110] zone axis. (c) HRTEM image of the HCP phase and corresponding FFT pattern. (d) BF-STEM image of the L21 phase. (e) The corresponding SAED pattern of the L21 phase that obtained from the [110] zone axis, showing superlattice diffraction spots (yellow circle). (f) HRTEM image of the HCP phase and corresponding FFT pattern.](/cms/asset/c707fd98-7866-4ffd-b74e-5d0f0f889c11/nvpp_a_2356733_f0009_oc.jpg)
Figure 10. Elemental distribution of HCP and L21 precipitated phases. (a) BF-STEM of the L21 phase. (b) EDS mapping of figure a. (c) Line scan results of the red line in Figure a. (d) BF-STEM of the HCP phase. (e) EDS mapping of figure d. (f) Line scan results of the red line in d.
3.3. Analysis of hot cracking
3.3.1. Effect of low-angle grain boundaries on hot cracking
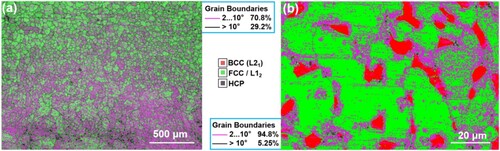
Hot cracks, as one of the most common defects in AM, are almost unavoidable in numerous efforts. However, in our OM and SEM results, most of the samples were found only with a few pores, while hot cracks were rarely found. In the EBSD results, we were surprised to find that a large number of LAGBs appeared in the sample, as shown in . Especially at the bottom of the sample in a, the dense LAGBs can be clearly identified with a percent being up to 70%. b shows a large number of LAGBs distributed around the L21 and HCP phases, and its content even reaches 94.8% in this range. Thus, this phenomenon deserves an in-depth discussion.
Figure 11. Distribution patterns of LAGBs. (a) EBSD pattern showing LAGBs, HAGBs and phase distribution. (b) Enlarged image showing more clearly the distribution of LAGBs.
In order to clarify this phenomenon, we combined XRD patterns and related calculations to obtain the lattice parameters of the FCC, L21, and HCP phases as: = 3.614 Å,
= 2.908 Å and
= 3.030 Å, respectively. The lattice misfit (δ) between the two phases can be expressed as [Citation32]:
(2)
(2) where
and
are the lattice parameters of the two phases, respectively, and
>
. δ is calculated to be 21.6% of the L21 phase with the matrix FCC, and 17.6% of the HCP with the matrix FCC. When δ < 5% is coherent interface, 5% < δ < 25% is semi-coherent interface. From the results, it can be seen that both precipitated phases are in semi-coherent state with the matrix. That is why a large number of the geometrically necessary dislocations (GNDs) are generated at the interfaces, thus helping to accommodate the residual thermal strains in the vicinity of the GBs [Citation41]. In addition, we conjecture that numerous LAGBs may appear around the two precipitation phases, most likely GNDs. In the subsequent section, confirms that there is indeed a high density of GNDs around the HCP phase.
As shown in previous work, Gou et al. [Citation42] found that Hastelloy X is susceptible to emerge severe hot cracking behaviour at GB angles from 20° to 45°. The susceptibility source of cracks mainly originated from HAGBs, and at least 75% of the cracks preferentially occurred in the GB angle range of 20°∼45°. On the other hand, Wu et al. [Citation41] demonstrated that the dendrite coalescence theory can account for thermal cracking in relation to the GB angle. The minimum cracking misorientation angle is 15.6°, and the hot cracking susceptibility increases with the GB misorientation angle. In this work, it is almost difficult to detect the presence of hot cracks due to the large percentage of LAGBs. The introduction of L21 and HCP phases is the main reason, which can be acted as heterogeneous nucleation sites, enriching the microstructure of EBPBF samples while increasing the density of LAGBs.
3.3.2. Effect of liquid film stability on hot cracking
In general, there are two main causes of thermal cracking: liquid film and stress concentration [Citation42]. In AM, the presence of a stable liquid film is a crucial factor for hot cracking, whereas stress concentration is the primary cause for propagating it. As the temperature decreases, the solid phase volume fraction (fs) increases and the columnar grains grow in the heat-absorbing direction. According to Rappaz's theory, when fs < 0.90, it favours the formation of channels for liquid feed, enabling cracks to self-heal. When fs > 0.94, the continuous liquid film transforms into separated droplets. When the solid phase fraction in the mushy zone is 0.90 < fs < 0.94, vulnerable zones with high hot cracking susceptibility exist within individual grains [Citation43]. In this interval, the liquid film will tear under applied stress and form hot cracks [Citation44]. To assess the stability of the liquid film, we can use the following formula [Citation45]:
(3)
(3) where
represents dendrite coalescence undercooling, Δ
is the fusion entropy, δ is the diffuse interface thickness of 1 nm, γgb is the GB energy, and γsl is the solid/liquid interfacial energy. When γgb > 2γsl, it indicates a condition conducive to maintaining the stability of the liquid film, resulting in repulsive forces between grains and continued crack expansion under this force. When γgb < 2γsl, the surface GB energy is low, and the grains will be attracted to each other leading to liquid film rupture. In other words, the GB energy is high or low can affect the formation or inhibition of hot cracks.
As mentioned before, hot cracking generally occurs only in HAGBs. Coincidentally, it is found in our characterisation that most of the precipitated phases (especially the TiB-rich phase) are enriched at GBs (Figures 7a and 8). It has been demonstrated in previous studies that B segregation to HAGBs decreases the GBs energy and favours the GBs cohesion [Citation46]. This means that the migration of B elements within the crystal to the grain boundaries reduces the GB energy. Similar GBs segregation or precipitation to reduce GBs energy has been mentioned in many references, such as TiC, NiW, etc. [Citation47–50]. As a result, the GB energy continues to decrease as a large amount of TiB phase precipitates at GBs, and when it decreases to γgb < 2γsl, the liquid film becomes unstable ( < 0) and the grains are attracted to each other, disrupting the formation and extension of hot cracks.
3.4. Mechanical properties
To evaluate the mechanical properties of the EBPBF samples, we performed hardness and tensile tests at room temperature. a shows the Vickers hardness of each group of EBPBF samples, which are taken from the middle cross-section of the samples. The average Vickers hardness of the best parameterised sample A7 is 434 ± 10 HV, which is higher than that in the cold-rolled alloy sample with the same composition [Citation14]. The high hardness may be related to the high amount of HCP and L21 precipitated phases in the samples because previous studies have shown that the L21 phase precipitates are harder with respect to the FCC matrix and B2 phase precipitates [Citation51]. b shows the engineering tensile stress–strain curves of EBPBF samples with varying loading directions at room temperature. The horizontal and vertical tensile specimens extracted from the EBPBF samples are schematically illustrated in the inset of b. Upon loading vertical the BD, EBPBF sample exhibits a tensile yield strength of 736.3 ± 24.6 MPa and ductility of 11.4 ± 1.0%. Upon loading along the BD, the yield strength is 662.7 ± 12.1 MPa and the ductility is 8.9 ± 1.2%. Moreover, the ultimate tensile strength in the perpendicular BD is also higher than that in the parallel BD, which are 1015.2 ± 9.3 MPa and 893.9 ± 15.1 MPa, respectively. Building such CCIMA using EBPBF offers significant performance advantages over other simple intermetallic alloys such as Ni3Al-based alloys [Citation23], which typically have low strengths of ∼400 MPa and virtually no ductility when prepared using EBPBF. In the references [Citation52–54], tensile properties are strongly dependent on the loading directions, i.e. tensile samples along different BDs have different strength and ductility. There is also anisotropy in the tensile properties in our results. Combined with the EBSD images of and SEM images of , we can conclude that the structure of the sample is predominantly columnar crystals, resulting in the anisotropy of the tensile properties in different orientations. Perpendicular to BD has better properties than parallel to BD, but the difference in strength is small and the difference in ductility is only 2%. The samples parallel to BD may be due to the reduction of GBs in that direction, since precipitated phases at the GBs leading to GB strengthening are our main strengthening mechanism. Therefore, the properties of the samples on parallel to BD are slightly weakened.
Figure 12. Mechanical properties and microstructure of the EBPBF tensile samples. (a) Vickers hardness of EBPBF samples. (b) Tensile engineering stress-strain curves of the EBPBF samples with different loading directions at room temperature. For comparison, a tensile curve of a Ni3Al intermetallic alloy prepared by EBPBF, with the tensile loading direction being vertical to BD [23], is also displayed.
![Figure 12. Mechanical properties and microstructure of the EBPBF tensile samples. (a) Vickers hardness of EBPBF samples. (b) Tensile engineering stress-strain curves of the EBPBF samples with different loading directions at room temperature. For comparison, a tensile curve of a Ni3Al intermetallic alloy prepared by EBPBF, with the tensile loading direction being vertical to BD [23], is also displayed.](/cms/asset/345d4eb2-62af-4aca-a827-12b0bdb3e880/nvpp_a_2356733_f0012_oc.jpg)
3.5. Fracture analysis and strengthening mechanisms
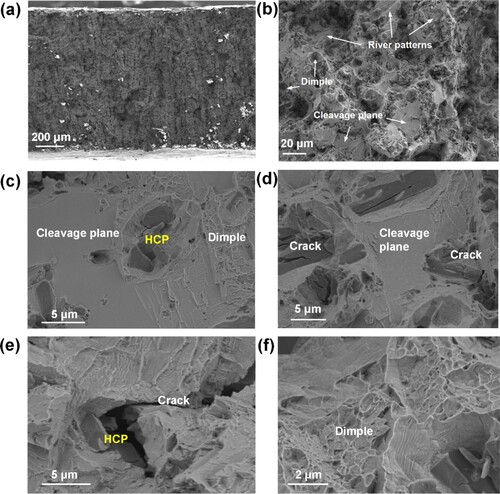
There are three effective strengthening mechanisms in our results: (1) GB strengthening, (2) second phase strengthening and (3) dislocation strengthening. GB strengthening mainly relies on the precipitation of the HCP phase at GBs. We did fracture analysis on the tensile samples of EBPBF, and the results are shown in . Among them, a–d show the SEM morphologies of the lateral surface after tensile fracture. With 15s corrosion on the lateral surface, several cracks can be clearly seen that formed inside the grain. When the cracks extend to the HCP phase located at the GBs, the cracks terminate or deflect (a). b shows the case of the cracks terminating in the HCP phase, which is also found in the fracture surface (e). Moreover, the HCP phase precipitates along the GB, which can effectively hinder the sliding of the GB [Citation55]. However, the HCP phase does not play a major role in the second phase strengthening, relying mainly on the L21 phase. On the contrary, the HCP phase decreases the plastic deformation ability of the sample. In the second phase strengthening, the L21 phase acts as an ordered BCC phase, which is harder than the matrix. The large-size L21 precipitates block the crack and slow down the crack propagation rate when cracks propagate from the intracrystalline to the GBs (c,d), and can effectively promote the closure of microcrack tips [Citation56]. Both precipitated phases can play an inhibitory role in crack extension and improve the tensile capacity of the samples. We also found brittle fracture, a shows the overall morphology of the fractured samples, where some river patterns and cleavage steps appear on the fracture surface (b), but its expansion is hindered by the HCP phase. As a result, a mixed fracture mode occurs on the postmortem fracture surface. c shows a mixed fracture type of this composite material, the left side of the HCP phase is the cleavage step while the right side is the dimple. In d, the HCP phase showed cracking and separation features indicating brittle fracture characteristics. Moreover, dimples can be found in many parts on the fracture surface (f), indicating that the sample failure is predominantly via ductile fracture.
Figure 13. SEM images of the lateral surface of the tensile fractured samples. (a) Corrosion of the 15s sample demonstrates that the crack terminates or changes direction after encountering the HCP phase. (b) Enlarged image of Figure a clearly shows that the HCP phase blocks the crack extension. (c, d) Large-size L21 phase blocks crack extension.
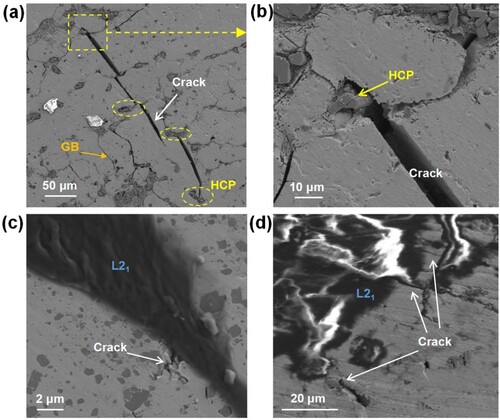
Figure 14. SEM images of the fracture surface of the tensile fractured samples. (a) Overall morphology of the fracture. (b) A magnified fracture morphology image. (c, d) HCP blocking the extension of cleavage plane observed at the cross-section of the tensile sample fracture. (e) Crack termination with HCP phase. (f) Dimple, the main feature of ductile fracture.
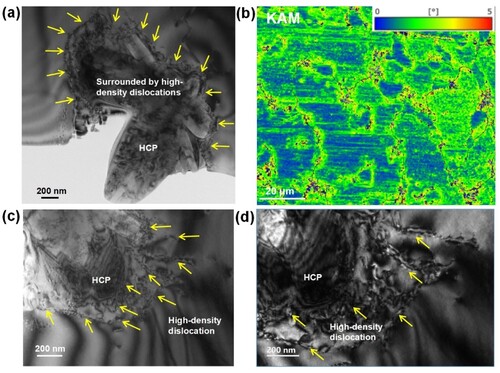
A large number of dislocations are generated due to the interface between the HCP (and L21) and the matrix being in a semi-coherent lattice relationship. Thus, dislocation reinforcement is a secondary strengthening mechanism. a shows the BF-STEM of the EBPBF sample, in which the HCP phase is surrounded by dislocation bands. The kernel average misorientation (KAM) results of the EBSD are shown in b, and the red spots around the HCP phase enriched at the GBs can be clearly seen, which means that the strain is more concentrated at the GBs. In addition, we provide a further demonstration of the HCP phase in these regions, as shown in Supplementary Material Figure S7. As pointed out in the previous discussion, the HCP phases are semi-coherent with the matrix, and dislocations are entangled around these phases. c,d show more details of the high-density dislocations (yellow arrows). In tensile experiment, the movement of active dislocations increases the plastic deformation capacity. In turn, the interaction of dislocations provides resistance to dislocation movement and therefore increases the yield strength [Citation57]. The significant work hardening found in the macroscopic tensile test results similarly suggests that dislocations inside the EBPBF samples play a strengthening role [Citation58].
Figure 15. Dislocations around HCP precipitates. (a) BF-STEM of the EBPBF sample, showing the HCP phase surrounded by dislocation bands. (b) The KAM pattern of the EBPBF sample. (c, d) High-density dislocations (yellow arrows) are around the HCP phase.
4. Conclusions
In this work, we used Ni43.9Co22.4Fe8.8Al10.7Ti11.7B2.5 powder for EBPBF. Through parameter optimisation, a crack-free CCIMA was successfully prepared, which exhibits an internal porosity of only 0.05%. The EBPBFed samples possess unique microstructures, i.e. L12 nanoparticles, disordered FCC phase, HCP phase segregated at grain boundaries, large and hard L21 phase, constructed during the EBPBF process. The CCIMAs show superior mechanical properties than simple intermetallic alloys. The EBPBF samples exhibit a high hardness of ∼ 434 ± 10 HV, high tensile strengths (yield strength ∼730 MPa, ultimate tensile strength >1 GPa), and a sufficient ductility of ∼ 11% at room temperature. Furthermore, the high tensile yield strength mainly originates from the dislocation strengthening, and the large ductility results from the impendence effects promoted by the HCP and large-size L21 precipitated phases. Our work highlights that a large number of dislocations were generated around the HCP and L21 phases, since they are in a semi-coherent state with the matrix, which consumed thermal stress concentration and produced the crack-free CCIMAs we observed. We will also explore the prospect of the present CCIMAs for EBPBF technology one more step further.
Supplemental Material
Download MS Word (6 MB)Disclosure statement
No potential conflict of interest was reported by the author(s).
Data availability statement
The data that support the findings of this study are available from the corresponding author [Xilei Bian], upon reasonable request.
Additional information
Funding
References
- Yan Y, Du JS, Gilroy KD, et al. Intermetallic nanocrystals: syntheses and catalytic applications. Adv Mater. 2017;29(14):1605997. doi:10.1002/adma.201605997
- Rößner L, Armbrüster M. Electrochemical energy conversion on intermetallic compounds: a review. ACS Catal. 2019;9(3):2018–2062. doi:10.1021/acscatal.8b04566
- David SA, Deevi SC. Welding of unique and advanced ductile intermetallic alloys for high-temperature applications. Sci Technol Weld Joining. 2017;22(8):681–705. doi:10.1080/13621718.2017.1304859
- Kim S-H, Kim H, Kim NJ. Brittle intermetallic compound makes ultrastrong low-density steel with large ductility. Nature. 2015;518(7537):77–79. doi:10.1038/nature14144
- Ward-Close CM, Minor R, Doorbar PJ. Intermetallic-matrix composites—a review. Intermetallics. 1996;4(3):217–229. doi:10.1016/0966-9795(95)00037-2
- Juechter V, Franke MM, Merenda T, et al. Additive manufacturing of Ti-45Al-4Nb-C by selective electron beam melting for automotive applications. Addit Manuf. 2018;22:118–126. doi:10.1016/j.addma.2018.05.008
- Clemens H, Mayer S. Design, processing, microstructure, properties, and applications of advanced intermetallic TiAl alloys. Adv Eng Mater. 2013;15(4):191–215. doi:10.1002/adem.201200231
- Deevi SC. Advanced intermetallic iron aluminide coatings for high temperature applications. Prog Mater Sci. 2021;118:100769. doi:10.1016/j.pmatsci.2020.100769
- Oliveira JP, Miranda RM, Braz Fernandes FM. Welding and joining of NiTi shape memory alloys: a review. Prog Mater Sci. 2017;88:412–466. doi:10.1016/j.pmatsci.2017.04.008
- Yang T, Cao BX, Zhang TL, et al. Chemically complex intermetallic alloys: a new frontier for innovative structural materials. Mater Today. 2022;52:161–174. doi:10.1016/j.mattod.2021.12.004
- Zhou N, Jiang S, Huang T, et al. Single-phase high-entropy intermetallic compounds (HEICs): bridging high-entropy alloys and ceramics. Sci Bull. 2019;64(12):856–864. doi:10.1016/j.scib.2019.05.007
- Feng R, Rao Y, Liu C, et al. Enhancing fatigue life by ductile-transformable multicomponent B2 precipitates in a high-entropy alloy. Nat Commun. 2021;12(1):3588. doi:10.1038/s41467-021-23689-6
- Yang T, Zhao YL, Tong Y, et al. Multicomponent intermetallic nanoparticles and superb mechanical behaviors of complex alloys. Science. 2018;362:933–937. doi:10.1126/science.aas8815
- Yang T, Zhao YL, Li WP, et al. Ultrahigh-strength and ductile superlattice alloys with nanoscale disordered interfaces. Science. 2020;369:427–432. doi:10.1126/science.abb6830
- Abdulhameed O, Al-Ahmari A, Ameen W, et al. Additive manufacturing: challenges, trends, and applications. Adv Mech Eng. 2019;11(2):1–27. doi:10.1177/1687814018822880
- Attaran M. The rise of 3-D printing: the advantages of additive manufacturing over traditional manufacturing. Bus Horiz. 2017;60(5):677–688. doi:10.1016/j.bushor.2017.05.011
- Gokuldoss PK, Kolla S, Eckert J. Additive manufacturing processes: selective laser melting, electron beam melting and binder jetting—selection guidelines. Materials (Basel). 2017;10(6):672. doi:10.3390/ma10060672
- Ma P, Fang Y, Wei S, et al. Microstructure and mechanical properties of AlCoCrFeMnNi HEAs fabricated by selective laser melting. J Mater Res Technol. 2023;25:7090–7100. doi:10.1016/j.jmrt.2023.07.124
- Jia H, Sun H, Wang H, et al. Scanning strategy in selective laser melting (SLM): a review. Int J Adv Manuf Technol. 2021;113(9-10):2413–2435. doi:10.1007/s00170-021-06810-3
- Körner C. Additive manufacturing of metallic components by selective electron beam melting - a review. Int Mater Rev. 2016;61(5):361–377. doi:10.1080/09506608.2016.1176289
- Rafi HK, Karthik NV, Gong H, et al. Microstructures and mechanical properties of Ti6Al4 V parts fabricated by selective laser melting and electron beam melting. J Mater Eng Perform. 2013;22(12):3872–3883. doi:10.1007/s11665-013-0658-0
- Wang J, Han Y, Zhao Y, et al. Microstructure and properties of WC-12Co cemented carbide fabricated via selective electron beam melting. Int J Refract Met Hard Mater. 2022;106:105847. doi:10.1016/j.ijrmhm.2022.105847
- Yao Y, Xing C, Peng H, et al. Solidification microstructure and tensile deformation mechanisms of selective electron beam melted Ni3Al-based alloy at room and elevated temperatures. Mater Sci Eng A. 2021;802:140629. doi:10.1016/j.msea.2020.140629
- Chen Y, Yue H, Wang X. Microstructure, texture and tensile property as a function of scanning speed of Ti-47Al-2Cr-2Nb alloy fabricated by selective electron beam melting. Mater Sci Eng A. 2018;713:195–205. doi:10.1016/j.msea.2017.12.020
- Zhou Q, Hayat MD, Chen G, et al. Selective electron beam melting of NiTi: microstructure, phase transformation and mechanical properties. Mater Sci Eng A. 2019;744:290–298. doi:10.1016/j.msea.2018.12.023
- Bian H, Aoyagi K, Zhao Y, et al. Microstructure refinement for superior ductility of Al–Si alloy by electron beam melting. Addit Manuf. 2020;32:100982. doi:10.1016/j.addma.2019.100982
- Zhang M, Zhou X, Wang D, et al. Additive manufacturing of in-situ strengthened dual-phase AlCoCuFeNi high-entropy alloy by selective electron beam melting. J Alloys Compd. 2022;893; doi:10.1016/j.jallcom.2021.162259
- Grubova IY, Surmenev RA, Neyts EC, et al. Combined first-principles and experimental study on the microstructure and mechanical characteristics of the multicomponent additive-manufactured Ti-35Nb-7Zr-5Ta alloy. ACS Omega. 2023;8(30):27519–27533. doi:10.1021/acsomega.3c03157
- Saedi S, Shayesteh Moghaddam N, Amerinatanzi A, et al. On the effects of selective laser melting process parameters on microstructure and thermomechanical response of Ni-rich NiTi. Acta Mater. 2018;144:552–560. doi:10.1016/j.actamat.2017.10.072
- Aboulkhair NT, Everitt NM, Ashcroft I, et al. Reducing porosity in AlSi10Mg parts processed by selective laser melting. Addit Manuf. 2014;1-4:77–86. doi:10.1016/j.addma.2014.08.001
- Wang P, Huang P, Ng FL, et al. Additively manufactured CoCrFeNiMn high-entropy alloy via pre-alloyed powder. Mater Des. 2019;168:107576. doi:10.1016/j.matdes.2018.107576
- Mu Y, He L, Deng S, et al. A high-entropy alloy with dislocation-precipitate skeleton for ultrastrength and ductility. Acta Mater. 2022;232:117975. doi:10.1016/j.actamat.2022.117975
- Huang J, Li W, He J, et al. Dual heterogeneous structure facilitating an excellent strength-ductility combination in an additively manufactured multi-principal-element alloy. Mater Res Lett. 2022;10(9):575–584. doi:10.1080/21663831.2022.2067790
- Lu H, Deng W, Luo K, et al. Tailoring microstructure of additively manufactured Ti6Al4 V titanium alloy using hybrid additive manufacturing technology. Addit Manuf. 2023;63:103416. doi:10.1016/j.addma.2023.103416
- Ahn D-G, Lee H-J. Investigation of novel metal additive manufacturing process using plasma electron beam based on powder bed fusion. CIRP Ann. 2019;68(1):245–248. doi:10.1016/j.cirp.2019.04.124
- Zhang W, Yu H, Huang Q-A. Paper presented at the 2011 16th International Solid-State Sensors, Actuators and Microsystems Conference, 2011.
- Feng R, Zhang C, Gao MC, et al. High-throughput design of high-performance lightweight high-entropy alloys. Nat Commun. 2021;12(1):4329. doi:10.1038/s41467-021-24523-9
- Xu P, Lu G, Zhang L, et al. Effect of holding time on the growth morphology of in-situ TiB2 particles. Mater Today Commun. 2021;29:102953. doi:10.1016/j.mtcomm.2021.102953
- Fujieda T, Shiratori H, Kuwabara K, et al. CoCrFeNiTi-based high-entropy alloy with superior tensile strength and corrosion resistance achieved by a combination of additive manufacturing using selective electron beam melting and solution treatment. Mater Lett. 2017;189:148–151. doi:10.1016/j.matlet.2016.11.026
- Peng C, Jia Y, Liang J, et al. Electron beam melting of (FeCoNi)86Al7Ti7 high-entropy alloy. J Alloys Compd. 2023;960:170752. doi:10.1016/j.jallcom.2023.170752
- Wu S, Lei Z, Li B, et al. Hot cracking evolution and formation mechanism in 2195 Al-Li alloy printed by laser powder bed fusion. Addit Manuf. 2022;54:102762. doi:10.1016/j.addma.2022.102762
- Guo B, Zhang Y, Yang Z, et al. Cracking mechanism of Hastelloy X superalloy during directed energy deposition additive manufacturing. Addit Manuf. 2022;55:102792. doi:10.1016/j.addma.2022.102792
- Rappaz M, Drezet JM, Gremaud M. A new hot-tearing criterion. Metall Mater Trans A. 1999;30(2):449–455. doi:10.1007/s11661-999-0334-z
- Han Q, Gu Y, Huang J, et al. Selective laser melting of Hastelloy X nanocomposite: effects of TiC reinforcement on crack elimination and strength improvement. Composites Part B Eng. 2020;202:108442. doi:10.1016/j.compositesb.2020.108442
- Rappaz M, Jacot A, Boettinger WJ. Last-stage solidification of alloys: theoretical model of dendrite-arm and grain coalescence. Metall Mater Trans A. 2003;34(3):467–479. doi:10.1007/s11661-003-0083-3
- Tytko D, Choi P-P, Klöwer J, et al. Microstructural evolution of a Ni-based superalloy (617B) at 700°C studied by electron microscopy and atom probe tomography. Acta Mater. 2012;60(4):1731–1740. doi:10.1016/j.actamat.2011.11.020
- Detor A, Schuh C. Grain boundary segregation, chemical ordering and stability of nanocrystalline alloys: atomistic computer simulations in the Ni–W system. Acta Mater. 2007;55(12):4221–4232. doi:10.1016/j.actamat.2007.03.024
- Kirchheim R. Reducing grain boundary, dislocation line and vacancy formation energies by solute segregation. I. Theoretical background. Acta Mater. 2007;55(15):5129–5138. doi:10.1016/j.actamat.2007.05.047
- Raabe D, Herbig M, Sandlöbes S, et al. Grain boundary segregation engineering in metallic alloys: a pathway to the design of interfaces. Curr Opin Solid State Mater Sci. 2014;18(4):253–261. doi:10.1016/j.cossms.2014.06.002
- Pan C, Zhu D, Luo H, et al. Fabrication of high-performance CoCrNi medium entropy alloy by laser powder bed fusion: the effect of grain boundary segregation. Composites Part B Eng. 2023;253:110540. doi:10.1016/j.compositesb.2023.110540
- Choudhuri D, Alam T, Borkar T, et al. Formation of a Huesler-like L21 phase in a CoCrCuFeNiAlTi high-entropy alloy. Scr Mater. 2015;100:36–39. doi:10.1016/j.scriptamat.2014.12.006
- Fujieda T, Shiratori H, Kuwabara K, et al. First demonstration of promising selective electron beam melting method for utilizing high-entropy alloys as engineering materials. Mater Lett. 2015;159:12–15. doi:10.1016/j.matlet.2015.06.046
- Zhang Y, Fang X, Wang H, et al. Microstructure and low-cycle fatigue performance of selective electron beam melted Ti6Al4 V alloy. Int J Fatigue. 2022;163:107017. doi:10.1016/j.ijfatigue.2022.107017
- Sun S-H, Koizumi Y, Kurosu S, et al. Build direction dependence of microstructure and high-temperature tensile property of Co–Cr–Mo alloy fabricated by electron beam melting. Acta Mater. 2014;64:154–168. doi:10.1016/j.actamat.2013.10.017
- Li S, Li JY, Jiang ZW, et al. Controlling the columnar-to-equiaxed transition during directed energy deposition of Inconel 625. Addit Manuf. 2022;57:102958. doi:10.1016/j.addma.2022.102958
- Xu L, Jia Y, Wang Z, et al. Dual precipitate simultaneous enhancement of tensile and fatigue strength in (FeCoNi)86Al7Ti7 high-entropy alloy fabricated using selective laser melting. J Mater Sci Technol. 2023;148:90–104. doi:10.1016/j.jmst.2022.09.068
- Wen H, Topping TD, Isheim D, et al. Strengthening mechanisms in a high-strength bulk nanostructured Cu–Zn–Al alloy processed via cryomilling and spark plasma sintering. Acta Mater. 2013;61(8):2769–2782. doi:10.1016/j.actamat.2012.09.036
- Zhang W, Wu J, Wen Y, et al. Characterization of different work hardening behavior in AISI 321 stainless steel and Hadfield steel. J Mater Sci. 2010;45(13):3433–3437. doi:10.1007/s10853-010-4369-8