
 ?Mathematical formulae have been encoded as MathML and are displayed in this HTML version using MathJax in order to improve their display. Uncheck the box to turn MathJax off. This feature requires Javascript. Click on a formula to zoom.
ABSTRACT
Widespread use of topology optimisation as a design tool for additive manufacturing faces major inhibiting obstacles, such as high computational costs and complexity, concern for other failure modes, and manufacturability. Interactive infill topology optimisation presents an alternative approach to circumvent some of these barriers. The novel contribution of the present work prompts the user to draw a tailored infill pattern, specify regions of interest to locate the infill, and control how strictly the pattern is replicated in the material layout of the design using appearance constraints. This approach improves engineering metrics not directly included in the optimisation formulation by incorporating the user’s engineering experience, thereby avoiding increased computational costs, parameter tuning, and numerical artifacts associated with complex objective functions and constraints. Two 2D benchmark examples increase the linear buckling resistance and energy absorption, respectively, and a 2.5D example minimises compliance while reducing the quantity of overhang supports for additive manufacturing.
1. Introduction
Topology optimisation is a computational design method to generate material efficient, high performing structures according to a user defined objective function and constraints. The free form design characteristics of topology optimisation yield unique, unconventional structures that are frequently difficult to manufacture using traditional means; therefore, additive manufacturing is often essential to production. The layer-by-layer approach of most additive manufacturing technologies, such as Fused Deposition Method (FDM) or Selective Laser Melting (SLM), are feasible manufacturing methods for the topology optimised designs. Especially as plastic extrusion and resin photolithography 3D printers are more affordable and widely available, it is less difficult to produce topology optimised structures. The field of topology optimisation early on recognised its reliance upon 3D printing technology and therefore, the research expanded in the last decade to develop algorithms tailored to additive manufacturing [Citation1–8]. Examples include topology optimisation codes with an overhang angle constraint [Citation4–6,Citation9], modified stiffness for filament bonding strength [Citation7,Citation10] and infill optimisation [Citation11–16].
Density-based topology optimisation discretizes the design domain into finite elements and imposes loads and boundary conditions. The elemental densities are the design variables and traditionally, the optimisation minimises the compliance, or maximises the stiffness, subject to a volume constraint. Additionally, a filter is applied for the regularisation of the design variables, imposing a length scale that suppresses checkerboards and ensures the optimisation formulation is well-posed [Citation17]. Initially, the algorithm distributes the material uniformly across the design domain. A finite element analysis determines the primal solution of the density field for a given optimisation iteration, calculating the objective function and constraint values, as well as determining the derivatives of the objective function and constraint with respect to each elemental design variable of the density field. The elemental derivatives of the objective function and constraint, called sensitivities, are applied in a mathematical programming, such as the Method of Moving Asymptotes (MMA) [Citation18], redistributing the density field in each optimisation iteration to minimise the objective function and satisfy the constraints. The next optimisation iteration resumes with the new density field associated with a lower objective function value (higher performance) and feasible constraint values (satisfying the volume constraint). Topology optimisation algorithms iteratively approach a local minimum for the material layout of the design space.
The flexibility when applying gradient-based optimisation allows for a variety of objective functions or constraints. The field of topology optimisation has grown to reduce stress concentrations [Citation19–25], maximise linear buckling load [Citation26–29], and increase energy absorption [Citation30–33] as objective function and constraints. However, these enhanced algorithms are generally associated with higher computational costs as additional optimisation iterations, evolved modelling, prerequisite knowledge of feasible and well-posed topology optimisation formulations, and more design parameters. Interactive topology optimisation for guided geometrical patterns does not attempt to match the performance of specialised optimisation codes, but instead provide a computationally cheap, user-guided alternative approach to improve alternative engineering metrics while minimising compliance or similar simple objective functions. For example, the 250-line topology optimisation code maximising the buckling load [Citation26] takes 420 minutes to increase the buckling load by a factor of 5 [Citation34], while the present work can increase the buckling load by 1.47 in 20 minutes.
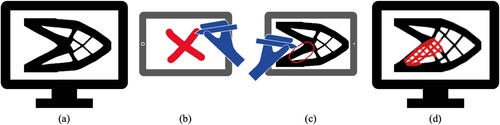
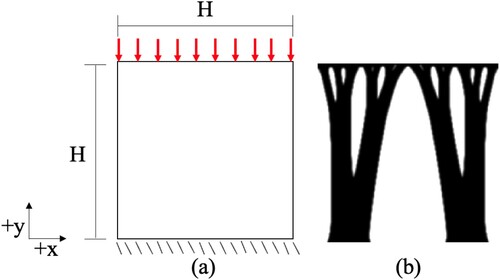
Interactive topology optimisation schemes fill a practical gap by allowing users to leverage their engineering experience and expertise to increase other performance metrics, while keeping the optimisation formulation complexity low. An example of guided interactive infill topology optimisation is shown in , where an initial optimisation is done in (a) and afterwards, the user draws the infill pattern in (b) and specifies the region of interest (ROI) for the infill in (c) on the previous optimised design. Subsequently, the user is actively involved in the interactive infill optimisation, guiding the optimised design toward desired properties or design targets, as shown in (d).
Figure 1. Interactive infill topology optimisation initially applies (a) 50 optimisation iterations using traditional compliance topology optimisation, after which the user (b) draws an infill pattern and (c) defines the region of interest (ROI) to locate the infill pattern. The algorithm resumes using an activated appearance constraint (d) to geometrically guide the optimised material layout for the defined region.
2. Background and motivation
Interactive infill topology optimisation builds upon the emerging research in design optimisation using a computer graphics-based image analysis method called Patch Match [Citation35,Citation36]. Patch Match is a tool for image editing determining the nearest neighbour matches between patches of source and target images to reshuffle, complete, or manipulate the target image [Citation35,Citation36]. The foundation of Patch Match lies in calculating the Euclidean distance between the pixels of images [Citation37] and is applied to image and video editing, computer graphics, and art to create exciting, unique imagery [Citation38,Citation39]. A complete review of patch-based synthesis for image editing is outside the scope of this paper but can be found in [Citation40] and references therein. Due to the discretization of the design domain for density-based topology optimisation, a patch-based approach is a natural extension for image editing using pixel patches to design optimisation using finite element patches. Recent work explores the use of Patch Match for aesthetic design [Citation41–46], the generation of infill for additive manufacturing [Citation47], and the use of machine learning to assist neural style transfers between a source image and topology optimised material layout [Citation48]. However, interactive infill topology optimisation introduces a unique approach allowing one to generate the source image and decide where the appearance constraint should be applied within the design domain.
The introduction of infill in topology optimisation is a proven method for improving manufacturability [Citation11,Citation13–15] or alternative engineering performance metrics such as buckling [Citation12]. Topology optimisation of shell/infill or coated structures creates porous, lightweight, interconnected structures that do not require support material and that have lower residual stresses during additive manufacturing [Citation49]. Designs that can be printed without supports avoid the potential defects caused by support connection points, as well as the extra manufacturing time, sacrificial material, tools, and labour required for the removal of support parts. Recent work in multiscale topology optimisation explores the simultaneous design of the macro and microscale for lattice structures [Citation50], additive manufacturing [Citation51], and robust load cases [Citation52]. Unlike traditional topology optimisation, these multiscale methods explicitly control feature sizes by mapping infill patterns within a coated shell or macrostructure [Citation51]. Engineering the microscale of structures through the design of mechanical metamaterials for unique functions, such as maximising specific energy absorption, can be done using triply periodic minimal surfaces (TPMS) [Citation53–55], or through multiscale topology optimisation, which is discussed in detail in [Citation56].
Another established method for generating these infill structures and improving manufacturability in topology optimisation is through length scale control. Increasing the minimum length scale of void and solid phases allows for the prevention of small void regions or thin members that are difficult to additively manufacture [Citation57–62]. Control of the maximum length scale generates porous infill structures reducing the need for support material [Citation58,Citation62–65]. Length scale modifications to improve manufacturability and generate infill structures can also be generated for topology optimisation using the level set method [Citation13,Citation66,Citation67]. Few algorithms explore the spatial variation of length scale controls, which imposes a maximum or minimum feature size in the design for localised regions to target certain geometrical material layouts, such as reducing the maximum stress at a sharp corner [Citation68]. This paper builds upon the spatial variation of length scale control by allowing control over where the infill will be located and locally, what the material layout should resemble.
There exist multiple methods to incorporate geometrical user defined design targets in topology optimisation. Algorithms such as iBESO (Bidirectional Evolutionary Structural Optimisation) and HiTop (Human Informed Topology Optimisation) applies human engineering experience and expertise to the design process using two different optimisation methods. iBESO uses subjective scoring of designs to guide the next set of designs generated by the BESO algorithm until the design satisfies the targets [Citation69]. There is an additional feature within iBESO that allows the users to draw a feature, which the BESO algorithm will attempt to replicate in the optimised design [Citation69]. HiTop is a density-based topology optimisation approach that pauses pre-convergence to allow the user to modify the length scale requirements for certain regions of interest (ROIs) across the domain [Citation34,Citation70]. Commercially available software, such as Tosca or Fusion, have topology optimisation plug-ins including manufacturability features that allow for similar spatial variations in length scale requirements [Citation71]. Unlike the interactive topology optimisation approaches, one must define the prescribed regions for the modified feature sizes prior to running the optimisation and the feature sizes cannot directly be modified during the optimisation iterations.
2.1. Existing methods
The interactive infill topology optimisation presented herein is a novel approach that builds upon the principles of interactive topology optimisation, first presented as iBESO and HiTop. The iBESO approach enables users to draw patterns that the algorithm will explicitly match in the final design [Citation69]. In contrast, HiTop [Citation34,Citation70] enables user selection of ROIs where local feature-size specifications are updated during the optimisation iterations. These interactive approaches have been shown to provide an alternative method of improving performance metrics not directly included in the optimisation formulation without increasing complexity. Topology optimisation implementations that are specialised, for example dynamics or large deformations applications, will attain designs having higher optimised performance, but these solutions frequently require high computational costs and heuristic approaches as artificial numerical stabilisation of void regions [Citation72,Citation73]. Patch Match topology optimisation algorithms that universally replicate source images across the design domain also experience increased computational costs for the void regions [Citation41].
Established numerical implementations and commercial software accommodating manufacturing constraints often lack the flexibility of spatial local variations in the manufacturing requirements. Frequently for commercial software, one must partition the design domain as preprocessing and select partitioned regions to impose an overhang constraint, minimum and/or maximum feature size requirement prior to running the optimisation. In these scenarios, one must predefine and determine how to influence the optimised design without prior knowledge of how an optimised design might look or which regions could be most critical to other design requirements.
2.2. Key contributions
The present development of guided optimised designs having selective regions of drawn infill is novel, as unlike established academic approaches or commercial solutions, it attains a higher degree of design freedom to consider other design requirements that are not directly formulated in the objective function or constraints. Interactive infill topology optimisation increases geometrical control of the design by the user and does not only allowing users to draw a pattern to guide the design layout as in [Citation69] but also to decide the specific regions for the infill and how strongly the drawn pattern is replicated in the final optimised design. Using the guided interactive infill pattern, one chooses where to locate the infill and will likely not choose all void regions, thereby avoiding a significant increase in computational costs, as in [Citation41]. This additional design control allows one to target other performance metrics according to anticipated load types, failure criteria, and manufacturing considerations not included directly in the optimisation formulation without increasing the computational costs and modelling complexity for non-linear static structural transient analysis and the corresponding optimisation formulations. For example, if one anticipates an impact load near the surface of a structure, then one may enforce a porous infill pattern only at the region close to the surface to increase the crashworthiness energy absorption without considerably affecting the overall stiffness and strength near the supports for the static load cases.
The guided interactive infill approach differs from previous interactive topology optimisation works by placing the drawn infill patterns using an appearance constraint during the optimisation iterations. Using a simple binary field description and appearance constraint, without the complexity of applying nonlinear weighting functions, the interactive infill approach avoids the undesirable artifacts and intermediate densities seen by many length scale projection schemes. Thereby, the present solution yields clearer solutions using less optimisation iterations. It is also more intellectually approachable for novice topology optimisation users looking to generate customised designs engineered with specific infill to improve desired performance metrics. Unlike established academic solutions or commercial software, interactive infill topology optimisation provides control to the human designer, often without a significant loss in optimality for the objective function and constraints compared to the inherent optimisation formulation. Methods and costs for post-processing the optimised topology for manufacturability can be eliminated or reduced as manufacturing considerations and decisions can be added and modified during the interactive infill topology optimisation process [Citation70].
Initially, the paper will describe a passive approach for customised infill topology optimisation in Section 3, then introduce the workflow, mathematical formulation, and numerical implementation for the guided interactive infill topology optimisation in Section 4. Section 5 demonstrates the interactive design process on two 2D benchmark examples using the drawn customised infill for improving engineering performance metrics which are not directly included in the objective function and constraints. Section 6 discusses how the present approach can reduce overhang support material for additively manufactured test beams.
3. Passive infill topology optimisation
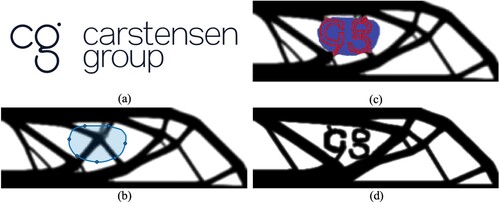
Passive infill topology optimisation defines elements within a selected Region of Interest (ROI) to be solid or void according to a user-drawn pattern as shown in . These elements are not included as design variables in the optimisation; therefore, this approach is better suited for fulfilling aesthetic design requirements or accommodating strict mechanical assembly requirements, for example at interfaces. The passive infill topology optimisation approach is demonstrated on an aesthetic application using a half symmetric, MBB beam, where the aim is to incorporate the logo shown in (a). The optimisation begins by running 50 iterations employing the 88-line topology optimisation code [Citation74], after which the user selects an ROI, shown by the blue circle in (b) and draws a design, shown in (c). Afterwards, the optimisation workflow resumes having the elements within the enclosed red drawing, the ‘cg,’ being set to solid, and all other elements within the blue ROI are set to void. Thereby, both the solid and void elements in the ROI are not defined as design variables. The user is enforced to draw a pattern containing information on how the pattern can connect to the surrounding design elements outside the ROI. If the pattern does not include connective members, then the design will float within the structure, unable to influence the structural properties of the optimised design. The final output is shown in (d), preserving the passive drawing region and still minimising the compliance as the objective function, while satisfying the volume constraint.
Figure 2. Aesthetic application of passive infill implementation: (a) design inspiration, (b) user drawn region of interest (ROI), (c) passive infill pattern within the ROI having predefined interface connections to the design elements, and (d) converged optimised design.
Although this example is for purely aesthetic design exploration, it is analogous to the use of ‘frozen regions’ in industrial topology optimisation software. The passive approach can be useful for designing optimised parts in an assembly requiring certain connecting members and holes at predefined interfaces.
4. Guided interactive infill topology optimisation
Unlike the passive infill topology optimisation implementation described in Section 3, the interactive infill topology optimisation applies an appearance constraint to replicate the pattern while still including the elements of the infill pattern as design variables. Having the infill elements as design variables allows the optimisation algorithm to balance between satisfying the appearance constraint for the infill pattern and minimising the objective function and fulfilling the constraints. A specified parameter for the infill topology optimisation interactively controls the tradeoff between the geometrical appearance of the infill pattern and structural performance defined by the objective function and constraints, allowing one to determine which metrics are prioritised during the optimisation process. This approach can improve other performance targets not directly present in the objective function and constraints, for example stress, buckling, or energy absorption, in a fraction of the time. In the present work, the interactive infill topology optimisation applies the classic topology optimisation formulation minimising compliance subject to a volume constraint. The present approach is not limited to compliance topology optimisation but can be applied for minimising mass as the objective function, subject to stiffness or strength requirements. However, as previously emphasised, it may be desirable to influence other design requirements not directly included in the optimisation formulation. Therefore, for demonstration purposes, the paper focuses on minimising compliance subject to a volume fraction and influences alternative design requirements, which in the literature would often be addressed by having these directly formulated in the objective function or constraints.
4.1. Optimisation workflow
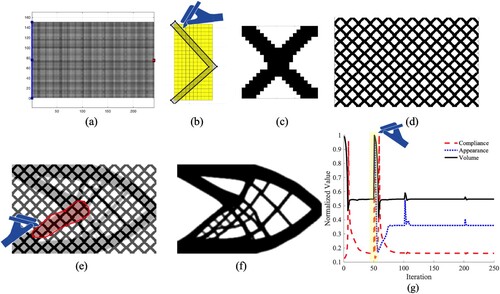
The workflow for the guided interactive infill topology optimisation is shown in . Initially, the design domain is defined in in (a) for the specific loads, boundary conditions, and non-designable regions. Next, the user draws half of a symmetric infill pattern shown in (b), being converted into a full infill pattern in (c) and the full infill pattern is repeated across the entire design domain as shown in (d). The user only draws half of an infill pattern to generate a symmetric infill patch, which ensures continuity across the infill and optimised design. The conventional compliance topology optimisation runs for 50 optimisation iterations and the present interim topology optimised result is overlaid using the infill pattern allowing the user to draw a ROI, shown in red at (e). The interactive infill topology optimisation applies the appearance constraint only for the specified ROI enforcing the predefined pattern, yielding the final optimised design shown in (f). As expected, when the user enforces the drawn infill pattern, the appearance constraint is activated and the compliance increases, shown in (g) at the highlighted region. At the start of the optimisation and at iteration 50 which activates the appearance constraint, the compliance value is lower than the converged compliance value due to those optimisation iterations violating the volume constraint. As the volume and appearance constraint are satisfied, the compliance lowers to a value comparable to the 50 iteration output. The irregularities in the compliance value, appearance constraint, and volume constraint at iterations 100 and 200 are due to continuation of parameters controlling the clarity of the optimised design.
Figure 3. (a) Defined design space for compliance optimisation. (b) Half drawing of a symmetric infill pattern, (c) generate full infill patch, (d) reflect the infill patch across the entire design domain, and (e) at 50 optimisation iterations, interactively overlay the interim topology optimised design to draw a ROI. (f) The guided interactive infill topology optimisation resumes and converges to a design applying the pattern in the ROI. (g) The convergence plot for the compliance, appearance constraint, and volume constraint, where the highlighted portion and hand figure denotes the optimisation iteration where the user enforced the drawn infill pattern.
4.2. Modifications for compatible infill
The performance of designs is highly dependent upon the applied drawings of the compatible infill patterns. Therefore, the present optimisation algorithm prompts the user to draw half of an infill pattern defined across the width of the infill patch, as shown in (b,c). The authors found that drawing half of an infill pattern is a reliable method to prevent disconnected material and promote continuity across the infill pattern and the rest of the optimised design.
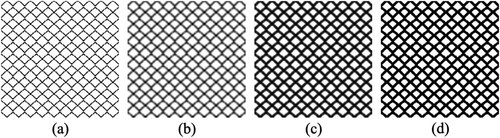
For enforcing a minimum feature size requirement, the infill pattern is passed through the classic density filter used to ensure a minimum length scale and to prevent checkerboarding of the elemental density distribution [Citation16]. (a) shows an example of a drawn infill pattern, while (b) shows the filtered infill density distribution ‘smearing’ the density distribution of the pattern to satisfy the minimum length scale requirement. The infill pattern shown in (b) is blurry due to this smearing effect upon the design layout. The filtered pattern is then passed through a Heaviside’s function to extrapolate the filtered density field toward a solid/void distribution, as shown in (c). Afterwards, the extrapolated density distribution for the infill pattern is decisively set to 0 or 1 for each element, using a cutoff threshold of 0.5. Defining a binary 0,1 infill pattern is critical to achieve clear solutions for the optimised topologies as the appearance constraint aims to replicate the density values of the infill pattern. The infill pattern must be repeated across the entire design domain prior to filtering to ensure the connection points between the patches of the entire infill pattern also satisfy the minimum length scale requirement.
Figure 4. (a) Infill as drawn by the user, (b) passed through the density filter to enforce a minimum length scale feature size, (c) passed through a Heaviside's filter to extrapolate toward a solid/void distribution, and (d) the final binary infill pattern using a threshold cutoff of 0.5.
4.3. Topology optimisation formulation
Guided interactive infill topology optimisation follows the classic formulation shown in Equation (1), which aims to minimise the compliance subject to an equilibrium constraint, volume fraction constraint, and the lower and upper design variable bounds. However, the guided interactive infill optimisation includes the additional appearance constraint for the appearance value, , which must be less than or equal to 1. Hence, the optimisation formulation is as follows [Citation41,Citation74]:
(1)
(1) Where x is the vector of non-physical design variables,
is the vector of physical relative elemental densities as a function of x, simplified to ρ for notation, the objective function c is the compliance, or inverse of stiffness for a single load case, U is the vector for the nodal displacements, K is the assembled stiffness matrix, F is the vector for the nodal forces, V (ρ) is the volume of the design defined by the physical relative elemental densities, V0 is the volume of the full design domain, f is the relative volume fraction constraint, A (ρ) is the appearance constraint value, Ω is the design domain. To encourage a solid-void solution, the Solid Isotropic Material Penalisation (SIMP) Method [Citation17] is implemented to penalise intermediate densities using Equation (2):
(2)
(2) where
is the Young’s modulus as a function of the physical relative elemental density
,
is a small number to ensure the stiffness matrix is positive definite,
is the initial Young’s modulus, and
is a penalisation factor. For this paper,
,
, and
. Continuation of the penalisation factor
increases to 5 at the 50th optimisation iteration and 7 at the 150th optimisation iteration. The design variable
, is first passed through the classic density filter to enforce a minimum feature size in the optimised design, yielding
. The filter is shown in Equations (3) and (4) [Citation74].
(3)
(3)
(4)
(4) Where
is the filtered design variable with enforced minimum length scale,
is a matrix of weighting factors,
is the radius defining the minimum solid feature size, and
is the neighbourhood of elements within
of element
. The filter also prevents checkerboards in the optimised design caused by the SIMP method’s penalisation of intermediate densities. The filtered design variable
, is then passed through a Heaviside projection to further push its value towards 0, void, or 1, solid. For this paper, the following Heaviside projection is used [Citation75]:
(5)
(5) Where
is the physical relative elemental density,
is the steepness factor and set initially to 5 for this work. Continuation increases the steepness factor
to 15 at the 50th optimisation iteration and 25 at the 150th optimisation iteration. The physical relative elemental density
is used for calculating the appearance constraint, volume constraint, the finite element modelling, and the corresponding compliance.
The appearance constraint is calculated using a distance formula [Citation41] summing the squared difference between the physical elemental density and the corresponding user defined infill pattern described in Section 4.2 as the following:
(6)
(6) Where
is the distance value for element e,
is the physical relative elemental density of element j in the neighbourhood
of element e,
is the density value for element j of the defined infill pattern, and
is the collection of elements located in the user drawn ROI. The neighbourhood containing elements
for element e,
, is defined by one half of the width for the patch upon which the infill is drawn. For example, if the user draws the infill pattern on a patch that is 20 elements wide in the x-direction and 15 elements tall in the y-direction, then
includes all elements
within 10 elements of element e. A normalised sum of the squared difference between the physical relative elemental densities and the infill pattern densities allows for elements outside of the drawn ROI to influence the appearance constraint. If an element
is not located in the drawn ROI,
, but is in the neighbourhood,
, of element e which lies in the drawn ROI, it still impacts the elemental distance
. This facilitates continuity across the boundary of the ROI and ensures connection between the replicated drawn infill and the rest of the optimised design. The difference
is calculated for each element e in the ROI,
, generating a vector
, that is ultimately summed into
. Thereby, the appearance constraint [Citation41] yields:
(7)
(7) Where the appearance constraint
is a function of
, the vector of elemental distances of the drawn infill pattern,
is the ROI, and
is a parameter controlling how strictly the appearance constraint is enforced. For low
, the distance between
and
. is small, generating a very exact replication of the infill pattern. For this work,
is calculated using the scheme outlined in [Citation41] defined as:
(8)
(8) Where
is the parameter controlling the rigidity of the appearance constraint,
is a user defined value, set to 0.3 for the numerical examples in Section 5 and varied for the numerical examples in Section 6, and
is the appearance value for the defined drawn infill pattern and the interim topology optimised degn at 50 optimisation iteration using the 88 line code [Citation74].
4.4. Sensitivity calculations
Appearance constrained topology optimisation is a gradient-based approach that requires the calculation of sensitivities for the objective and constraints with respect to the design variable, . The sensitivity of the compliance with respect to the design variables can be found using the chain rule as shown in Equation (9).
(9)
(9) The first term is the derivative of the compliance with respect to the physical relative elemental density and yields Equation (10) for the SIMP method [Citation74].
(10)
(10) The second term in Equation (9) is the derivative of the physical elemental density with respect to the design variable, which is similarly found using the chain rule in Equation (11).
(11)
(11) The first term in Equation (11) applies the derivative of the Heaviside’s projection with respect to the filtered density
and is calculated using Equation (12) [74].
(12)
(12) The second term in Equation (11) takes the derivative of the classic density filter with respect to the design variable
and is calculated using Equation (13) [Citation76,Citation77].
(13)
(13) Similarly, the appearance constraint is calculated using the chain rule, shown in Equation (14), where the derivative of the appearance is found with respect to the physical elemental density.
(14)
(14) The first term of Equation (14) is found using Equation (15), applying the derivative of the appearance constraint with respect to the elemental distances [Citation41]. The sensitivity of the appearance constraint with respect to elements outside of the ROI is set to 0 to ensure compatibility with Equations (11–13) without activating the appearance constraint outside of
.
(15)
(15) The second term of Equation (14) is determined using Equation (16), which calculates the derivative of the elemental distance with respect to the physical elemental density.
(16)
(16) Afterwards, the optimisation problem in Equation (1) is solved using the derivatives of the objective function and constraints defined in Equations (9–16) and the Method of Moving Asymptotes (MMA) [Citation18] which is a mathematical programming method for structural optimisation.
5. Numerical examples
5.1. Increase linear buckling resistance
The guided interactive infill topology optimisation is demonstrated on a 2D benchmark short cantilever example as shown in (a). The objective is to minimise compliance subject to a volume fraction, . The number of elements in the x – and y – direction is 90 and 210, respectively. The number of elements in the pattern patch in the x – and y – direction is 20 for both directions and the appearance constraint parameter
is 0.3.
Figure 5. (a) Design domain for a short cantilever design domain. (b) traditional compliance optimised structure, (c) user drawn infill for the patch, (d) full infill pattern for the entire design domain, (e) user drawn ROI on overlaid infill pattern and the interim 50-iteration optimised design, and (f) converged optimised design for guided interactive infill optimisation.
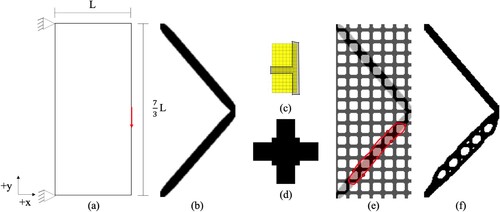
The short cantilever is first designed using traditional compliance topology optimisation, as shown in (b). However, the structure is prone to buckling due to the slenderness ratio of the lower member being in compression. The user would like to reduce this failure mode and thereby, increase the maximum buckling carrying capacity of the structure by enforcing a customised infill in the lower member of the structure. Therefore, one draws an infill pattern shown in (c, d) and chooses the lower region ROI shown in (e). The final optimised design is shown in (f) for the entire workflow using the guided interactive infill optimisation approach. The small holes in the final, converged design of (f) could pose a challenge to manufacturability but can be mitigated by imposing a two-phase minimum length scale of the solid and void material phases.
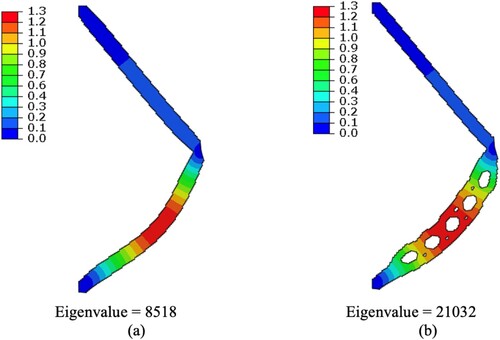
Both optimised structures in (b, f) are post-processed as 2D shell finite element models using the finite element solver Abaqus [Citation71], subject to the initial load, material properties, and boundary conditions. The guided interactive infill optimised cantilever structure in (b) has a 39.3% higher compliance than the traditional compliance optimised structure in (a). However, the traditional compliance optimised design is highly prone to buckling due to its high slenderness ratio. A linear eigenvalue buckling analysis demonstrates that the guided interactive infill topology optimised design yields a 147% increase in the lowest buckling eigenvalue for the dimensionless, normalised displacement plots for the given linear buckling eigenmodes in . Although the coating material surrounding the infill pattern provides the main structural capacity for the linear buckling stability, rather than the infill itself, the material distribution shown in (b) is the direct result of the changes by the user enforced on the material layout of the optimised design.
Figure 6. Lowest linear buckling eigenvalue and normalised displacements of the eigenmodes showing the failure location for the (a) traditional compliance optimised short cantilever and the (b) guided interactive infill topology optimised short cantilever, respectively.
Interactive infill topology optimisation can also be applied to more challenging design problems to increase the buckling resistance, such as the L-bracket shown in (a). The objective is to minimise compliance subject to a volume fraction, . The number of elements in the x – and y – direction is 200. The number of elements in the pattern patch in the x – and y – direction is 20 for both directions and the appearance constraint parameter
is 0.3.
Figure 7. (a) Design domain for a L-bracket. (b) Traditional compliance topology optimised design. (c) Drawn O-infill for the patch, (c) full O-infill pattern, (d) ROI, (e) converged interactive infill topology optimised design.
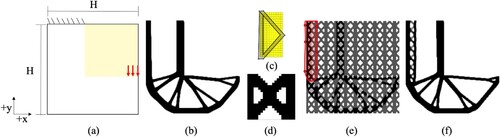
The traditional topology optimised L-bracket is shown in (b). Based on their engineering intuition, a user identifies that the left upper member of the traditional optimised L-bracket would be the most likely to buckle under the loading shown in (a). Therefore, the user draws the infill pattern shown in (c,d) and ROI in (e). The converged, interactively modified design is shown in (f). As in the short cantilever example, the L-brackets are post-processed in Abaqus and yield the buckling shapes shown in .
Figure 8. Lowest linear buckling eigenvalue and normalised displacements of the eigenmodes showing the failure location for the (a) traditional compliance optimised L-bracket and the (b) guided interactive infill topology optimised L-bracket, respectively.
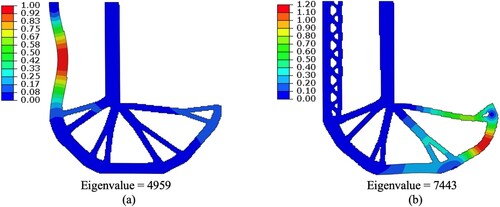
Compared to the traditional optimised L-bracket shown in (a), the interactive infill optimised L-bracket shown in (b) has a 5% higher compliance value and 50% higher lowest linear buckling eigenvalue. The L-bracket example demonstrates that similar improvements in linear buckling resistance can be realised for more challenging design problems. However, the relative increase in the lowest buckling eigenvalue is smaller than the obtained increase in the linear buckling load for the simplistic short cantilever example shown in .
5.2. Increase energy absorption
Introducing infill into a design is an established method of increasing the impact resistance and crashworthiness energy absorption of the structure, especially when subjected to blast and high rate impact loading. Increasing the energy absorption using infill is demonstrated on a 2D square design domain being fully clamped at the bottom edge and applied to pressure load on the top edge, shown in (a). The number of elements for the design domain in both the x – and y – direction is 200, the number of elements in the pattern patch in both the x – and y – direction is 20, and the appearance constraint parameter γ is 0.3.
Figure 9. (a) Design domain for a short compressive square. (b) Traditional compliance topology optimised design.
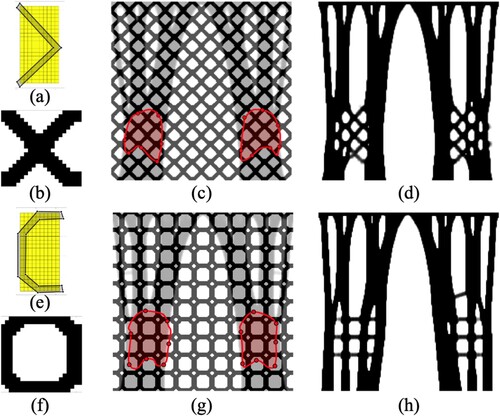
The traditional compliance topology optimised design is shown in (b) for a relative volume constraint . Two interactive infill topology optimised designs are generated using two different infill patterns: an O and an X shape. These two infill patterns are chosen because they are symmetric, generating a continuous infill field, and vary significantly in their distribution of material in the small infill patch. An optimised design is generated first using an X-infill in a lower ROI as shown in (a–d) and secondly using an O-infill in a similar ROI shown in (e–h). The variations of infill patterns will determine the optimised compliance and energy absorption for crashworthiness and impact.
Figure 10. (a) Drawn X-infill for the patch, (b) full X-infill pattern, (c) lower ROI for the X-infill, (d) converged X-infill interactive infill topology optimised design. (e) Drawn O-infill for the patch, (f) full O-infill pattern, (g) lower ROI for the O-infill, (h) converged O-infill interactive infill topology optimised design.
The three compressive square designs are analyzed using the Abaqus solver and shell finite elements having elastoplastic constitutive steel material properties [Citation78]. A compressive pressure load having a total of 70 kN is applied at the top edge of the structure creating force-displacement curves for the three optimised designs as shown in , where the gray dotted line marks the maximum load.
Figure 11. Force-displacement responses and respective plastic strain magnitudes at maximum load for the traditional, X-infill pattern, and O-infill pattern optimised designs.
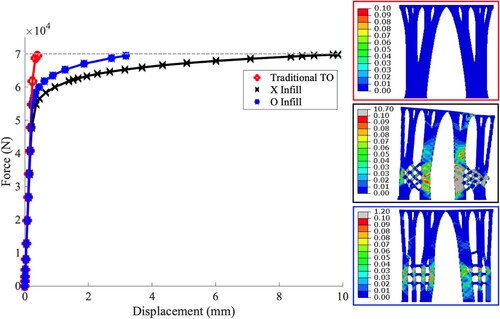
As demonstrated by the force-displacement responses and the corresponding plastic magnitude strain plots of the optimised designs at maximum load, the X-infill optimised design absorbs the most energy at maximum load, followed by the O-infill optimised design, and finally the traditional compliance topology optimised design. The X-infill optimised design has a 6.9% increase in compliance relative to traditional compliance topology optimisation. However, the design has 307.2% higher energy absorption. The O-infill optimised design increases the compliance by 3.0% and increases the energy absorption by 182.8%. demonstrates that the X-infill designs outperform the O-infill pattern for energy absorption, but both modified designs exhibit far more ductile behaviour than the traditional design. The authors explored multiple ROI locations, including locations closer to the upper edge where the load is applied, and found similar increases in the energy absorption. Unlike this example where the infill region is the location of plastic deformation, the alternative ROI locations similarly increased energy absorption even though the infill was not the direct mechanism of energy absorption. The guided patterns for interactive infill topology optimisation improve the external engineering performance metric for crashworthiness energy absorption without directly including an energy absorption measure in the objective function or constraints or applying non-linear finite element modelling. The improvement in performance is instead obtained by indirectly influencing the geometrical layout while still minimising compliance using linear finite element modelling subject to a 50% volume constraint.
6. Experimental example
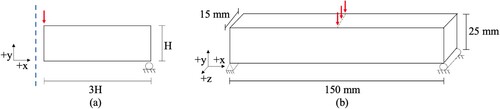
The guided interactive infill topology optimisation allows one to incorporate customised infill patterns at selective regions of the optimised design, which is particularly relevant when considering manufacturing costs for additive manufacturing. Support structures are generated for the regions of the 3D printed designs where the material violates a given overhang angle, such as 45° compared to the baseplate for printing. One can reduce the overhang in the final optimised design using the interactive infill topology optimisation algorithm and reduce the amount of support structures and manufacturing costs for printing. The reduction of overhang support structures is demonstrated using the 2D MBB beam, shown in (a) where half of the design domain is optimised. The 2D modelling is then extended to 2.5D modelling having the dimensions shown in (b). Based on a rule of thumb established by previous, successful experimental three-point bending tests, the out of plane thickness of the beam is selected as 15 mm (10% of the beam length L = 150 mm) to prevent out of plane buckling. The dimensions shown in (b) are used for all test specimens, therefore out of plane buckling has no impact on the experimental results and all beams exhibit flexural behaviour. The additive manufacturing uses a FDM printer where Polylactic Acid, or PLA, plastic filament is used to manufacture the optimised design and support structures. For this example, the relative volume constraint is . The number of elements in the x – and y – direction is 300 and 100, respectively. The number of elements in the pattern patch in the x – and y – direction is 20 and 30, respectively, and the appearance constraint parameter
is varied.
Figure 12. (a) Half symmetrical 2.5D design domain for the MBB beam topology optimisation and (b) the full dimensions of the beam imposed to additively manufacture the 2.5D optimised designs.
Three beams are designed using the drawn infill shown in (a,b), the three ROIs shown in (c), and the appearance constraint parameter γ = 0.3, 0.5 and 0.7, respectively. By having the ROI and infill pattern constant for the three optimizations, these numerical and experimental studies explore the effect of the appearance constraint with respect to two design requirements: minimised mass of the support structures for reduced printing costs versus minimised compliance. The three guided interactive infill optimised designs are shown in (c–e) and compared to the traditional topology compliance optimised design shown in (a), as well as the optimised design subject to with an overhang constraint shown in (b) [Citation6]. Lower γ value yields a more rigid appearance constraint for replicating the X-infill in the three ROIs ((c)), while a higher γ value ((e)) loosely applies the patterns creating a design more similar to the traditional compliance topology optimised design.
Figure 13. (a) The user draws a symmetrical infill pattern, it is (b) replicated to the full design domain and then repeated across the interim 50-optimisation iteration design upon which (c) the user defines three ROIs for achieving the guided interactive infill optimised designs.
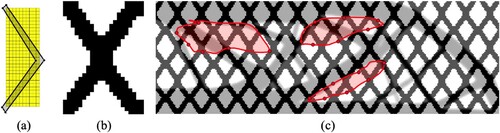
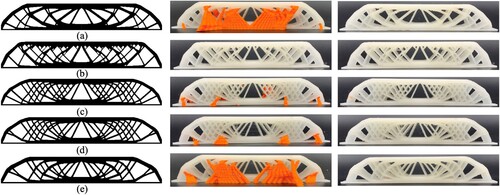
Figure 14. Topology optimised designs considering additive printing requirements printed with support structures (orange printed material), and post-manufacturing removing the support structures from the optimised designs obtained using (a) traditional compliance topology optimisation, (b) overhang constraint, and interactive infill enforced using (c) , (d)
, and (e)
.
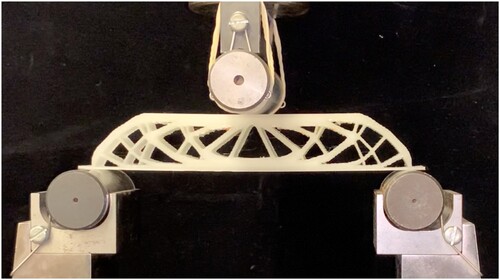
Three specimens of each of the five designs were additively manufactured using natural colour Ultimaker PLA material on an Ultimaker S3 FDM printer using G-code generated by Cura for slicing the designs. The G-Code parameters include 100% infill, 70° support angle, and tree branch support, structures are printed using the orange Ultimaker PLA material. The 2.5D printed designs were tested on a 100 kN Instron 3-point bending testing machine as shown in . The experimental compliance value was calculated from the slope of the force vs. displacement data in the beam’s elastic region, which is provided by the Instron testing machine.
Figure 15. Experimental set-up for the 3-point bending test using a 100 kN Instron machine.
The results of the numerical and experimental studies are shown in and . The numerical compliance predictions are within 3% of the experimental results, demonstrating excellent agreement between the loads and the boundary conditions used in the optimisation and the experimental 3-point bending test set-up. In general, as γ decreases and enforces a more rigid appearance constraint for the infill pattern, as expected, the compliance increases and the material for the support structures decreases. The correlation between the amount of material for the support structures and the compliance values suggest that a value of γ = 0.5 decreases the support material by 74% while maintaining stiffness performance within 3.1% of the traditional compliance topology optimised design. Additionally, the γ = 0.5 design outperforms the overhang constrained design by 0.7%, although the overhang design requires no support material. As previously mentioned, interactive infill topology optimisation provides a computationally cheap alternative method to improve performance metrics not included in the optimisation formulation. However, specialised numerical implementations will provide enhanced specific performance, as seen in the present example where the overhang has the largest reduction for the support material.
Figure 16. Comparison of compliance for the numerical results and physical experiments, as well as the mass required for support structures in the additive manufacturing process.
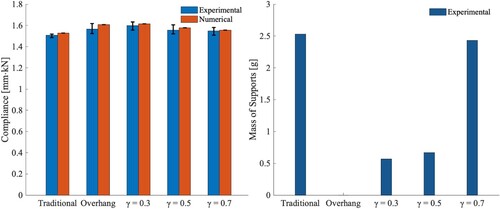
Table 1. Numerical and experimental compliance results for different topology optimised designs considering additive manufacturing requirements.
7. Conclusions
The interactive infill topology optimisation enables the user to guide the design generation toward desired design requirements not directly included in the optimisation problem formulation. Instead, based upon engineering experience and design expertise, the present approach uses an appearance constraint to guide the material layout interactively. Established optimisation approaches can address challenging objectives and constraints, such as minimising stress [Citation19–25] or maximising the lowest linear buckling eigenvalues [Citation26–29], or maximising the crashworthiness energy absorption [Citation30–33], and the designs of these approaches will have a better structural specific performance than those of the designs obtained using the guided interactive infill topology optimisation approach. However, the existing approaches often apply additional design parameters requiring tuning, as well as increased computational costs for both the finite element analysis and the number of optimisation iterations. The guided interactive infill topology optimisation is computationally cheaper as the modelling is static and linear elastic and is thereby approachable for novice users or those without computational experience in advanced modelling and optimisation but practical experience and know-how.
The present work first introduces a passive implementation for infill topology, allowing one to draw and prescribe a pattern in the final topology-optimised design. This control generates creative, unique aesthetic designs or creates custom void or solid regions for optimised parts nested within assemblies. Afterward, guided interactive infill topology optimisation is introduced and demonstrated on three numerical 2D optimisation benchmark examples and on one 2.5D example, where the optimised designs are examined both numerically and experimentally. It is worth noting that the proposed algorithm is formulated as a standalone differentiable function evaluated on a density field and added to the topology optimisation workflow. The guided interactive infill topology optimisation is demonstrated with compliance minimisation and a mass constraint for simplicity, but the method is, in principle, compatible with any other physical and geometrical objective or constraint found in the literature, as well as advanced boundary conditions such as kinematic couplings and multiple load case applications. It is also possible to apply the present interactive infill approach for multi-material topology optimisation. This could be achieved by the user drawing ROIs that selectively modify the Young’s Modulus throughout the domain, or by allowing infill patterns to have varying densities corresponding to the different materials in the design domain.
A limitation of the guided interactive infill topology optimisation is its difficulty in extending the approach to 3D applications. Although conceptually possible, future work will examine how to draw 3D infill patterns and intuitively select ROIs for 3D designs. Additionally, further exploration of the optimisation iteration for which the user should interactively modify the design requirements is needed, rather than the present default of using 50 optimisation iterations, as well as which appearance values are best suited for various applications. Lastly, as with any interactive algorithm, the present approach relies upon knowledgeable decisions by the user for the infill patterns and the different ROI locations. The present modifications to the workflow enforcing a symmetric infill pattern and the filtering of the infill to enforce a minimum feature size requirement ensure compatible infill drawings but do not guarantee high structural performing designs.
Disclosure statement
No potential conflict of interest was reported by the author(s).
Data availability statement
The authors confirm that the data supporting the findings of this study are available within the article.
Additional information
Funding
References
- Langelaar M. Topology optimization of 3D self-supporting structures for additive manufacturing. Addit Manuf. 2016;12:60–70. doi: 10.1016/j.addma.2016.06.010
- Liu J, Ma Y. A survey of manufacturing oriented topology optimization methods. Adv Eng Softw. 2016;100:161–175. doi: 10.1016/j.advengsoft.2016.07.017
- Liu J, et al. Current and future trends in topology optimization for additive manufacturing. Struct Multidiscip Optim. 2018;57(6):2457–2483. doi: 10.1007/s00158-018-1994-3
- Guo X, Zhou J, Zhang W, et al. Self-supporting structure design in additive manufacturing through explicit topology optimization. Comput Methods Appl Mech Eng. 2017;323:27–63. doi: 10.1016/j.cma.2017.05.003
- Gaynor AT, Guest JK. Topology optimization considering overhang constraints: Eliminating sacrificial support material in additive manufacturing through design. Struct Multidiscip Optim. 2016;54(5):1157–1172. doi: 10.1007/s00158-016-1551-x
- Langelaar M. An additive manufacturing filter for topology optimization of print-ready designs. Struct Multidiscip Optim. 2017;55(3):871–883. doi: 10.1007/s00158-016-1522-2
- Jewett JL, Carstensen JV. Topology optimization for material extrusion-based additive manufacturing processes with weak bead bonding. Comput Struct. 2023;289:107158. doi: 10.1016/j.compstruc.2023.107158
- Bayat M, et al. Holistic computational design within additive manufacturing through topology optimization combined with multiphysics multi-scale materials and process modelling. Prog Mater Sci. 2023;138:101129. doi: 10.1016/j.pmatsci.2023.101129
- Hoffarth M, Gerzen N, and Pedersen CBW. ALM overhang constraint in topology optimization for industrial applications. Proceedings of 12th World Congress on Structural and Multidisciplinary optimization, Braunschweig, Germany; 2017. p. 1–11.
- Carstensen JV, Kim-Tackowiak H, Liang MY. Improving the manufacturability of highly materially restricted topology-optimized designs with Mixed Integer Linear Programming. Eng Struct. 2023;284:115955. doi: 10.1016/j.engstruct.2023.115955
- Wu J, Aage N, Westermann R, et al. Infill optimization for additive manufacturing—approaching bone-like porous structures. IEEE Trans Vis Comput Graph. 2018;24(2):1127–1140. doi: 10.1109/TVCG.2017.2655523
- Clausen A, Aage N, Sigmund O. Exploiting additive manufacturing infill in topology optimization for improved buckling load. Engineering. 2016;2(2):250–257. doi: 10.1016/J.ENG.2016.02.006
- Fu J, Li H, Gao L, et al. Design of shell-infill structures by a multiscale level set topology optimization method. Comput Struct. 2019;212:162–172. doi: 10.1016/j.compstruc.2018.10.006
- Li H, Gao L, Li H, et al. Spatial-varying multi-phase infill design using density-based topology optimization. Comput Methods Appl Mech Eng. 2020;372:113354. doi: 10.1016/j.cma.2020.113354
- Li H, Li H, Gao L, et al. Topology optimization of multi-phase shell-infill composite structure for additive manufacturing. Eng Comput. 2023. doi: 10.1007/s00366-023-01837-4
- Gerzen N, Mertins T, Pedersen CBW. Geometric dimensionality control of structural components in topology optimization. Struct Multidiscip Optim. 2022;65(5):160. doi: 10.1007/s00158-022-03252-7
- Bendsøe MP. Optimal shape design as a material distribution problem. Struct Optim. 1989;1(4):193–202. doi: 10.1007/BF01650949
- Svanberg K. The method of moving asymptotes—a new method for structural optimization. Int J Numer Methods Eng. 1987;24(2):359–373. doi: 10.1002/nme.1620240207
- Yang RJ, Chen CJ. Stress-based topology optimization. Struct Optim. 1996;12(2–3):98–105. doi:10.1007/BF01196941
- Yang D, Liu H, Zhang W, et al. Stress-constrained topology optimization based on maximum stress measures. Comput Struct. 2018;198:23–39. doi: 10.1016/j.compstruc.2018.01.008
- Le C, Norato J, Bruns T, et al. Stress-based topology optimization for continua. Struct Multidiscip Optim. 2010;41(4):605–620. doi:10.1007/s00158-009-0440-y
- Amir O, Lazarov BS. Achieving stress-constrained topological design via length scale control. Struct Multidiscip Optim. 2018;58(5):2053–2071.
- Kiyono CY, Vatanabe SL, Silva ECN, et al. A new multi-p-norm formulation approach for stress-based topology optimization design. Compos Struct. 2016;156:10–19. doi: 10.1016/j.compstruct.2016.05.058
- Holmberg E, Torstenfelt B, Klarbring A. Stress constrained topology optimization. Struct Multidiscip Optim. 2013;48(1):33–47. doi: 10.1007/s00158-012-0880-7
- CHENG G, JIANG Z. Study on topology optimization with stress constraints. Eng Optim. 1992;20(2):129–148. doi: 10.1080/03052159208941276
- Ferrari F, Sigmund O, Guest JK. Topology optimization with linearized buckling criteria in 250 lines of Matlab. Struct Multidiscip Optim. 2021;63(6):3045–3066. doi: 10.1007/s00158-021-02854-x
- Liu Y, Lai Z, Lu Y, et al. Topology optimization of shell-infill structures considering buckling constraint. Comput Struct. 2023;283:107055. doi: 10.1016/j.compstruc.2023.107055
- Ferrari F, Sigmund O. A strategy for avoiding spurious localized buckling modes in topology optimization. Int J Numer Methods Eng. 2023;124(18):4118–4140. doi: 10.1002/nme.7309
- Dunning PD. Stability constraints for geometrically nonlinear topology optimization. Struct Multidiscip Optim. 2023;66(12):253. doi: 10.1007/s00158-023-03712-8
- Carstensen JV, Lotfi R, Guest JK, et al. Topology optimization of cellular materials With maximized energy absorption. In Volume 2B: 41st Design Automation Conference. American Society of Mechanical Engineers; 2015. doi: 10.1115/DETC2015-47757
- Pedersen CBW. Topology optimization design of crushed 2D-frames for desired energy absorption history. Struct Multidiscip Optim. 2003;25(5–6):368–382. doi: 10.1007/s00158-003-0282-y
- Chen Q, Zhang X, Zhu B. Design of buckling-induced mechanical metamaterials for energy absorption using topology optimization. Struct Multidiscip Optim. 2018;58(4):1395–1410. doi: 10.1007/s00158-018-1970-y
- Zhang J, Yanagimoto J. Topology optimization of microlattice dome with enhanced stiffness and energy absorption for additive manufacturing. Compos Struct. 2021;255:112889. doi: 10.1016/j.compstruct.2020.112889
- Ha DQ, Carstensen JV. Human-Informed Topology Optimization: interactive application of feature size controls. Struct Multidiscip Optim. 2023;66(3):59. doi: 10.1007/s00158-023-03512-0
- Barnes C, Goldman DB, Shechtman E, et al. The PatchMatch randomized matching algorithm for image manipulation. Commun ACM. 2011;54(11):103–110. doi: 10.1145/2018396.2018421
- Barnes C, Shechtman E, Finkelstein A, et al. PatchMatch. ACM Trans Graph. 2009;28(3):1–11. doi: 10.1145/1531326.1531330
- Kimmel R, Kiryati N, Bruckstein AM. Sub-pixel distance maps and weighted distance transforms. J Math Imaging Vis. 1996;6(2–3):223–233. doi:10.1007/BF00119840
- Kaspar A, Neubert B, Lischinski D, et al. Self tuning texture optimization. Comput Graph Forum. 2015;34(2):349–359. doi: 10.1111/cgf.12565
- Xiao C, Liu M, Yongwei N, et al. Fast exact nearest patch matching for patch-based image editing and processing. IEEE Trans Vis Comput Graph. 2011;17(8):1122–1134. doi: 10.1109/TVCG.2010.226
- Barnes C, Zhang F-L. A survey of the state-of-the-art in patch-based synthesis. Comput Vis Media (Beijing). 2017;3(1):3–20. doi: 10.1007/s41095-016-0064-2
- Navez T, Schmidt M-P, Sigmund O, et al. Topology optimization guided by a geometrical pattern library. Struct Multidiscip Optim. 2022;65(4):108. doi: 10.1007/s00158-022-03197-x
- Martínez J, Dumas J, Lefebvre S, et al. Structure and appearance optimization for controllable shape design. ACM Trans Graph. 2015;34(6):1–11. doi: 10.1145/2816795.2818101
- Schumacher C, Thomaszewski B, Gross M. Stenciling: designing structurally-sound surfaces with decorative patterns. Comput Graph Forum. 2016;35(5):101–110. doi: 10.1111/cgf.12967
- Dumas J, Lu A, Lefebvre S, et al. By-example synthesis of structurally sound patterns. ACM Trans Graph. 2015;34(4):1–12. doi: 10.1145/2766984
- Hu J, Li M, Gao S. Texture-guided generative structural designs under local control. Computer-Aided Design. 2019;108:1–11. doi: 10.1016/j.cad.2018.10.002
- Vulimiri PS, Deng H, Dugast F, et al. Integrating geometric data into topology optimization via neural style transfer. Materials (Basel). 2021;14(16):4551.doi: 10.3390/ma14164551
- Li Y, Zhang Z, Luo J, et al. Concurrent topology optimization of shells with pattern-guided infills for intuitive design and additive manufacturing. Comput Methods Appl Mech Eng. 2024;418:116485.
- Zhang W, Wang Y, Du Z, et al. Machine-learning assisted topology optimization for architectural design with artistic flavor. Comput Methods Appl Mech Eng. 2023;413:116041. doi: 10.1016/j.cma.2023.116041
- Wei D, Zhu G, Shi Z, et al. Isogeometric topology optimization for infill designs of porous structures with stress minimization in additive manufacturing. Int J Numer Methods Eng. 2024;125(3). doi:10.1002/nme.7391
- Hoang V-N, Tran P, Vu V-T, et al. Design of lattice structures with direct multiscale topology optimization. Compos Struct. 2020;252:112718. doi: 10.1016/j.compstruct.2020.112718
- Hoang V-N, Tran P, Nguyen N-L, et al. Adaptive concurrent topology optimization of coated structures with nonperiodic infill for additive manufacturing. Computer-Aided Design. 2020;129:102918. doi: 10.1016/j.cad.2020.102918
- Hoang V-N, Pham T, Ho D, et al. Robust multiscale design of incompressible multi-materials under loading uncertainties. Eng Comput. 2022;38(1):875–890. doi: 10.1007/s00366-021-01372-0
- Zhang X, Yan S, Xie X, et al. Multi-dimensional hybridized TPMS with high energy absorption capacity. Int J Mech Sci. 2024;273:109244. doi: 10.1016/j.ijmecsci.2024.109244
- Tran KQ, Hoang T-D, Lee J, et al. Three novel computational modeling frameworks of 3D-printed graphene platelets reinforced functionally graded triply periodic minimal surface (GPLR-FG-TPMS) plates. Appl Math Model. 2024;126:667–697. doi: 10.1016/j.apm.2023.10.043
- Nguyen NV, Tran KQ, Lee J, et al. Nonlocal strain gradient-based isogeometric analysis of graphene platelets-reinforced functionally graded triply periodic minimal surface nanoplates. Appl Math Comput. 2024;466:128461. doi: 10.1016/j.amc.2023.128461
- Gao J, et al. Rational designs of mechanical metamaterials: Formulations, architectures, tessellations and prospects. Materials Science and Engineering: R: Reports. 2023;156:100755. doi: 10.1016/j.mser.2023.100755
- Lazarov BS, Wang F, Sigmund O. Length scale and manufacturability in density-based topology optimization. Arch Appl Mech. 2016;86(1–2):189–218. doi:10.1007/s00419-015-1106-4
- Fernández E, Yang K, Koppen S, et al. Imposing minimum and maximum member size, minimum cavity size, and minimum separation distance between solid members in topology optimization. Comput Methods Appl Mech Eng. 2020;368:113157. doi: 10.1016/j.cma.2020.113157
- Li Q, Liang G, Luo Y, et al. An explicit formulation for minimum length scale control in density-based topology optimization. Comput Methods Appl Mech Eng. 2023;404:115761. doi: 10.1016/j.cma.2022.115761
- Zhou M, Lazarov BS, Wang F, et al. Minimum length scale in topology optimization by geometric constraints. Comput Methods Appl Mech Eng. 2015;293:266–282. doi: 10.1016/j.cma.2015.05.003
- Sigmund O. Morphology-based black and white filters for topology optimization. Struct Multidiscip Optim. 2007;33(4–5):401–424. doi:10.1007/s00158-006-0087-x
- Guest JK. Imposing maximum length scale in topology optimization. Struct Multidiscip Optim. 2009;37(5):463–473. doi: 10.1007/s00158-008-0250-7
- Lazarov BS, Wang F. Maximum length scale in density based topology optimization. Comput Methods Appl Mech Eng. 2017;318:826–844. doi: 10.1016/j.cma.2017.02.018
- Costa G, Montemurro M, Pailhès J, et al. Maximum length scale requirement in a topology optimisation method based on NURBS hyper-surfaces. CIRP Ann. 2019;68(1):153–156. doi: 10.1016/j.cirp.2019.04.048
- Carstensen JV, Guest JK. Projection-based two-phase minimum and maximum length scale control in topology optimization. Struct Multidiscip Optim. 2018;58(5):1845–1860. doi: 10.1007/s00158-018-2066-4
- Allaire G, Jouve F, Michailidis G. Thickness control in structural optimization via a level set method. Struct Multidiscip Optim. 2016;53(6):1349–1382. doi: 10.1007/s00158-016-1453-y
- Guo X, Zhang W, Zhong W. Explicit feature control in structural topology optimization via level set method. Comput Methods Appl Mech Eng. 2014;272:354–378. doi: 10.1016/j.cma.2014.01.010
- Schmidt M-P, Pedersen CBW, Gout C. On structural topology optimization using graded porosity control. Struct Multidiscip Optim. 2019;60(4):1437–1453. doi: 10.1007/s00158-019-02275-x
- Li Z, Lee T-U, Xie YM. Interactive structural topology optimization with subjective scoring and drawing systems. Computer-Aided Design. 2023;160:103532. doi: 10.1016/j.cad.2023.103532
- Schiffer G, Ha DQ, Carstensen JV. HiTop 2.0: combining topology optimisation with multiple feature size controls and human preferences. Virtual Phys Prototyp. 2023;18(1). doi:10.1080/17452759.2023.2268603
- “Dassault Systèmes Abaqus & Tosca; 2022. [Online]. Available from: www.simulia.com.”
- Buhl T, Pedersen CBW, Sigmund O. Stiffness design of geometrically nonlinear structures using topology optimization. Struct Multidiscip Optim. 2000;19(2):93–104. doi:10.1007/s001580050089
- Wang F, Lazarov BS, Sigmund O, et al. Interpolation scheme for fictitious domain techniques and topology optimization of finite strain elastic problems. Comput Methods Appl Mech Eng. 2014;276:453–472. doi: 10.1016/j.cma.2014.03.021
- Andreassen E, Clausen A, Schevenels M, et al. Efficient topology optimization in MATLAB using 88 lines of code. Struct Multidiscip Optim. 2011;43(1):1–16. doi: 10.1007/s00158-010-0594-7
- Guest JK, Prévost JH, Belytschko T. Achieving minimum length scale in topology optimization using nodal design variables and projection functions. Int J Numer Methods Eng. 2004;61(2):238–254. doi: 10.1002/nme.1064
- Bourdin B. Filters in topology optimization. Int J Numer Methods Eng. 2001;50(9):2143–2158. doi: 10.1002/nme.116
- Bruns TE, Tortorelli DA. Topology optimization of non-linear elastic structures and compliant mechanisms. Comput Methods Appl Mech Eng. 2001;190(26–27):3443–3459. doi: 10.1016/S0045-7825(00)00278-4
- “Defining materials in Abaqus,” Abaqus Version 6.8. [Online]. Available from: http://130.149.89.49:2080/v6.8/books/gsk/default.htm?startat=ch10s01.html