
 ?Mathematical formulae have been encoded as MathML and are displayed in this HTML version using MathJax in order to improve their display. Uncheck the box to turn MathJax off. This feature requires Javascript. Click on a formula to zoom.
ABSTRACT
Engineered cementitious composites (ECC) with superior tensile properties have potential to print self-reinforced structures. However, the environmental performance of 3D concrete printing with ECC (3DP-ECC) lacks further investigation. This study evaluates the environmental impacts of structures printed with 3DP-ECC via life cycle assessment. Results show that 3DP-ECC incorporating incineration bottom ash (IBA), crumb rubber (CR), and limestone powder (LP) reduce carbon emission by 25%, 24%, and 47%, respectively, compared to that of reinforced concrete (RC) with a steel ratio of 1.01%. A frame structure printed by LP-ECC reduces carbon emission by 42% compared to that of the unit fabricated by mold-cast RC (MC-RC). A circle house printed by LP-ECC reduces carbon emission by 28% compared to that of the counterpart fabricated by MC-RC. Sensitivity analysis identifies the transportation distance range to achieve a sustainable 3DCP. The findings provide a guideline to select appropriate 3DP-ECC and construction methods for sustainable construction.
1. Introduction
Climate change is a global challenge due to the substantial CO2 emission and energy consumption. In 2022, the global CO2 emissions reached 36.8 gigatons, which is a 0.9% increase compared to that of 2021 [Citation1]. The global energy consumption in 2022 was 14,585 Mtoe, which is a 2.1% increase compared to that of 2021 [Citation2]. The construction sector is one of the main contributors to CO2 emission and energy consumption, which accounted for 40% and 36% of the total, respectively, in 2022 [Citation3]. The CO2 emissions in the construction sector are mainly attributed to the construction processes and materials. The challenges to achieve sustainable construction are to develop and adopt advanced construction technologies and materials for the alleviation of the environmental impacts [Citation4].
3D concrete printing (3DCP) is a promising solution to address the challenge due to a formwork-free and automatic construction process. 3DCP can improve productivity, reduce CO2 emission, and decrease energy consumption in the construction sector [Citation5]. For instance, a 3D printed prefabricated bathroom unit (PBU) reduces 85.9% and 87.1% in CO2 emission and energy consumption, respectively, compared to that of the unit fabricated by conventional mold-cast [Citation6].
Nevertheless, the main limitation of 3DCP is the lack of a compatible method for automatic reinforcement integration. Existing methods to add steel reinforcement in 3DCP require collaborative control in the printing process, leading to the increase of difficulty on system development and integrity [Citation7]. A potential solution to address the limitation is the development of self-reinforced materials for 3DCP. Engineered cementitious composites (ECC) are typical self-reinforced materials, which exhibit excellent tensile strength and tensile strain capacity, ranging from 6 MPa to 16 MPa and 8% to 12% [Citation8], respectively. The superior tensile strain capacity of ECC enables the possibility to construct self-reinforced structural components without steel reinforcement in 3DCP [Citation9]. The typical cases of ECC components and structures are provided in Section 2.1 to emphasise the potential of ECC for the removal of steel reinforcement. Since the production of steel contributes more than 50% to carbon emissions of the construction materials [Citation4], the 3DCP with ECC has the potential to achieve a sustainable construction.
As reviewed in Section 2, a comprehensive investigation is lacking in the literature to understand the environmental performance of large-scale structures printed by 3D printable ECC (3DP-ECC). Existing works of 3DP-ECC are mainly to explore the mechanical properties of structural component in the laboratory [Citation10,Citation11]. Secondly, the existing environmental assessment of 3DCP mainly takes into account the conventional printable concrete, which has different material constituents compared to that of 3DP-ECC, such as binder contents and fibre usage that have significant impact on environmental performance [Citation12]. Therefore, this work aims to evaluate the environmental performance of large-scale structures printed by 3DP-ECC via life cycle assessment (LCA).
The remainder of this paper is organised as follows. Section 2 reviews the existing studies on 3DP-ECC, printed large-scale structures, and environmental assessment of 3DCP. The methodology of LCA is described in Section 3. Sections 4 and 5 present the results of environmental performance. The discussion is presented in Section 6. Finally, conclusions and future works are drawn in Section 7.
2. Related works
This section provides a comprehensive review of existing works on material development of cast and 3D printable ECC, 3D printed large-scale structures, and the relevant works of life cycle assessment on 3DCP. Finally, the research gap is identified, emphasised, and summarised.
2.1. Cast and 3D printable ECC
Many works have been conducted to investigate the fresh and hardened properties of 3D printable engineered cementitious composites (3DP-ECC) by the optimisation of material constituents. The binder materials of ECC typically consist of cement, fly ash, and silica fume, which have a total usage of more than 1000 kg/m3 [Citation13]. By the adjustment of material proportions [Citation9,Citation14,Citation15], chemical additive contents and types [Citation16–19], the fresh performance of ECC is tailored to satisfy the requirement of pumpability and buildability [Citation20]. The University of Michigan successfully printed a 1.5 m high column with 3DP-ECC by the optimisation of fresh properties [Citation17,Citation18]. Ye et al. [Citation19,Citation21,Citation22] used crumb rubber (CR) and incineration bottom ash (IBA) as the substitution of aggregate in 3DP-ECC. The printed CR-ECC and IBA-ECC can achieve a tensile strength of 4.57 and 5.75 MPa, respectively, and strain capacity of 5.71% and 7.54%, respectively. Zhu et al. [Citation16] reported that the 3DP-ECC can exhibit a tensile strain capacity of up to 11.4%.
ECC are a type of polyvinyl alcohol (PVA) or polyethylene (PE) fibre reinforced concrete [Citation23,Citation24], which exhibits a tensile strain capacity of more than 8% [Citation25]. The potential of ECC in the construction without steel reinforcement has been proved by ECC components and structures. Zhu et al. [Citation26] found that the printed ECC beams exhibited ductile failure modes and strain hardening behaviours, which are similar to that of conventional reinforced concrete beams. Ye et al. [Citation27] printed ECC slabs with different types of hollow sections and reported that the ultimate deflection to span ratios of the slabs satisfied the design of serviceability limit state of reinforced concrete structures. ECC have been adopted to construct a 3 m high frame structure with two floors by casting [Citation28]. The results show that the seismic performance of the frame structure fulfils the requirement of standard [Citation29], and the load-bearing capacity of the ECC structural components is comparable to that of the mold-cast counterparts with a steel reinforcement ratio of 0.5%–1.5%. In addition, ECC has been used to fabricated a full-scale ECC arch with a height of 3.075 m and a span of 4.13 m [Citation30]. The statistic loading and impact tests indicated that the load-bearing capacity and impact resistance meet the design requirements of reinforced concrete structures.
In summary, the research studies in the existing literature imply that the ECC has the potential to construct the structural component without steel reinforcement in both cast and 3D printed structures.
2.2. Large-scale structures printed by 3DCP
3DCP can potentially construct structural components for modular integrated construction (MiC) [Citation31], such as modular bridges and house units. The Eindhoven University of Technology constructed a modular bridge by printing each component separately, followed by the post-tensioned steel reinforcement and on-site assembly [Citation32]. The Hebei University of Technology also constructed a modular bridge with a span of 17.94 m [Citation33]. The research team at Nanyang Technological University printed a prefabricated bathroom unit (PBU) with a height of 2.8 m [Citation6]. The PBU can be completed within 12 h, indicating higher productivity than that of the counterpart constructed by conventional cast approach. These engineering practices imply the potential of 3DCP in MiC applications.
2.3. Life cycle assessment of 3DCP
The environmental assessment of 3DCP has been conducted by many researchers. Weng et al. [Citation6] revealed that the PBU fabricated by 3DCP achieved reductions of 85.9% CO2 emission and 87.1% energy consumption compared to that of its precast counterpart. Zhang et al. [Citation34] reported that 3DCP can enhance sustainability due to its low potential for freshwater ecotoxicity, particulate matter formation, human toxicity, ozone depletion, and eutrophication. Liu et al. [Citation35] and Agustí-Juan et al. [Citation36] presented that the environmental benefits of 3DCP were enhanced with the increase of the complexity of buildings. Liu et al. [Citation35], Han et al. [Citation37], and Ding et al. [Citation38,Citation39] found that incorporating recycled aggregate and industrial wastes into 3D printable concrete materials can bring additional benefits to sustainability. For example, the incorporation of geopolymer concrete can reduce carbon emissions by 26.7% and 20.7% compared to that of normal concrete in 3DCP and casting scenarios [Citation35], respectively.
The abovementioned LCA investigations mainly focus on conventional printable concrete, which employs cement as the main binder material with an amount ranging from 400 to 700 kg/m3 [Citation40–42]. However, as mentioned in Section 2.1, the usage of binder materials in 3DP-ECC is over 1000 kg/m3. In addition, PVA or PE fibres are adopted as reinforcement in 3DP-ECC, and the environmental performance of the fibres is different from the steel reinforcement in conventional printable concrete.
2.4 Summary
The existing studies of ECC reveal the possibility of constructing structural components without steel reinforcement. The engineering practices and the relevant LCA of 3DCP highlight the sustainability of 3DCP in the construction sector. However, the LCA is mainly performed based on conventional printable concrete, which has different material constituents compared to that of 3DP-ECC. A comprehensive understanding is lacking on the environmental performance of structures constructed by 3DP-ECC.
To fill the research gap, this study aims to evaluate the environmental performance of printed structures with 3DP-ECC by LCA. At the material level, three types of ECC were selected, including incineration bottom ash (IBA) incorporated IBA-ECC [Citation19], crumb rubber (CR) incorporated CR-ECC [Citation21], and limestone powder (LP) incorporated LP-ECC [Citation43]. At the structural level, a frame unit [Citation28] and a circle house unit [Citation37], were adopted in the LCA. The fabrication of the units includes on-site printing and assembly [Citation44].
3. Methodology
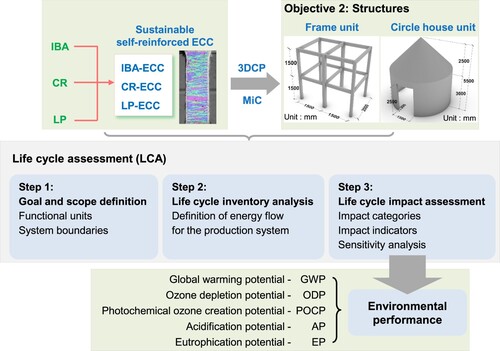
shows the research framework and main steps of this study. Objective 1 is to investigate the environmental performance of 3DP-ECC at the material level. Objective 2 is to evaluate the environmental performance of structures constructed by 3DP-ECC at the structural level. The analysis and evaluation were performed by life cycle assessment (LCA) in accordance with ISO 14040/2006 [Citation45]. shows the main steps of LCA, including goal and scope definition (Section 3.1), life cycle inventory analysis (Section 3.2), and life cycle impact assessment (Section 3.3).
Figure 1. Research framework.
3.1. Goal and scope definition
As shown in , the step 1 defines the scopes of the LCA, which includes the functional units and system boundaries at the material and structural levels. The functional units represent the reference unit for the quantification and comparison of the environmental performance of products. In this work, the functional units are ECC materials per 1 m3 and printed structures per unit in objectives 1 and 2, respectively. The system boundaries refer to the manufacturing processes of the functional units in LCA. Based on the two objectives in , the functional units and system boundaries are defined as follows.
Objective 1: the functional units contain three types of 3DP-ECC and conventional steel reinforced concrete (RC) as the reference group. The existing study reported the benefits of sustainability by incorporating industrial wastes into printable materials [Citation35], and therefore, this study selected three typical ECC with waste materials to achieve a sustainable 3DCP. The ECC are incorporated with incineration bottom ash (IBA-ECC) [Citation19], crumb rubber (CR-ECC) [Citation21], and limestone powder (LP-ECC) [Citation43]. The IBA and CR are used to partially substitute the fine aggregate (40% by volume fraction), and the LP is used to partially substitute the cement (50% by volume fraction). The steel volume ratio of the RC is 1.01% since a previous study reveals that the load-bearing capacity of ECC component is comparable to that of RC component with a longitudinal steel ratio of 1.01% and stirrup reinforcement of Φ6@100 [Citation28]. The steel consumption of the RC is calculated based on the longitudinal steel and stirrups information.
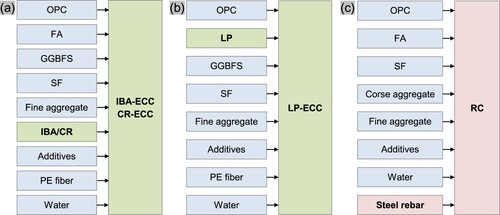
shows the system boundaries of the functional units in objective 1, mainly including the extraction of raw ingredients. The raw ingredients to produce the 3DP-ECC and RC are ordinary Portland cement (OPC), limestone powder (LP), fly ash (FA), ground granulated blast-furnace slag (GGBFS), silica fume (SF), coarse aggregate, fine aggregate, incineration bottom ash (IBA), crumb rubber (CR), additives, water, polyethylene (PE) fibre, and steel rebar.
Figure 2. System boundaries of the functional units of objective 1. (a) IBA-ECC and CR-ECC; (b) LP-ECC; (c) RC.
Objective 2: the functional units include a frame unit [Citation28] and a circle house unit [Citation37]. An existing study demonstrates the feasibility of using ECC to construct the frame unit without reinforcement while satisfying the loading-bearing capacity and seismic requirements of structural design [Citation28]. The frame unit is built with structural components, such as beams and columns without walls. The circle house unit, mainly made of walls, was selected as another function unit. The frame unit and circle house unit both adopted ECC as the main structural components (columns and beams in the frame unit, walls and roof in the circle house unit) for load-bearing. The roof of the circle house unit can be printed based on a platform and assembled with the printed walls on the construction site. It should be noted the existing works lack an experimental investigation on the structural feasibility of the circle house unit, which needs further exploration in the future works. Eight possible scenarios are involved.
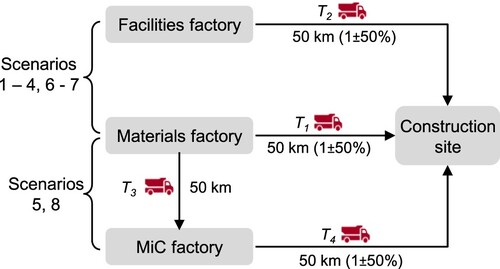
presents the different scenarios. Scenarios 1–3 are to investigate the environmental impacts of using different types of 3DP-ECC to construct the frame unit via 3DCP. Scenario 6 is to evaluate the environmental impacts of using LP-ECC to construct the circle house unit. Scenarios 4–5 and 7–8 are adopted as references. Scenarios 4 and 7 printed a permanent formwork with normal concrete (NC), followed by casting reinforced concrete (RC). The thickness of the formwork is 20% of the cross-section of printed components [Citation35]. Scenarios 5 and 8 adopted the MiC method with conventional mold-cast (MC) to explore its environmental performance.
Table 1. Different scenarios for the construction of frame unit and circle house unit.
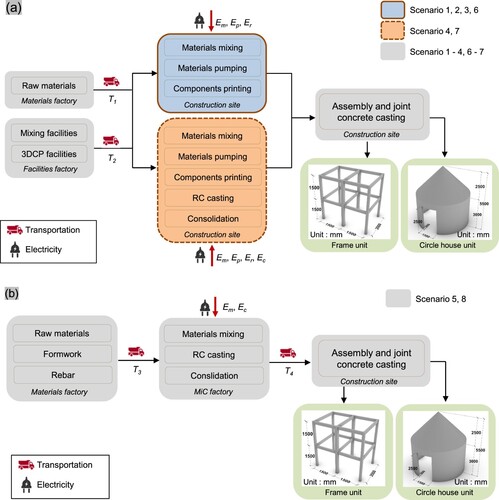
presents the system boundaries of each scenario. The production processes include the extraction of raw materials, transportation of the materials and facilities, material mixing, pumping, printing, and consolidation. The Em, Ep, Er, and Ec refer to the electricity consumption during the mixing, pumping, robot printing, and consolidation, respectively. indicates that T1, T2, T3, and T4 are the transportation distances from factories to the construction site. The calculation of the material usage, electricity consumption, and transportation is elaborated in Section 4.
Figure 3. System boundaries of the functional units of objective 2. (a) Scenarios 1–4 and 6–7; (b) Scenarios 5 and 8.
3.2. Life cycle inventory analysis
A cradle-to-gate approach was used in the inventory analysis, which involved the energy flow in the extraction of raw materials, transportation of the materials, and on-site production processes. Since the production LP includes an incineration process, the environmental impacts of LP are involved in the analysis. According to the system boundaries ( and ), the materials usage and energy consumption induced by electricity and transportation can be obtained. The materials usage was calculated based on the material proportions of ECC and the volumes of printed components. Afterward, the transportation was determined based on the self-weight of the materials and the facilities involved in the production process. The electricity was calculated based on the printing parameters and the volumes of printed components. The inventories of the materials, electricity, and transportation were collected from the Ecoinvent 3.9 database (primary data) and existing papers (secondary data). The data source and assumptions of the calculation are elaborated in Section 4.
3.3. Life cycle impact assessment
Global warming potential (GWP), ozone depletion potential (ODP), photochemical ozone creation potential (POCP), eutrophication potential (EP), and acidification potential (AP) are analysed in the LCA. GWP quantifies the potential of greenhouse gas emissions to contribute to global warming in a carbon dioxide (CO2) equivalent. ODP evaluates the potential of the emissions to deplete the ozone layer in a trichlorofluoromethane (CFC-11) equivalent. POCP assesses the potential of the emissions to the formation of ground-level ozone in an ethene (C2H4) equivalent. EP evaluates the potential for the emissions to cause excessive nutrient enrichment, leading to harmful algal blooms in a sulphur dioxide (SO2) equivalent. AP quantifies the potential for the emissions to cause acidification that damages the ecosystems in a phosphate (PO4) equivalent.
4. Life inventories
4.1. Material data
summarises the consumption by mass of raw materials in 1 m3 of the IBA-ECC, CR-ECC, LP-ECC, and RC. The data of the raw materials was obtained from [Citation19,Citation21,Citation28,Citation35,Citation43], as listed in . At the material level, the inventories of different functional units are mainly from the extraction of the raw materials. The inventories of the raw materials except fly ash (FA) were collected from the Ecoinvent 3.9 database (primary data). The inventories of FA were obtained from [Citation5] (secondary data).
Table 2. Materials consumption by mass of IBA-ECC, CR-ECC, LP-ECC, and RC per 1 m3. (Unit: kg).
lists the data source of all the life inventories of the ECC, frame unit, and circle house unit. At the structural level, timber formwork with a thickness of 18 mm was used in the conventional mold-cast of frame unit and circle house unit. The energy consumption is indicated by the electricity and transportation, as mentioned in the system boundaries (). The inventories of the formwork, electricity, and transportation were obtained from the Ecoinvent 3.9 database (primary data), as listed in .
Table 3. Correspondence between inventories and data source.
4.2. Electricity data
A concrete mixer (80 L Variooo) with a power of 1.1 kW and self-weight of 80 kg was used for the materials mixing. The electricity of mixing (Em) is determined by:
(1)
(1) Vunit (m3) is the volume of the functional units, Wm (kW) is the power of the concrete mixer, ve (m3/h) is the material pumping speed. The pumping speed is 1.5 L/min [Citation19]. The electricity of the consolidation of casted concrete (Ec) is 0.16 kW [Citation34].
A pumping (MAI2PICTOR) with a power of 1.5 kW and a self-weight of 33.5 kg was used for the materials pumping. The electricity of pumping (Ep) is calculated by substituting the Wm in Equation (1) as the power of the pumping machine.
An ABB IRB 2600-20/165 robot (with a maximum reach of 1.65 m) and a KUKA 120 R3900 ultr-K robot (with a maximum reach of 3.9 m) were used for the construction of the frame unit and circle house unit, respectively. The power and self-weight of the ABB robot are 3.4 kW and 272 kg, respectively, and that of the Kuka robot is 18.8 kW and 1,221 kg, respectively. The electricity of the robot (Er) can be calculated by Equation (1) by substituting Wm as the power of the robots.
4.3. Transportation analysis
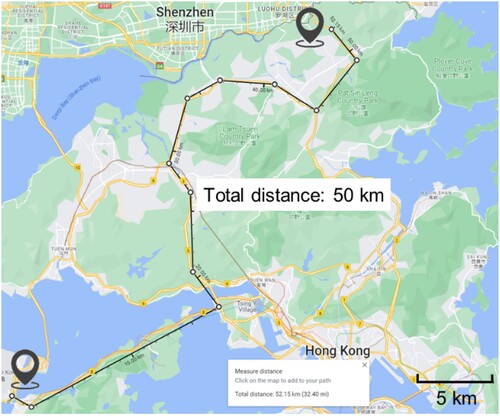
The transportation distance involved in the scenarios (T1–T4) was assumed to be 50 km. As shown in , the distance was identified from Google Maps [Citation46] by measuring the maximum distance along the expressway in Hong Kong. In Scenarios 1–8, the transportation includes the raw materials from the factory to the construction site (T1), facilities from the factory to the construction site (T2), raw materials from the factory to the MiC factory (T3), and casted components from MiC factory to construction site (T4). However, the carbon emission of the transportation was sensitive to the distance variation [Citation47], and therefore, sensitivity analysis on the transportation distance was conducted in Section 6 to explore its impact on environmental performance further. The inventory data of the transportation were obtained from the Ecoinvent 3.9 database (primary data), as shown in .
Figure 4. Transportation distance in Hong Kong.
4.4. Inventories of different functional units
summarises the inventories of Scenarios 1–8. The materials usage and electricity of mixing were calculated with respect to the geometric information of the frame unit [Citation28] and circle house unit [Citation37]. Then, the electricity of concrete printing and casting can be derived based on the material usage and printing parameters. The inventory of transportation was calculated based on the weight of the materials, self-weight of the facilities, and the transportation distance. With these data, the life cycle impact assessment was performed by Simapro 9.1. The results of the environmental impacts of different functional units are interpreted in Sections 5 and 6.
Table 4. Inventories of Scenarios 1–8.
5. Environmental performance
5.1. Materials
summarises the impact indicators of different ECC and RC per 1 m3. The RC exhibits the highest GWP while the LP-ECC has the lowest GWP. The GWP, ODP, POCP, AP, and EP of LP-ECC is 466.83 kg CO2-eq, 1.89E-05 kg CFC-11-eq, 0.061 kg C2H4-eq, 1.366 kg SO2-eq, 0.360 PO4-eq, respectively, which is 47%, 59%, 84%, 56%, and 76% lower than that of RC, respectively. The IBA-ECC and CR-ECC have similar levels of the five impact indicators, since the IBA and CR are used to substitute the fine aggregate with the same volume fraction of 40% [Citation19,Citation21]. The GWP of IBA-ECC and CR-ECC is 660.40 kg CO2-eq and 669.90 kg CO2-eq, respectively, which is 25% and 24% lower than that of RC, respectively, while 41% and 43% higher than that of LP-ECC, respectively.
Table 5. Impact indicators of different ECC and RC (per 1 m3).
compares the impact indicators of different ECC and RC in a relative value. The contribution of steel rebars to the environmental impacts of the RC was removed as the reference. The material was denoted as RC-0. As shown in , the RC-0 exhibits the lowest impact indicators due to the removal of steel reinforcement. The IBA-ECC, CR-ECC, and LP-ECC exhibit lower environmental impacts than that of RC with a steel reinforcement ratio of 1.01%. The reduction in GWP, ODP, POCP, AP, and EP of the ECC can achieve at least 24% (CR-ECC), 49% (IBA-ECC), 83% (IBA-ECC), 49% (IBA-ECC), and 73% (IBA-ECC), respectively, compared to that of the RC. In summary, the results of impact indicators reveal that the fibre reinforcement of ECC is more sustainable than the steel reinforcement of conventional RC.
Figure 5. Impact indicators (relative value) of different ECC and RC (per 1 m3).
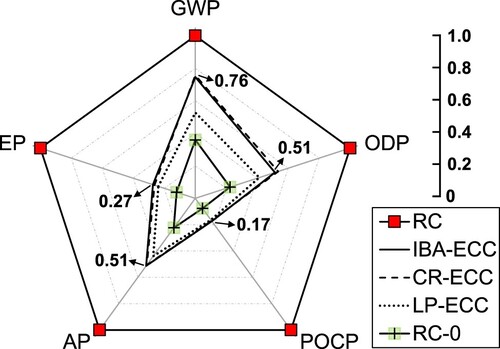
illustrates the contribution of each raw material to the overall environmental impacts of ECC and RC (The detailed data can be found in Table S1–S4). In IBA-ECC and CR-ECC, OPC has the most significant contribution to the overall environmental impacts. Specifically, OPC accounts for 89.7% and 90.5% in the GWP of IBA-ECC and CR-ECC, respectively. With the LP to substitute OPC, the proportion of OPC in the GWP, OCP, POCP, AP, and EP of LP-ECC ((c)) reduces 10.4%, 15.6%, 24.0%, 20.2%, and 21.4%, respectively, compared to that of IBA-ECC ((a)). GGBFS is the second highest contributor to the environmental impacts of LP-ECC, which are 15.6%–35.8% of the overall impact indicators. However, in RC, steel rebar has the highest contribution, and OPC is the second significant contributor to the overall impact indicators ((d)). The proportion of steel reinforcement and OPC in the impact indicators of RC ranges 64.1%–92.4% and 6.3%–34.3%, respectively. As listed in Table S3–S4, the GWP of steel rebar in RC is 567.01 kg CO2 eq, which falls in the reasonable range in the majority of the time [Citation48] and is 1.3 times higher than that of binder materials in LP-ECC. Therefore, the RC has the highest while the RC-0 has the lowest environmental impact compared to that of the ECC.
Figure 6. Breakdown of impact indicators (per 1 m3). (a) IBA-ECC; (b) CR-ECC; (c) LP-ECC; (d) RC.
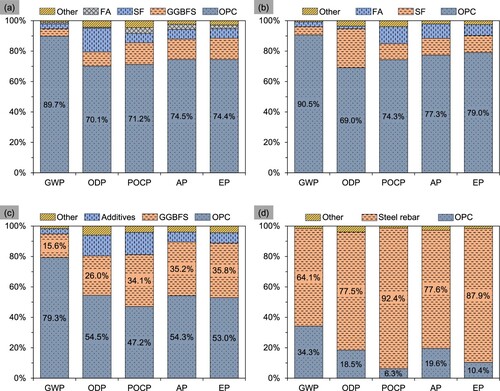
In summary, the breakdown of impact indicators reveals that the OPC and steel rebar are the two main environmental contributors for the ECC and RC. The finding is consistent with the existing study that cement and steel rebar production lead to a high carbon emission [Citation48–50]. Therefore, when the OPC and steel reinforcement are substituted by LP (50% volume fraction) and PE fibre, respectively, the LP-ECC exhibits the lowest GWP ( and ).
The ECC and RC have different mechanical properties, and thus, a comparison of the environmental performance of ECC and RC was conducted by the normalisation of the environmental impacts with mechanical properties. Compressive strength and tensile elongation of steel rebar are the two crucial parameters in the design of structural components. According to previous studies [Citation19,Citation21,Citation35,Citation43], the compressive strength of IBA-ECC, CR-ECC, LP-ECC, and RC is 48.28, 42.27, 131.0, and 40.00 MPa, respectively. The tensile elongation (i.e. tensile strain capacity) of IBA-ECC, CR-ECC, and LP-ECC is 5.4%, 7.5%, and 7.6%, respectively. The requirement for the minimum tensile elongation of steel rebar (9%) is adopted to normalise RC [Citation51].
presents the normalised impact indicators of different ECC and RC in relative values. As shown in (a), since the compressive strength of the ECC is higher than that of RC, the normalised impact indicators per 1 MPa of IBA-ECC, CR-ECC, and LP-ECC are generally lower than that of RC. Specifically, the ECC exhibit at least 28% (CR-ECC), 57% (IBA-ECC), 85% (CR-ECC), 57% (CR-ECC), and 77% (CR-ECC) reduced GWP, ODP, POCP, AP, and EP, respectively, as compared to that of RC at the normalisation of compressive strength.
Figure 7. Impact indicators (relative value) of different ECC and RC (per 1 m3). (a) 1 MPa of compressive strength; (b) 1% of elongation.
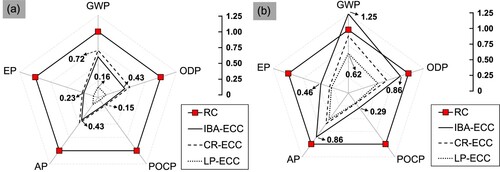
As shown in (b), the ODP, POCP, AP, and EP of the ECC reduce at least 14% (IBA-ECC), 71% (IBA-ECC), 14% (IBA-ECC), and 54% (IBA-ECC), respectively, as compared to that of RC at normalisation of tensile elongation. The GWP per 1% elongation of IBA-ECC is 25% higher than that of RC, since the IBA-ECC has the lowest tensile elongation of 5.4%. In contrast, the normalised impact indicators per 1% elongation of CR-ECC and LP-ECC are lower than that of RC.
In summary, the compressive strength normalised GWP and tensile elongation normalised GWP of LP-ECC are 0.16 and 0.62 times of that of RC with a steel reinforcement ratio of 1.01%, respectively. The LP-ECC has the most sustainable performance in this work.
5.2. Structures – frame unit
presents the impact indicators of Scenarios 1–5 for the construction of the frame unit. The environmental impacts of MC-RC in GWP, ODP, POCP, AP, and EP are 278.70 kg CO2-eq, 1.53E-0.5 kg CFC-11-eq, 0.115 kg C2H4-eq, 0.993 kg SO2-eq, 0.473 kg PO4-eq, respectively. When 3DCP is used to construct the frame unit, the GWP of 3DP-IBA-ECC, 3DP-CR-ECC, 3DP-LP-ECC, and 3DP-RC is 21%, 20%, 42%, and 35%, lower than that of MC-RC, respectively. When ECC are used for the 3DCP of a frame unit, 3DP-IBA-ECC, 3DP-CR-ECC, and 3DP-LP-ECC exhibit 10%, 9%, and 35% reduction of GWP, compared to that of 3DP-RC, respectively. With the LP to partially substitute OPC and no steel reinforcement, the 3DP-LP-ECC has the lowest GWP, which is 160.59 kg CO2-eq.
Table 6. Impact indicators of Scenarios 1–5.
(a) presents the relative value of the impact indicators of different scenarios. The environmental impacts in the scenarios of 3DCP are generally lower than that in the scenario of MC-RC. In summary, 3DP-LP-ECC has the lowest environmental impacts in the five impact indicators. The GWP, ODP, POCP, AP, and EP of 3DP-LP-ECC are 0.58, 0.47, 0.19, 0.31, and 0.51 times lower than that of MC-RC, respectively.
Figure 8. Relative value and breakdown of impact indicators of Scenarios 1–5. (a) Relative value; (b) Scenario 1; (c) Scenario 2; (d) Scenario 3; (e) Scenario 4; (f) Scenario 5.
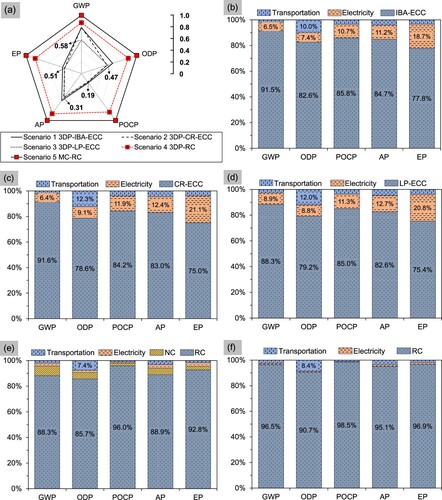
(b–f) shows the breakdown of the overall impact indicators in different scenarios (The detailed data can be found in Table S5–S9). In 3DP-IBA-ECC, 3DP-CR-ECC, and 3DP-LP-ECC, the ECC material and electricity are the main contributors to the overall impact indicators ((b–d)). The contribution of ECC material and electricity is approximate 91% and 6%, respectively, in the GWP of 3DP-IBA-ECC and 3DP-CR-ECC. When LP-ECC is used to print the frame unit ((d)), the contribution of ECC material in the overall GWP reduces to 88.3%, while that of electricity increases to 8.9%. In 3DP-RC and MC-RC, the RC material is the highest contributor to the overall impact indicators ((e and f)), ranging 85.7%–96.0% and 90.7%–98.5%, respectively. Apart from the materials and electricity, transportation is another main contributor to the environmental impacts. As shown in (b–f), the contribution of transportation to the ODP is 10.0%, 12.3%, 12.0%, 7.4%, and 8.4% in Scenarios 1–5, respectively.
In summary, the RC material is the most significant contributor in the conventional MC method since the cement and steel rebar production process could induce considerable environmental impacts [Citation48]. With the fibre reinforcement, the environmental impacts of ECC material are reduced, while the electricity due to the concrete printing process increases the environmental impacts.
5.3. Structures – circle house unit
lists the impact indicators of Scenarios 6–8 for the construction of the circle house unit. Since the 3DP-LP-ECC outperforms 3DP-IBA-ECC and 3DP-CR-ECC in the environmental impacts of the construction of the frame unit. The 3DP-LP-ECC was used in Scenario 6. As seen in , the 3DP-LP-ECC exhibits GWP, ODP, POCP, AP, and EP of 3281.26 kg CO2-eq, 1.45E-04 kg CFC-11-eq, 0.471 kg C2H4-eq, 11.157 kg SO2-eq, and 3.791 kg PO4-eq, respectively, which are 28%, 43%, 75%, 32%, and 51% lower than that of MC-RC, respectively. Additionally, the 3DP-RC shows generally smaller impact indicators than that of MC-RC while higher impact indicators than that of 3DP-LP-ECC. In summary, the variations in environmental performance of Scenarios 6–8 () are similar to that of Scenarios 3–5 ().
Table 7. Impact indicators of Scenarios 6–8.
(a) presents the relative value of the impact indicators of Scenarios 6–8. 3DP-LP-ECC has the lowest environmental impacts. (b–d) shows the breakdown of the overall impact indicators in different scenarios (The detailed data can be found in Table S10–S12). RC material is the most significant contributor to the environmental impacts of 3DP-RC and MC-RC, accounting for 84.9%–94.8% and 88.6%–98.1% ((c and d)), respectively. In contrast, the environmental impacts of 3DP-LP-ECC are mainly contributed by the electricity and ECC material ((b)), ranging 46.9%–70.4% and 28.0%–51.4%, respectively. The decomposition of environmental impacts of Scenarios 6–8 is similar to that of Scenarios 3–5.
Figure 9. Relative value and breakdown of impact indicators of Scenarios 6–8. (a) Relative value; (b) Scenario 6; (c) Scenario 7; (d) Scenario 8.
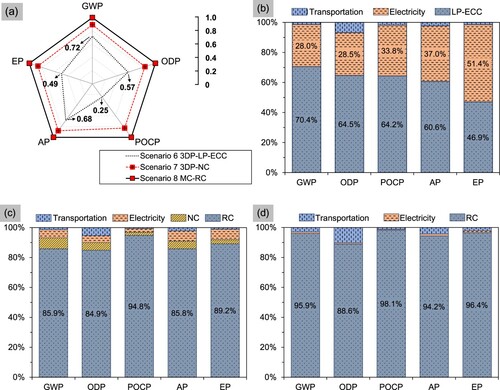
As can be seen from , the material consumption (LP-ECC) of Scenarios 3 and 6 is 607.70 kg and 9898.00 kg, respectively. According to Equation (1), the electricity consumption of mixing and printing is linearly related to the volume of the functional units. With the increase of over 15 times in the material usage, the contribution of electricity to the GWP increases from 8.9% of the 3DP-LP-ECC (frame unit) ((d)) to 28.0% of the 3DP-LP-ECC (circle house unit) ((b)). However, the 3DP-LP-ECC still exhibits better sustainable environmental performance than that of MC-RC.
In summary, the results of the frame unit and circle house unit highlight the potential of 3DCP with LP-ECC to improve the environmental performance in the construction sector. However, with the increase of material usage, the increased electricity consumption underscores the need for the optimisation of the printing process to conserve energy in future research.
6. Sensitive analysis on transportation distance
As investigated in a previous study [Citation47], the transportation of the bulky materials and modular components involved in MiC generally leads to significant carbon emission, which is linearly correlated to the transportation distance, with a sensitivity factor to the distance. The linear relationship can be expressed by RLE = ΣTi × ei, where RLE is the carbon emission produced from the transportation of the components, ei refers to the carbon emission rate of the truck for the transportation [Citation47]. However, in Section 5, the carbon emission of printed structures was assessed based on an identical transportation distance (50 km). Therefore, sensitivity analysis on transportation distance was conducted to investigate its influence on the carbon emission of printed structures and identify the distance range to achieve a sustainable 3DCP.
shows the transportation distance involved in different scenarios. Generally, the materials, facilities, and MiC factories have fixed locations, and thus, the transportation distance mainly changes with the construction site. Specifically, the T1 and T2 in the 3DCP scenarios 1–4 and 6–7, and T4 in MC scenarios 5 and 8 would change with the construction site. Therefore, the analysis was conducted by varying the T1, T2, and T4 from -50% to 50% of the assumed distance of 50 km to obtain the sensitivity to the transportation distance of different scenarios.
Figure 10. Transportation distance involved in different scenarios.
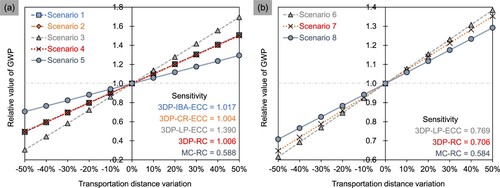
presents the relative value of GWP versus transportation distance of different scenarios. The GWP was selected as the representative environmental performance since climate change is one of the most concerning global issues. The GWP of different scenarios increases with the increase of transportation distance. The sensitivity to transportation distance of each scenario can be indicated as the slope of the curves in [Citation34]. As shown in (a), 3DP-IBA-ECC, 3DP-CR-ECC, and 3DP-RC for the construction of the frame unit show similar sensitivity (1.017, 1.004, and 1.006, respectively). The MC-RC has the lowest sensitivity of 0.588, which is 42%, 41%, 58%, and 42% smaller than that of 3DP-IBA-ECC, 3DP-CR-ECC, 3DP-LP-ECC, and 3DP-RC, respectively. Similar results are observed in [Citation34], which reports that the 3DCP scenarios are more sensitive to transportation distance compared to that of conventional casting scenarios. As shown in (b), the sensitivity of 3DP-LP-ECC and 3DP-RC for the construction of the circle house unit is 0.769 and 0.706, respectively, which is reduced by 45% and 30% compared to that of 3DP-LP-ECC and 3DP-RC, respectively. The results reveal that the increase of material usage (607.70 kg in the frame unit and 9,898.00 kg in the circle house unit) could reduce the sensitivity to transportation distance of 3DCP-LP-ECC.
Figure 11. The sensitivity to transportation distance of different scenarios. (a) Scenarios 1–5; (b) Scenarios 6–8.
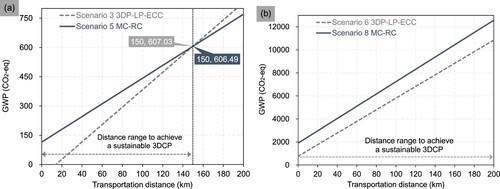
presents the GWP versus transportation distance in different scenarios. A distance range of 0–200 km was selected since it covers the most transportation region in Hong Kong and nearby Guangdong province. MC-RC has a smaller sensitivity than that of 3DP-LP-ECC (), and thus, an intersection point at 150 km is observed in (a). The 3DP-LP-ECC for the construction of the frame unit shows lower GWP than that of MC-RC when the transportation distance is smaller than 150 km. With a reduced sensitivity of 0.769 ((b)), it can be seen from (b) that 3DP-LP-ECC for the construction of the circle house unit exhibits lower GWP than that of MC-RC within the whole distance range of 0–200 km.
Figure 12. Influence of transportation distance on GWP. (a) Scenarios 3 and 5; (b) Scenarios 6 and 8.
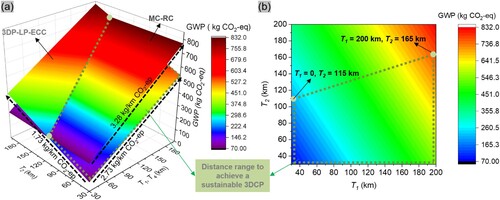
presents the individual influence of transportation distance on the GWP of the frame unit, since the T1 and T2 were assumed to vary identically in the above sensitivity analysis. As shown in (a), the GWP of MC-RC increases with the T4 at a rate of 3.28 kg/km CO2-eq. The increase rate of 3DP-LP-ECC to the T1 and T2 is 2.73 kg/km CO2-eq and 1.73 kg/km CO2-eq, respectively. An intersection line is observed on the GWP surface of 3DP-LP-ECC and MC-RC. Therefore, the distance range to achieve a sustainable 3DCP can be identified, as shown in (b). The results from could provide a guideline for the selection of appropriate construction methods based on transportation distance to achieve carbon reduction in the local construction sector.
Figure 13. Individual influence of transportation distance. (a) 3DP-LP-ECC and MC-RC; (b) 3DP-LP-ECC.
7. Conclusions
This study performed LCA to evaluate the environmental performance of 3DCP with ECC. At the material level, the environmental impacts of IBA-ECC, CR-ECC, and LP-ECC were compared to that of conventional RC. At the structural level, the environmental impacts of structures fabricated by 3DCP with the ECC and MC with the RC were investigated. The main conclusions are as follows:
LP-ECC outperforms IBA-ECC, CR-ECC, and RC in environmental impact indicators. The GWP, ODP, POCP, AP, and EP of LP-ECC are 47%, 59%, 84%, 56%, and 76% lower than that of RC with a steel reinforcement ratio of 1.01%, respectively.
The 3DCP Scenarios 1–4 and 6–7 exhibit reduced environmental impacts compared to that of the MC Scenarios 5 and 8, respectively. Specifically, the GWP of 3DP-LP-ECC to construct the frame unit and circle house unit reduces by 35% and 28%, respectively, compared to that of MC-RC ones.
Sensitivity analysis reveals that 3DP-LP-ECC has lower GWP than that of MC-RC to construct the frame unit when the distance T1 and T2 are smaller than 150 km. In addition, the distance range to achieve a sustainable 3DCP is identified with respect to the individual variation of T1 and T2.
The findings of this study could provide a guideline for the selection of appropriate ECC materials and construction methods to achieve carbon reduction in the local construction sector. However, the comparison of the environmental performance of ECC and RC materials was performed based on a fixed steel ratio, and the end-of-life stages of the structures were excluded in the LCA analysis of this work. In the future, the compressive strength of ECC and different steel ratios of RC should be involved in the LCA analysis to make a comprehensive comparison. The scope of the LCA should be further extended by taking into account the lifecycle of construction and building maintenance.
Supplemental Material
Download MS Word (53.8 KB)Disclosure statement
No potential conflict of interest was reported by the author(s).
Data availability statement
Data available on request from the authors.
Additional information
Funding
References
- CO2 Emissions in 2022. 2022. International Energy Agency. Available from: https://www.iea.org/reports/co2-emissions-in-2022.
- World Energy & Climate Statistics – Yearbook. 2023. Available from: https://yearbook.enerdata.net/total-energy/world-consumption-statistics.html.
- Sustainable Construction. 2023. Construction Industry Council. Available from: https://www.sc.cic.hk/index.php/en.
- 2022 Research Report of China Building Energy Consumption and Carbon Emissions. 2022. China Association of building energy efficiency.
- Chen C, Habert G, Bouzidi Y, et al. LCA allocation procedure used as an incitative method for waste recycling: an application to mineral additions in concrete. Resour Conserv Recycl. 2010;54(12):1231–1240. doi:10.1016/j.resconrec.2010.04.001
- Weng Y, Li M, Ruan S, et al. Comparative economic, environmental and productivity assessment of a concrete bathroom unit fabricated through 3D printing and a precast approach. J Clean Prod. 2020;261:121245. doi:10.1016/j.jclepro.2020.121245
- Teng F, Li M, Zhang D, et al. BIM-enabled collaborative-robots 3D concrete printing to construct MiC with reinforcement. Hong Kong Inst Eng. 2023;30:123–131. doi:10.33430/V30N1THIE-2022-0023
- Ding Y, Yu J, Yu K, et al. Basic mechanical properties of ultra-high ductility cementitious composites: from 40 MPa to 120 MPa. Compos Struct. 2017;185:634–645. doi:10.1016/j.compstruct.2017.11.034
- Soltan DG, VC L. A self-reinforced cementitious composite for building-scale 3D printing. Cem Concr Compos. 2018;90:1–13. doi:10.1016/j.cemconcomp.2018.03.017
- Ye J, Yu K, Yu J, et al. Designing ductile, tough, nacre-inspired concrete member in metric scale. Cem Concr Compos. 2021;118:103987. doi:10.1016/j.cemconcomp.2021.103987
- Zhu B, Pan J, Zhou Z, et al. Mechanical properties of engineered cementitious composites beams fabricated by extrusion-based 3D printing. Eng Struct. 2021;238:112201. doi:10.1016/j.engstruct.2021.112201
- Tinoco MP, de Mendonça ÉM, Fernandez LIC, et al. Life cycle assessment (LCA) and environmental sustainability of cementitious materials for 3D concrete printing: a systematic literature review. J Build Eng. 2022;52:104456. doi:10.1016/j.jobe.2022.104456
- Yu K, Li L, Yu J, et al. Direct tensile properties of engineered cementitious composites: a review. Constr Build Mater. 2017;165:346–362. doi:10.1016/j.conbuildmat.2017.12.124
- Bao Y, Xu M, Soltan D, et al. Three-dimensional printing multifunctional engineered cementitious composites (ECC) for structural elements. RILEM Bookseries. 2018;19:115–128. doi:10.1007/978-3-319-99519-9_11
- Xu N, Qian Y, Yu J, et al. Tensile performance of 3D-printed strain-hardening cementitious composites (SHCC) considering material parameters, nozzle size and printing pattern. Cem Concr Compos. 2022;132:104601. doi:10.1016/j.cemconcomp.2022.104601
- Zhu B, Pan J, Nematollahi B, et al. Development of 3D printable engineered cementitious composites with ultra-high tensile ductility for digital construction. Mater Des. 2019;181:108088. doi:10.1016/j.matdes.2019.108088
- Li VC, Bos FP, Yu K, et al. On the emergence of 3D printable engineered, strain hardening cementitious composites (ECC/SHCC). Cem Concr Res. 2020;132:106038. doi:10.1016/j.cemconres.2020.106038
- Yu K, McGee W, Ng TY, et al. 3D-printable engineered cementitious composites (3DP-ECC): fresh and hardened properties. Cem Concr Res. 2021;143:106388. doi:10.1016/j.cemconres.2021.106388
- Ye J, Teng F, Yu J, et al. Development of 3D printable engineered cementitious composites with incineration bottom ash (IBA) for sustainable and digital construction. J Clean Prod. 2023;422:138639. doi:10.1016/j.jclepro.2023.138639
- Weng Y, Li M, Tan MJ, et al. Design 3D printing cementitious materials via Fuller Thompson theory and Marson-Percy model. Constr Build Mater. 2017;163:600–610. doi:10.1016/j.conbuildmat.2017.12.112
- Ye J, Cui C, Yu J, et al. Effect of polyethylene fiber content on workability and mechanical-anisotropic properties of 3D printed ultra-high ductile concrete. Constr Build Mater. 2021;281:122586. doi:10.1016/j.conbuildmat.2021.122586
- Ye J, Cui C, Yu J, et al. Fresh and anisotropic-mechanical properties of 3D printable ultra-high ductile concrete with crumb rubber. Compos Part B Eng. 2021;211:108639. doi:10.1016/j.compositesb.2021.108639
- Li VC. Engineered cementitious composites (ECC): bendable concrete for sustainable and resilient infrastructure. Berlin: Springer; 2019. doi:10.1007/978-3-662-58438-5
- Ruan S, Qiu J, Yang E, et al. Fiber-reinforced reactive magnesia-based tensile strain-hardening composites. Cem Concr Compos. 2018;89:52–61. doi:10.1016/j.cemconcomp.2018.03.002
- Yu K, Wang Y, Yu J, et al. A strain-hardening cementitious composites with the tensile capacity up to 8%. Constr Build Mater. 2017;137:410–419. doi:10.1016/j.conbuildmat.2017.01.060
- Zhu B, Pan J, Zhou Z, et al. Mechanical properties of engineered cementitious composites beams fabricated by extrusion-based 3D printing. Eng Struct. 2021;238:112201. doi:10.1016/j.engstruct.2021.112201
- Ye J, Zhang J, Yu J, et al. Flexural behaviors of 3D printed lightweight engineered cementitious composites (ECC) slab with hollow sections. Eng Struct. 2024;299:117113. doi:10.1016/j.engstruct.2023.117113
- Yu K, Li L, Yu J, et al. Feasibility of using ultra-high ductility cementitious composites for concrete structures without steel rebar. Eng Struct. 2018;170:11–20. doi:10.1016/j.engstruct.2018.05.037
- Seismic Rehabilitation of Existing Building. (2007). ASCE Stand. doi:10.1201/9781439804810-c7
- Liao Q, Yu J, Huang Y, et al. Study on static and impact resistance performance of ultra-high ductility concrete arch without reinforcement. Build Struct. 2023;53(24):21–28. https://link.cnki.net/doi/10.19701j.jzjg.zj210066.
- Ter Haar B, Kruger J, van Zijl G. Off-site construction with 3D concrete printing. Autom Constr. 2023;152:104906. doi:10.1016/j.autcon.2023.104906
- Salet TAM, Ahmed ZY, Bos FP, et al. Design of a 3D printed concrete bridge by testing. Virtual Phys Prototyp. 2018;13:222–236. doi:10.1080/17452759.2018.1476064
- Ma G, Buswell R, da Silva L, et al. Technology readiness: a global snapshot of 3D concrete printing and the frontiers for development. Cem Concr Res. 2022;156:106774. doi:10.1016/j.cemconres.2022.106774
- Zhang R, Wang L, Xue X, et al. Environmental profile of 3D concrete printing technology in desert areas via life cycle assessment. J Clean Prod. 2023;396:136412. doi:10.1016/j.jclepro.2023.136412
- Liu S, Lu B, Li H, et al. A comparative study on environmental performance of 3D printing and conventional casting of concrete products with industrial wastes. Chemosphere. 2022;298:134310. doi:10.1016/j.chemosphere.2022.134310
- Agustí-Juan I, Müller F, Hack N, et al. Potential benefits of digital fabrication for complex structures: environmental assessment of a robotically fabricated concrete wall. J Clean Prod. 2017;154:330–340. doi:10.1016/j.jclepro.2017.04.002
- Han Y, Yang Z, Ding T, et al. Environmental and economic assessment on 3D printed buildings with recycled concrete. J Clean Prod. 2020;278:123884. doi:10.1016/j.jclepro.2020.123884
- Ding T, Xiao J, Tam VWY. A closed-loop life cycle assessment of recycled aggregate concrete utilization in China. Waste Manag. 2016;56:367–375. doi:10.1016/j.wasman.2016.05.031
- Ding T, Xiao J, Zou S, et al. Flexural properties of 3D printed fiber-reinforced concrete with recycled sand. Constr Build Mater. 2021;288:123077. doi:10.1016/j.conbuildmat.2021.123077
- Alhumayani H, Gomaa M, Soebarto V, et al. Environmental assessment of large-scale 3D printing in construction: a comparative study between cob and concrete. J Clean Prod. 2020;270:122463. doi:10.1016/j.jclepro.2020.122463
- Liu X, Li Q, Wang L, et al. Systematic approach for printability evaluation and mechanical property optimization of spray-based 3D printed mortar. Cem Concr Compos. 2022;133:104688. doi:10.1016/j.cemconcomp.2022.104688
- Ma G, Hu T, Wang F, et al. Magnesium phosphate cement for powder-based 3D concrete printing: Systematic evaluation and optimization of printability and printing quality. Cem Concr Compos. 2023;139:105000. doi:10.1016/j.cemconcomp.2023.105000
- Yu K, Lin M, Tian L, et al. Long-term stable and sustainable high-strength engineered cementitious composite incorporating limestone powder. Structures. 2022;47:530–543. doi:10.1016/j.istruc.2022.10.008
- Khajavi SH, Tetik M, Mohite A, et al. Additive manufacturing in the construction industry: the comparative competitiveness of 3d concrete printing. Appl Sci. 2021;11(9):3865. doi:10.3390/app11093865
- ISO14040. Environmental management: life cycle assessment – principles and framework. Geneva: International Standards Organization; 2006.
- Salama T, Salah A, Moselhi O, et al. Near optimum selection of module configuration for efficient modular construction. Autom Constr. 2017;83:316–329. doi:10.1016/j.autcon.2017.03.008
- Hussein M, Karam A, Eltoukhy AEE, et al. Optimized multimodal logistics planning of modular integrated construction using hybrid multi-agent and metamodeling. Autom Constr. 2023;145:104637. doi:10.1016/j.autcon.2022.104637
- Oh BK, Choi SW, Park HS, et al. Influence of variations in CO2 emission data upon environmental impact of building construction. J Clean Prod. 2016;140:1194–1203. doi:10.1016/j.jclepro.2016.10.041
- Ruan S, Unluer C. Comparative life cycle assessment of reactive MgO and Portland cement production. J Clean Prod. 2016;137:258–273. doi:10.1016/j.jclepro.2016.07.071
- Ruan S, Unluer C. Influence of supplementary cementitious materials on the performance and environmental impacts of reactive magnesia cement concrete. J Clean Prod. 2017;159:62–73. doi:10.1016/j.jclepro.2017.05.044
- SAC (Standardization Administration of China). Code for Seismic Design of Buildings. GB 50011. Beijing: China Architecture and Building Press. 2016.