
ABSTRACT
In the field of tissue engineering, 3D printed shape memory polymers (SMPs) are drawing increased interest. Understanding how these 3D printed SMPs degrade is critical for their use in the clinic, as small changes in material properties can significantly change how they behave after in vivo implantation. Degradation of 3D printed acrylated poly(glycerol-dodecanedioate) (APGD) was examined via in vitro hydrolytic, enzymatic, and in vivo subcutaneous implantation assays. Three APGD manufacturing modalities were assessed to determine differences in degradation. Material extrusion samples showed significantly larger mass and volume loss at 2 months, compared to lasercut and vat photopolymerization samples, under both enzymatic and in vivo degradation. Critically, melt transition temperatures of degraded PGD increased over time in vitro, but not in vivo. Histology of tissue surrounding APGD implants showed no significant signs of inflammation compared to controls, providing a promising outlook for use of 3D printed APGD devices in the clinic.
1. Introduction
Use of minimally invasive procedures and personalised devices has increased demand for 3D printed shape memory polymers (SMPs) [Citation1–4]. These 3D printed materials display elastomeric behaviour with nonlinear elastic and viscoelastic mechanical properties similar to native soft tissue [Citation5–9]. Shape memory behaviour near body temperature allows delivery of 3D printed SMPs, via minimally invasive surgical techniques (MIS), and their subsequent recovery of elastomeric properties and initial shape for treating the target soft tissue pathology after implantation [Citation1]. Additionally, risks associated with permanent implants like tissue erosion and deleterious byproducts, can be reduced through use of 3D printable SMPs that are biodegradable [Citation10,Citation11]. Using biodegradable materials also allows for treatment of younger patient populations without the need for revision surgeries [Citation11]. There are a limited number of 3D printable biodegradable shape memory resins with elastomeric mechanics, but they have deleterious properties that may challenge their clinical translation [Citation12–16]. As such, there is still a need for the development of further 3D printable biodegradable SMPs for the MIS treatment of soft tissue pathologies.
The development of novel 3D printable resins is challenging, especially for use in multiple 3D printing modalities. However, optimising a resin for multiple print modalities does allow for increased options for prototyping and device manufacture. Material extrusion (ME) and vat photopolymerization (VP) are common printing modalities used in tissue engineering research [Citation17]. ME printing allows users a wide range of options with regards to printable materials and their properties, along with the ability to extrude multiple materials within a single print (multi-material printing), multiple materials within a filament (co-material printing), and even bioinks with live cells [Citation18,Citation19]. Conversely, most VP printers are not suitable for multi-material or cell printing, but allow for significant reductions in manufacturing times and an increased scope of complexity in printable structures versus ME printers [Citation20].
ME and VP printing exhibit distinct manufacturing physics, which require users to understand how these processes can change the behaviour of resultant prints in order to choose the best modality to use based on the application at hand. With this in mind, some studies have looked into whether print modality changes the behaviour of resultant prints, but in these studies different materials were used on each printing modality, complicating the determination of whether differences measured originated from the 3D printing process itself or due to use of a different material [Citation21–23]. Acrylated poly(glycerol-dodecanedioate) (APGD) is a biodegradable SMP resin that can be 3D printed on both ME and VP 3D printers without dilution [Citation17,Citation24]. Our prior investigations focused both on characterising the photocuring of our APGD resins and demonstrated significant differences in the void volume, gel content, shear and tensile mechanics, and shape memory behaviour between APGD samples printed on ME and VP printers [Citation17,Citation24]. Interestingly, differences in shape fixity (Rf), shape recovery (Rr), and recovery rate (dRr/dT) were observed between APGD samples printed on ME and VP printers [Citation17]. Changes in the polymer network crosslinking drive these differences which have downstream implications on degradation mechanics. Therefore, given these differences in APGD material properties arising from print modality, significant questions remained regarding how the printing processes affected APGD degradation and whether they impacted APGD biocompatibility.
Biodegradable SMPs are typically designed to take advantage of natural chemical and enzymatic hydrolysis processes in order to produce degradation profiles desired for specific in vivo environments. Direct control over the SMP degradation profile can be achieved through changes in the amount and distribution of hydrolysable bonds within the polymer network [Citation25]. Additional means of controlling SMP degradation include changes in crosslinker chemistry, gross surface chemistry, polymer molecular weight, sample geometry, and sample porosity [Citation2]. Together these variables determine how a given SMP degrades under chemical or enzymatic hydrolysis and whether that is through surface-mediated or bulk degradation. Through testing both chemical and enzymatic hydrolysis in vitro, the ultimate question is whether these assays reasonably replicate the behaviour of a SMP when exposed to in vivo degradation. Determining how a SMP degrades under in vitro and in vivo degradation assays is crucial for its translation to the clinic. It is critical to understand the timeline for a SMP’s degradation in order to better predict its ability to maintain its structural integrity after implantation, dependent on the mechanical requirements imposed by the environment targeted for treatment [Citation1]. Additionally, determining whether in vitro degradation assays reasonably replicate the degradation of the SMP under in vivo degradation helps advance the field of tissue engineering, as the use of accurate in vitro assays may be able to reduce costs, time, and animal numbers associated with preliminary in vivo assessments of biodegradable SMPs.
This work examines printing modality effects on hydrolytic and enzymatic in vitro degradation as well as in vivo degradation in a mouse subcutaneous model for 8 weeks. Specifically, 3D printed APGD samples were characterised via Scanning Electron Microscopy (SEM), Differential Scanning Calorimetry (DSC), Fourier Transform Infrared Spectroscopy (FTIR), Ultra Performance Liquid Chromatography-Mass Spectrometry (UPLC-MS), and Hematoxylin and Eosin (H&E) histological staining. In addition to ME and VP samples, APGD samples were manufactured via laser cutting (LC) as a control group lacking layer-by-layer structures within the 3D printing processes [Citation17]. The goals of this work included identifying key micro and macrostructural differences arising from 3D printing to investigate how these differences impact the degradation rate of APGD in in vitro and in vivo environments, determining the in vivo biocompatibility of APGD using a subcutaneous mouse model, and comparing in vitro versus in vivo degradation assays to determine whether in vitro degradation of APGD provides an accurate representation of APGD degradation in vivo. While groups are beginning to investigate how 3D print parameters effect sample degradation, little work has been done comparing degradation behaviour of a 3D printed resin across multiple print modalities [Citation26,Citation27]. Additionally, this is the first reported assessment of APGD in vivo biocompatibility which is an important step towards the clinical translation of this 3D printable biodegradable SMP . This investigation and the ensuing results are highly significant for developing biodegradable multi-modal 3D printable SMP resins for tissue engineering applications.
2. Materials and methods
2.1. Polymer synthesis
APGD was synthesised as previously described [Citation17,Citation24]. Briefly, PGD pre-polymer was synthesised via a condensation reaction between equimolar parts glycerol (Sigma-Aldrich) and dodecanedioic acid (Sigma-Aldrich). This mixture was stirred at 120°C under nitrogen for 24 h and then placed under vacuum (−28inHg) for 48 h. PGD was acrylated by dissolving the pre-polymer in dichloromethane containing triethylamine (Fisher Scientific), 4-methoxyphenol (Alfa Aesar) and 4-dimethylamino pyridine (Sigma-Aldrich). Acryloyl chloride (Sigma-Aldrich) was added to solution to approximately 0.18 mol/mol hydroxyl groups on the PGD pre-polymer. Acrylation percentage was confirmed via 1H qNMR (Varian Mercury Vx 400), where samples were analysed with 90° pulse-width of 15.5 s and a recycle delay of 25 s. DMPA (Sigma-Aldrich) and BAPO (Sigma-Aldrich) were added as photoinitiators (PI) to allow for sample curing under 365 or 405 nm UV light respectively; 0.5 wt% PI were used to synthesise these resins. 0.5 vol% Tartrazine (FD&C yellow #5, Sigma-Aldrich) was added as a photoabsorbent to APGD resin using the BAPO photoinitiator to reduce off target curing during VP printing.
2.2. Sample manufacture
Control LC samples were produced using a silicone mould and laser cutter. Specifically, 4 mL of melted APGD resin (0.5 wt% DMPA) was pipetted into rectangular silicone moulds (2.5 × 5 cm), where the APGD resin was then exposed to 365 nm UV light (VioletII, MelodySusie). Samples for each assay were then laser cut out of the rectangular APGD sheets [Citation24]. ME samples were printed using an Inkredible Plus 3D printer (CellInk) with UV lights (VioletII, MelodySusie, 365 nm) attached to the printer. Samples were printed with APGD resin (0.5 wt% DMPA) using a 250 µm diameter nozzle via a metallic printhead (Musashi). STL files were uploaded to the printer’s slicing software (Cellink HeartWare 2.4.1, Cellink) and were sliced with 100% infill. Samples were exposed to 365 nm UV light throughout the 3D printing process to ensure each layer fully cured prior to additional material deposition. Typical print parameters include printhead temperature of 40°C, pressure of 500kPa, print speed of 20 mm s−1, and light intensity of 27.5 mW cm−2 [Citation17,Citation28]. VP samples were printed using a Lumen X (Cellink) bioprinter. APGD resin was initially melted at 50°C and subsequently heated on the Lumen X print bed at 37°C throughout the print process. APGD resin (0.5 wt% BAPO, 0.5 vol% tartrazine) was used for printing on the Lumen X given the printer’s UV source provides 405 nm light. Tartrazine was used in this resin as a photoabsorbent to reduce off target curing. Samples were printed with 10s/layer exposure time and 67% projector power level (35 mW cm−2) [Citation17]. Histology control samples were printed using PLGA (Sigma Aldrich, 430471) and PCL (Polysciences, 25090) on a 3D Bioplotter system (EnvisionTEC). PCL powder was cryogenically milled and sieved prior to printing. For their respective prints, PLGA and PCL materials were loaded into high temperature printing heads with a 400 µm diameter nozzle size. PLGA and PCL were melted at 150°C and 120°C respectively and extruded for 3D printing with a pressure of 900kPa. All APGD samples in this study were post-processed via thermal curing in a vacuum oven at 120°C and 30inHg for 24h.
2.3. In Vitro degradation
Hydrolytic degradation was performed with samples (6 × 2 mm, n = 6) submerged in 500 µL of PBS with 0.1 mM NaOH at 37°C [Citation24]. Enzymatic degradation was performed with samples (6 × 2 mm, n = 6) submerged in 500 µL of porcine cholesterol esterase (4U/mL in PBS) [Citation29]. Media for both hydrolytic and enzymatic degradation assays was refreshed every 4 days. Samples were removed at designated time points and were then dried at 90°C for 1 h. Samples were massed and scanned via µCT after drying to determine mass and volume loss. Samples were then sterilised with 70% EtOH, cleaned with sterile PBS, and then re-wet with media for continued data collection for each timepoint.
2.4. In Vivo degradation
Samples (6 × 2 mm, n = 9–10 for both 1 and 2 month timepoints) were subjected to in vivo degradation via implantation in a subcutaneous mouse model. All animals were C57BL/6J (Jackson Labs) male mice at 5 weeks of age at the time of surgery. A mid-longitudinal skin incision approximately 1 cm in length was made on the dorsal surface of each mouse and 2 subcutaneous pockets were formed on either side of the animal by blunt dissection. A single implant was placed into each pocket with up to 4 implants per animal. Implants were recovered at 1 and 2 month timepoints and were washed in 5% bleach for 10 min. Samples were dried at 90°C overnight prior to analysis.
2.5. SEM imaging
Samples were imaged using a Generation 5 Phenom ProX SEM (ThermoFisher Scientific). Sample scanning was performed at 15 kV, low vacuum (60 Pa), best acquisition (3840 × 2400), and best live capture (1440 × 900). Images were captured at 600x magnification. At least 3 regions were imaged for every sample and representative images were provided in these figures.
2.6. µCT analysis
Samples (6 × 2 mm, n = 4–6) were scanned on a µCT50 (Scanco Medical) system using 32 µm voxel size and 200 ms integration time. Voltage and current were set to 55 kVp and 145 µA respectively. Sample and void volume were assessed using the native µCT50 evaluation software (v6.1, Scanco Medical).
2.7. DSC analysis
DSC was conducted using a DSC 250 (TA Instruments). Samples (n = 3) were heated from 20°C to 90°C (20°C/min). Samples were held at 90°C for 3 min. Samples were cooled from 90°C to −50°C (10°C/min) and were held at −50°C for 3 min. Samples were then heated to 70°C (10°C/min). Sample Tm and ΔHfusion were calculated using the Trios software (TA Instruments) peak integration (enthalpy) function.
2.8. FTIR spectroscopy
FTIR was performed on a Nicolet iS5 with iD7 ATR (ThermoFisher Scientific) running 8 scans, a resolution of 4, and no correction. Accompanying OMNIC software was used for data analysis and SpectraGryph (v1.2) software was used to perform baseline corrections.
2.9. Histology
Samples (8 × 2 mm, 1 × 1 mm pores, n = 3) were collected at 1 and 2 month timepoints and were fixed in 10% NBF (Sigma-Aldrich) for 2 days. Images of sample gross morphology were taken using a Dino-Lite digital microscope (DinoCapture 2.0, Dino-Lite). After fixation, samples were embedded in OCT compound (ThermoFisher Scientific) and frozen for cryosectioning. H&E staining was performed on sectioned samples using a H&E staining kit (Abcam, ab245880) and following the procedures outlined therein. Stained sections were imaged using a Zeiss AxioObserver Z1 microscope (Zeiss).
2.10. UPLC-MS analysis
Supernatant from APGD in vitro degradation assays were collected at 1 week, 1, and 2 month timepoints. The samples were diluted to 75%v/v methanol, centrifuged, and transferred to liquid chromatography vials. A pooled sample was constructed from equal sample aliquots and used for quality control purposes. UPLC-MS data was acquired using a Vanquish Horizon (ThermoFisher Scientific) chromatograph, fitted with a Waters Corporation BEH C18 column (2.1 × 100 mm, 1.7 µm particle size), and coupled to a high-resolution accurate mass Q-Exactive HF Orbitrap mass spectrometer (ThermoFisher Scientific). The mobile phases were water (mobile phase A) and 10:90 acetonitrile:isopropyl alcohol (mobile phase B) containing 0.1% v/v formic acid and 10 mM ammonium formate. The chromatographic method used the following gradient programme: 0 min 94% A; 1 min 95% A; 9 min 0% A; 10.8 min 0% A; 11 min 94% A; and held until 12 min. The flow rate was set at 0.40 ml/min. The column temperature was set to 60°C, and the injection volume was 2 µL. The mass spectrometer acquired data by polarity switching with a scan range of 120–1200 m/z at 120 K resolution. Data-dependent acquisition (DDA) MS2 experiments were performed on the pooled sample.
The raw files were processed with Compound Discoverer version 3.3.1.111 for peak detection. Data reduction was performed by removing features with retention time less than 1 min, peak area less than 5x background, or peak area with a relative standard deviation (RSD) greater than 30% in the quality controls. HCD MS/MS peak elemental composition identification was performed using Xcalibur software.
2.11. Statistical analysis
One and two-way ANOVA with Tukey’s post hoc tests were performed on Graphpad Prism 9, where p values < 0.05 were considered statistically significant. Significance of UPLC-MS results determined by hierarchical cluster analysis using Compound Discoverer version 3.3.1.111, where p values < 0.05 were considered statistically significant.
3. Results
3.1. SEM imaging
APGD samples were imaged via SEM to assess the qualitative effects of in vitro (hydrolytic and enzymatic) and in vivo degradation on the surface of the samples (). Additional explanation of these degradation mechanics are described in the supplemental material (Fig. S1). Assessing the in vitro hydrolytic degradation samples, there were no signs of degradation at the one week (1W) timepoint compared to the 0 d (0D) controls (). However, by two weeks (2W) numerous pits had formed on the surface of the samples that could be seen on the APGD at 1 and 2 months as well. The holes on the VP samples appear smaller than those on the LC and ME samples, but overall, the effects of hydrolytic degradation appeared similar across the three groups assessed.
Figure 1. Representative SEM images of APGD samples subjected to hydrolytic degradation. Scale bar = 200 µm.
Figure 2. Representative SEM images of APGD samples subjected to enzymatic degradation. Scale bar = 200 µm.
Figure 3. Representative SEM images of APGD samples after implantation in a subcutaneous mouse model. Scale bar = 200 µm.
Under enzymatic degradation, signs of APGD deterioration began at the 1w timepoint (). The presence of enzymatic activity caused notable damage to the surface of the samples with the formation of cracks and pits across the entirety of sample surfaces. Manufacturing modality did not appear to cause any qualitative differences in the damage dealt to the surfaces of the APGD samples due to enzymatic activity.
APGD samples were implanted in a subcutaneous mouse model. SEM images were taken at 1 and 2 month timepoints to assess the effects of the in vivo exposure to the APGD samples surfaces (). By one month (1M), the effects of in vivo degradation were visible on the surfaces of all samples imaged and by 2 months (2M) those effects were definitively clear. Interestingly these samples appear somewhat different as a function of manufacture modality, which was not the case with the in vitro assays. The LC samples showed the least amount of surface damage, although there are trails of damage on the surface, likely due to cellular activity. VP sample surfaces looked rougher and more similar to the enzymatic degradation samples, although there are signs of pitting likely due to cellular attachment and degradation. The ME samples showed the clearest signs of degradation due to cell activity. At 1M the pitting appears focused in the pores left in the surface of the sample from the extrusion printing process. By 2M pitting completely covers the surface of the ME samples. While the hydrolytic assay samples showed pitting as well, those pits were highly homogeneous in size and surface distribution. In contrast, these pits are heterogeneous in size and densely packed over the surface of the samples.
3.2. Mass loss and µCT analysis
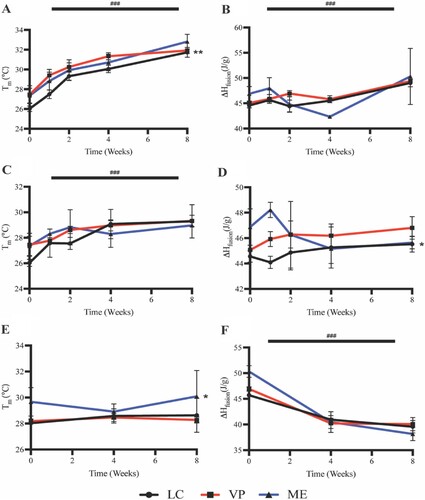
Over the 2 month hydrolytic degradation assay, all APGD samples measured significant mass loss due to time ((A), p < 0.0001). Manufacturing modality did play a role in the hydrolytic degradation of the 3D printed APGD samples, as LC samples measured significantly reduced mass loss over the 2 months compared to both the VP and ME groups (p < 0.01). At 2M, the LC, VP, and ME samples had mass remaining measurements of 94.3 ± 0.8, 91.8 ± 2.0, and 90.8 ± 2.1% respectively.
Figure 4. APGD mass and volume loss over 2 month (A/B) hydrolytic, (C/D) enzymatic, and (E/F) in vivo degradation assays. Data are expressed as mean ± SD ((A/B) n = 4–6, **p < 0.01 vs. VP and ME across all timepoints, (C/D) n = 4–6, ***p < 0.0001 vs. LC and VP across all timepoints, (E/F) n = 9–10, *p < 0.05 for all groups across all timepoints, **p < 0.01 for all groups across all timepoints, ###p < 0.0001 for all groups vs. time). Significance was assessed via Two-way ANOVA with Tukey’s post test.
Similar to what was seen with the mass loss data, APGD samples measured significant volume loss over the course of the 2 month hydrolytic degradation assay ((B), p < 0.0001). Manufacturing modality affected APGD volume loss as LC samples showed significantly lower volume loss compared to both VP and ME groups across all timepoints (p < 0.01). At 2M the LC, VP, and ME groups measured 93.3 ± 0.9, 91.0 ± 1.4, and 91.1 ± 5.9% volume remaining respectively. While APGD samples measured significant losses in volume over time, hydrolytic degradation over 2 months did not cause significant changes in sample void volume. However, ME samples did measure significantly higher void volume versus LC samples over all timepoints (Fig. S2A, p < 0.01). Void volume for LC, VP, and ME samples at 2M were 0.4 ± 0.4, 1.2 ± 1.7, and 2.0 ± 1.7% respectively.
Over the 2 month enzymatic degradation assay, all APGD samples measured significant mass loss over time ((C), p < 0.0001). Manufacturing modality did play a role in the enzymatic degradation of the 3D printed APGD samples, as ME samples measured significantly increased mass loss over the 2 months compared to both the LC and VP groups (p < 0.0001). At 2M the LC, VP, and ME samples had mass remaining measurements of 82.3 ± 1.1, 80.9 ± 0.9, and 72.8 ± 6.2% respectively.
In addition to significant mass loss over the 2 month enzymatic degradation, APGD samples measured significant volume loss as well ((D), p < 0.0001). Manufacturing modality affected APGD volume loss as ME samples showed significantly higher volume loss compared to both LC and VP groups across all timepoints (p < 0.0001). At 2M the LC, VP, and ME groups measured 80.3 ± 0.8, 79.6 ± 1.0, and 71.2 ± 5.5% volume remaining respectively. Enzymatic degradation also caused significant increases in void volume across all APGD samples over the 2 month assay (Fig. S2B, p < 0.0001). Similar to the hydrolytic degradation assay, ME samples measured significantly higher void volume versus LC and VP samples over all timepoints (Fig. S2B, p < 0.0001). Void volume for LC, VP, and ME samples at 2M were 3.0 ± 1.4, 3.5 ± 0.7, and 6.9 ± 1.3% respectively.
In vivo exposure caused significant mass loss in all APGD samples over the course of the 2 month implantation ((E), p < 0.0001). Manufacturing modality played a particularly significant role in the in vivo degradation of APGD as all of the groups showed significantly different amounts of mass loss over the course of the 2 month implantation. Lowest to highest mass loss was measured for LC, VP, and ME samples respectively, where at 2M those groups measured mass remaining of 83.8 ± 1.1, 80.2 ± 1.4, and 68.8 ± 6.3% respectively ((E)).
Over the course of the 2 month implantation, all APGD samples showed significant volume loss as a function of time ((F), p < 0.0001). Manufacturing modality affected APGD volume loss in a similar manner as mass loss, with all APGD samples showing significant differences ((F), p < 0.01). LC, VP, and ME samples measured the lowest to highest volume loss, and at the 2M timepoint these groups measured volume remaining of 84.0 ± 1.1, 81.1 ± 1.4, and 68.9 ± 6.0% respectively. Despite the significant volume loss, in vivo exposure did not cause significant changes in void volume over the course of the 2 month implantation. As was the case with the in vitro assessments of void volume, ME samples showed significantly higher void volume compared to LC and VP samples (Fig. S2C, p < 0.0001). Void volume for LC, VP, and ME samples at 2M were 0.1 ± 0.1, 0.1 ± 0.1, and 6.0 ± 4.3% respectively. Representative μCT scans of APGD samples under all modes of degradation are shown in the supplemental material (Fig. S3–5).
3.3. DSC analysis
Due to the effects of hydrolytic degradation, all APGD samples measured significant increases in melt transition temperature (Tm) over the 2 month degradation assay ((A), p < 0.0001). Prior to degradation LC, VP, and ME samples measured Tms of 26.0 ± 0.3, 27.5 ± 0.9, and 27.4 ± 0.8°C respectively, whereas at 2 months of degradation those samples measured Tms of 31.7 ± 0.5, 31.9 ± 0.3, and 32.8 ± 0.8°C respectively. LC samples showed significantly lower Tms over the course of the degradation assay compared to both VP and ME samples ((A), p < 0.01). APGD sample enthalpy of fusion (ΔHfusion) also increased significantly over the course of the hydrolytic degradation assay ((B), p < 0.0001). While ΔHfusion for all APGD groups increased over time, there were no significant differences in ΔHfusion across the APGD groups due to manufacturing modality.
Figure 5. APGD Tm and ΔHfusion over 2 month (A/B) hydrolytic, (C/D) enzymatic, and (E/F) in vivo degradation assays. Data are expressed as mean ± SD ((A/B) n = 3, **p < 0.01 for LC vs. VP and ME across all timepoints, (C/D) n = 3, *p < 0.05 for LC vs. VP and ME across all timepoints, (E/F) n = 3, *p < 0.05 for ME vs. LC and VP across all timepoints, ###p < 0.0001 for all groups vs. time). Significance was assessed via Two-way ANOVA with Tukey’s post test.
Due to the effects of enzymatic degradation, all APGD samples measured significant increases in Tm over the course of the 2 month degradation assay ((C), p < 0.0001). Prior to degradation LC, VP, and ME samples measured Tms of 26.0 ± 0.3, 27.5 ± 0.9, and 27.4 ± 0.8°C respectively, whereas at 2 months of degradation those samples measured Tms of 29.3 ± 1.3, 29.3 ± 0.5, and 29.0 ± 0.03°C respectively. There were no significant differences between APGD Tms due to manufacturing modality. APGD ΔHfusion did not change significantly due to time over the course of the degradation assay, although manufacturing modality did affect APGD samples as LC samples showed a significantly lower ΔHfusion compared to VP and ME samples across all timepoints ((D), p < 0.05).
Unlike the in vitro assays, APGD samples showed no significant changes in Tm over the course of the 2 month in vivo implantation ((E)). Prior to degradation LC, VP, and ME samples measured Tms of 28.0 ± 0.2, 28.2 ± 0.2, and 29.7 ± 1.1°C respectively, whereas at 2 months of degradation those samples measured Tms of 28.6 ± 1.3, 28.3 ± 0.2, and 30.1 ± 2.0°C respectively. While there were no significant differences in Tm over time, ME samples did show significantly higher Tm compared to LC and VP samples over the course of the in vivo implantation ((E), p < 0.05). While the ME samples showed significantly higher Tm compared to the LC and VP samples, there were no significant differences in APGD ΔHfusion due to manufacturing modality ((F)). However, APGD ΔHfusion did significantly decrease over the 2 month implantation for all groups ((F), p < 0.0001).
3.4. FTIR spectroscopy
APGD samples showed changes in multiple chemical functional groups due to in vitro hydrolytic, enzymatic, and in vivo degradation (). Note, manufacturing modality did not cause significant differences between FTIR spectra measured for APGD samples under any of the 3 degradation regimes. As such, all spectra in are spectra taken from representative VP samples; enhanced spectra of data shown in can be seen in Fig. S6 in the supplemental material. Remaining spectra from LC and ME samples can be viewed in supplemental figure S7 Under hydrolytic degradation the OH stretch peaks becomes more pronounced over time ((A), i), suggesting the production of degradation byproducts with alcohol groups. The carbonyl peak shows signs of disruption along with the formation of additional peaks within the CO ester stretch region, suggesting hydrolytic degradation is affecting these functional groups within the APGD polymer ((A), ii and iii).
Figure 6. FTIR spectrograms of representative VP samples under (A) hydrolytic, (B) enzymatic, and (C) in vivo degradation assays. (A) i: OH stretch, ii: carbonyl stretch, iii: CO ester stretch, (B) i: OH stretch (carboxylic acid) ii: carbonyl stretch, iii: COH bend, iv: CO ester stretch, v: OH bend (C) i: OH stretch, ii: amine stretch, iii: carbonyl stretch, iv: amide stretch peaks.
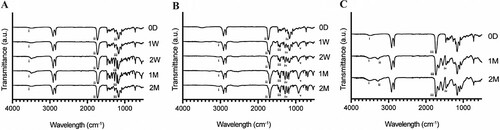
Under enzymatic degradation there was no development of OH stretch peaks around 3500 cm−1 like those noted under hydrolytic degradation. Instead, subtle OH peaks specific to the presence of carboxylic acids appeared overlapped in part by the C–H stretch near 3000 cm−1 ((B), i). The carbonyl peaks showed signs of disruption, with these peaks shifting towards a lower wavelength over the time course from 0D to 2M ((B), ii). Following the disruption of the carbonyl peaks, the presence of COH bends appear by the 1w timepoint, further suggesting carboxylic acid groups are being formed likely as a function of APGD backbone degradation ((B), iii). Similar to the hydrolytic degradation assay, there is also notable disruption in the ester stretch region, with the single peak measured at 0d breaking down into multiple distinct peaks over time ((B), iv). The last strong peak, appearing near 900 cm−1 by the 1W timepoint, is due to an OH bend typical of carboxylic acids ((B), v).
Like the in vitro hydrolytic degradation, the OH peak becomes more pronounced at the 1M timepoint after in vivo implantation, although it appears to weaken by 2M ((C), i). Additionally, there is notable disruption in the carbonyl peak, which was seen in both in vitro degradation assays as well ((C), iii). Taken together these peaks and their changes show clear signs of APGD degradation due to in vivo exposure. Two groups not previously seen include the peaks associated with amine and amide stretches, which likely derive from the organic component recovered after in vivo exposure, given that APGD does not contain nitrogen natively ((C), ii and iv).
3.5. Ultra performance liquid chromatography-mass spectrometry
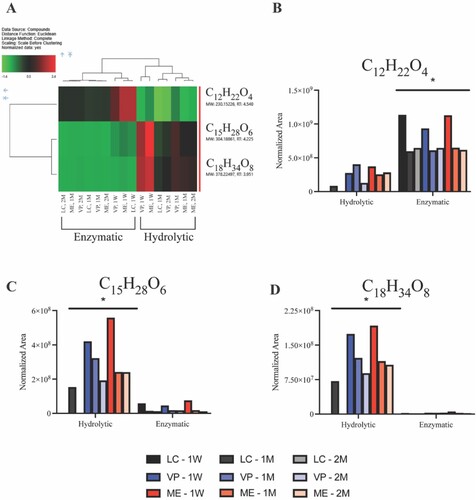
UPLC-MS analysis of APGD in vitro degradation supernatant show significant differences between hydrolytic and enzymatic degradation on a molecular level (, A). From this assay, the three most abundant features’ neutral monoisotopic masses were calculated to be 230.15226, 304.18861, and 378.22497 Da. Further elemental composition, when considering a mass tolerance <2 ppm, resulted in a single predicted composition for each feature, C12H22O4, C15H28O6, and C18H34O8, respectively. The top 3 features were further characterised by higher-energy collisional dissociation (HCD) MS/MS experiments. The C12H22O4 MS/MS spectra matches reference MS/MS for dodecanedioic acid, while the C15H28O6 and C18H34O8 MS/MS spectra report neutral losses of C3H6O2 that correspond to mono-glycerol dodecanedioate and di-glycerol dodecanedioate hydrolysis products, respectively (Fig. S8). Normalised peak areas, in (B–D), demonstrate non-specific degradation under hydrolytic conditions due to presence of dodecanedioic acid, mono-glycerol dodecanedioate, and di-glycerol dodecanedioate, while enzymatic degradation predominately liberated dodecanedioic acid.
Figure 7. Mass spectrometry data of recovered supernatant from APGD in vitro degradation assays showing the presence of 3 major analytes measured across all APGD samples. (A) Heat map showing a normalised concentration measurement of the 3 major analytes in each sample relative to all samples tested. Green and red indicate smaller and larger relative concentrations of each analyte respectively (brackets indicate p < 0.05). Graphs of the raw normalised area data for (B) C12H22O4, (C) C15H28O6, and (D) C18H34O8 measured in all APGD samples. Significance was assessed via hierarchical cluster analysis (*p < 0.05 for all hydrolytic vs. enzymatic samples).
3.6. APGD gross morphology and histology
APGD samples were explanted from subcutaneous mouse models at 1 and 2 month timepoints (). Additional information on manufactured histology samples is provided in figure S9. Native subcutaneous tissue readily encapsulated and grew into APGD sample pores. Blood vessels grew into and around APGD samples showing signs of healthy tissue growth and material tolerance. Qualitatively this tissue was relatively translucent and soft to the touch, potentially indicating the development of tissue similar to the native subcutaneous tissue surrounding the skin and muscle of the mouse. PCL and PLGA samples were included with the histology samples as negative and positive controls for inflammation, respectively. PCL samples showed minimal signs of degradation over the 2 months in vivo with no signs of inflammation. Like the APGD samples, the tissue surrounding the PCL samples appeared clear and was soft to the touch.
Figure 8. Representative photographs of APGD explants collected from subcutaneous mouse models at 1 and 2 month timepoints. Black arrows label blood vessels and red arrows label inflammatory fibrous encapsulation.
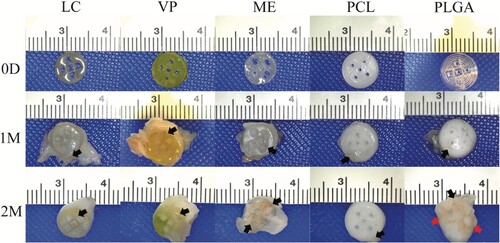
Conversely, PLGA samples showed significant signs of degradation over the 2 months in vivo. By one month, PLGA samples began warping, where the pores for tissue ingrowth became occluded by the PLGA itself. One PLGA sample showed signs of tissue necrosis on the edge of the sample. At 2 months, samples showed signs of fibrous encapsulation, potentially indicative of a significant inflammatory response. This tissue was opaque and, compared to the tissue surrounding the APGD and PCL samples, stiff to the touch. PLGA samples were also completely warped and no longer resembled their initial design.
Using H&E staining, histology samples from the 2M timepoint were assessed qualitatively for signs of inflammation due to the presence of the implanted materials (). APGD samples showed similar results across all manufacture modalities with a large number of cells close to the implanted material, but no apparent signs of a significant deleterious inflammatory response. The tissue recovered from the LC sample could not be identified directly next to the implanted APGD sample. Instead, this tissue was sectioned just above the APGD sample and shows signs of healthy cell activity, muscle tissue, and blood vessel formation all near the APGD sample. For VP and ME sections, APGD material was identifiable directly next to the sectioned tissue. The asterisk symbols in the VP sample image denote the APGD material's presence before the sectioning and staining process. Surrounding the VP sample are a large number of cells with no sign of fibrous encapsulation. The ME sample also had a significant amount of APGD directly bordering the sectioned tissue with no fibrous encapsulation in the regions touching the ME sample. Importantly, some APGD material survived the sectioning and staining process denoted by black arrows. Here, subcutaneous tissue has surrounded and penetrated the APGD material, a necessary step to degrade the APGD and establish new tissue growth.
Figure 9. Representative images of 2M histology samples with H&E staining. * denotes the location of clearly identifiable implant material that did not survive the sectioning and/or staining process. Black arrows label the location of APGD material that survived the sectioning and staining process. Red arrows highlight inflammatory fibrous encapsulation. Scale bar = 50 µm.
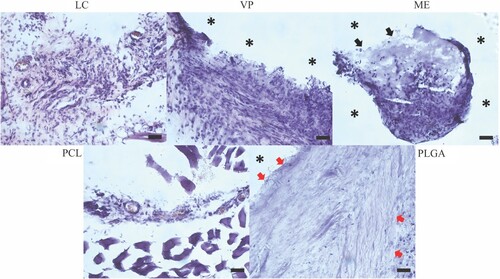
PCL and PLGA are known to have very different degradation rates, with PCL degrading over the course of months to years and PLGA degrading over weeks to months [Citation30–34]. Additionally, use of PCL in vivo is known to cause low levels of inflammation, while PLGA can incur higher levels of inflammation [Citation30,Citation35,Citation36]. For these reasons, the use of PCL and PLGA samples help to provide context for the degradation rate and inflammatory response of our APGD samples after in vivo implantation. Like the LC sample, tissue recovered from the PCL sample was not able to be identified directly next to the implanted control. Tissue was sectioned just above the PCL sample and appeared healthy with lower cell density and healthy blood vessel formation. Conversely, PLGA samples showed clear signs of deleterious inflammation. These sections were identified to have a direct border with the PLGA sample, as denoted by the asterisk symbol in the image, and a significant fibrous region was created by cells in direct contact with the PLGA sample. The width of this fibrotic region is denoted by the red arrows in the PLGA image and while the thickness of this region changes around the perimeter of the PLGA sample, it is present at all points directly in contact with the PLGA sample. The PLGA samples were the only samples in the study to demonstrate this significant fibrotic tissue response. An additional image of the fibrotic region surrounding the PLGA sample is provided in supplemental figure S10.
4. Discussion
The main goals of this work were to determine whether manufacturing modality significantly altered the degradation process of APGD and whether APGD is biocompatible in vivo. Different APGD manufacturing modalities were assessed as future use cases for APGD may favour using either VP or ME 3D printing specifically. Previous work with 3D printed APGD clearly shows that manufacturing modality affects many material properties of the resultant APGD samples including their void volume, gel content, shear and tensile mechanics, and shape memory behaviour [Citation17]. Given that in this previous work, ME samples showed lower crosslink density than other APGD groups, it was expected that ME samples would exhibit more degradation compared to the LC and VP groups both in vitro and in vivo [Citation17]. ME samples also exhibited larger levels of void volume, which could allow for easier fluid penetration into the samples resulting in increased degradation. Looking at in vitro hydrolytic degradation, ME samples did show the most mass loss over the 2 month assay. Specifically, the mass and volume loss of the VP and ME groups were not significantly different, but both 3D printed groups measured significantly more mass and volume loss versus the LC controls ((A)). LC controls, which are made via laser cutting, do not have the layering effect or natural voids imparted by the 3D printing process making them less susceptible to infiltration by water compared to 3D printed samples [Citation37–39]. Assessing both enzymatic and in vivo degradation, ME samples showed significantly higher levels of mass and volume loss in both assays ((B,C)). Given that these ME samples have been shown to have lower crosslink density compared to LC and VP samples, it is not surprising to see that they were more susceptible to mass and volume loss mediated by enzymatic degradation [Citation17]. Sample void volumes were also different due to manufacture modality, where ME samples showed significantly higher amounts of void volume compared to LC and DLP samples across all tested degradation assays (Fig. S2). While the void volume measurements provide limited conclusions into the effects of the different degradation assays, they do show that ME samples consistently measure larger amounts of void volume versus their LC and DLP counterparts which is consistent with data measured in previous work [Citation17].
Manufacturing modality does appear to have limited effects on APGD thermal properties, likely due to the impact it has on the degradation of the APGD samples. Assessing the Tm of APGD samples under hydrolytic degradation, the LC samples measured significantly lower Tms over the course of the assay ((A)); conversely, ME samples measured significantly higher Tm under in vivo degradation ((C)). The LC and ME samples measured the lowest and highest degradation in these assays respectively, likely causing these significant shifts in Tm. There were no significant differences in Tm due to manufacturing modality under enzymatic degradation, despite the ME samples showing significantly higher amounts of degradation ((B)). Overall, these impacts of manufacture modality on the thermal properties of APGD appear to be more indirect effects of the manufacture modality on APGD degradation leading to differences in sample Tms during the degradation process. Manufacture modality showed no signs of affecting the chemistry of the APGD samples as FTIR spectra across all degradation assays showed the same functional peaks at all time points within their respective assays ().
Another major part of this work was the determination of the in vivo biocompatibility of APGD. APGD histology samples were implanted along with PCL and PLGA controls provide context for the degradation rate and inflammatory response of the APGD materials in vivo; PCL is typically a slow degrading polymer that produces minimal inflammation in vivo, while the acidic degradation products of PLGA have been noted to cause in vivo inflammatory responses in part due to a faster degradation profile [Citation30–36]. An immediate qualitative assessment of the explanted APGD samples, as shown in , demonstrated that the PLGA controls exhibited a tissue response that differed from the APGD and PCL samples. Tissue surrounding PLGA samples at 2M was opaque and stiff compared to the transparent and soft tissue covering APGD and PCL samples. Initial explant observations were corroborated by H&E staining (). In the stained section, there were no indications that the in vivo foreign body response to APGD differed due to manufacturing modality. For all APGD samples there were large numbers of cells found near implanted APGD samples. While H&E staining cannot definitively identify specific cells, it appears that there are multi-lobed cells throughout the tissue samples next to APGD, which could be indicative of neutrophil recruitment to the site of implantation [Citation40,Citation41]. Additionally, clumped cells could indicate the presence of macrophages or multinucleated foreign body giant cells at the APGD-tissue interface that would help facilitate APGD degradation [Citation42,Citation43]. Clumps of cells can be seen in particular in the ME sample, where cells appear to be penetrating the APGD material to potentially degrade the implant and allow new tissue to grow in their wake.
This lack of inflammation surrounding the APGD samples correlates with mass spectrometry results recovered from the in vitro degradation assays. Enzymatic degradation led to the breakdown of APGD primarily into dodecanedioic acid (C12H22O4), while hydrolytic degradation of APGD produced more mono and di-glycerol dodecanedioate (C15H28O6 and C18H34O8 respectively, ). These data help to explain the differences noted between the FTIR spectra of APGD under hydrolytic and enzymatic degradation, where these spectra appeared to measure more alcohol and carboxylic acid groups respectively. The spectra measured of APGD under enzymatic degradation in particular shows peaks that line up nicely with the National Institute of Standards and Technology’s (NIST) spectra of dodecanedioic acid [Citation44]. Differences between enzymatic and hydrolytic degradation features are likely due to the time course of the degradation itself, with the smaller dodecanedioic acid present in higher amounts during enzymatic degradation versus the larger mono and di-glycerol dodecanedioate features measured with the slower hydrolytic degradation process. Importantly, HCD MS/MS experiments showed all of these features largely break down into dodecanedioic acid (Fig. S8A and S8B, iii) and glycerol (Fig. S8C, i), the constituent monomers of the PGD backbone. PGD was originally conceived in part due to these monomers being naturally occurring in the human body and involved in healthy cell processes, so if APGD is largely breaking down into these constituents, it follows there would be minimal inflammation in response to the presence of the APGD and its degradation products [Citation45,Citation46].
This response is in stark contrast to what was seen with the PLGA samples, where the PLGA was isolated from the tissue via a significant fibrous tissue layer. This region of the tissue retained few individual cells and individual fibrils of protein, likely collagen, can be seen on the right side of the image closer to the subcutaneous tissue and further away from the sample where the fibrotic region becomes denser. This fibrotic tissue response appears similar to those seen in literature, including histology involving copolymers using PLGA [Citation41,Citation47]. If a material elicits a foreign body response, that does not prohibit said material from being used in the clinic. However, the foreign body response can lead to scar tissue formation around implanted materials, which in turn is a major cause of device failure and for extraction surgery [Citation48]. Given that the APGD samples showed no signs of a foreign body response, it appears that APGD implants show promising in vivo biocompatibility and may be capable of facilitating tissue growth under a normal wound healing regimen. These results are both novel and significant, given these are the first reports of APGD in vivo biocompatibility and the results suggest APGD has significant clinical potential for the treatment of soft tissue pathologies.
While determining differences in APGD degradation due to manufacturing modality and the in vivo biocompatibility of APGD were the main focuses of this work, these data also allow for the discussion of whether in vitro degradation assays could reasonably approximate the effects of in vivo degradation for APGD. Comparing the in vitro versus in vivo degradation assays, the one important similarity across all the assays is that APGD degraded via surface-mediated pathways. Surface-mediated degradation was evident given the close ties between APGD sample mass and volume loss, regardless of manufacture modality. Specifically, there was a maximum 2% difference between APGD mass and volume remaining at 2M across all degradation assays, comparing mass and volume remaining data within manufacturing modality, with most groups exhibiting <1% difference between their mass and volume remaining measurements. The correlation of mass to volume loss, especially when mass and volume loss show a linear trend over time, is a key indicator of surface-mediated degradation, which can be seen in all samples in this study () [Citation1,Citation2]. This behaviour of APGD surface-mediated degradation was expected given that surface-mediated degradation was measured with thermally cured PGD and APGD thin films [Citation24,Citation49]. APGD samples showing surface-mediated degradation are important for the translation of 3D printable APGD given that materials degrading via bulk degradation can have unpredictable degradation processes leading to catastrophic failure of devices due to rapid changes in their mechanics after implantation [Citation2,Citation24,Citation49]. Ultimately, while all degradation assays showed surface-mediated degradation, their effects on the APGD samples were not equivalent. Looking at mass and volume loss at the 2 month timepoint, the enzymatic degradation assay was the in vitro assay that more closely resembled the in vivo degradation process. Specifically, hydrolytic degradation left APGD samples with mass and volume remaining measurements in the low 90% range, whereas both the enzymatic and in vivo assays led to samples yielding much lower mass and volume remaining measurements; the enzymatic degradation assay showed mass remaining measurements of 82.3 ± 1.1, 80.9 ± 0.9, and 72.8 ± 6.2% and volume remaining measurements of 80.3 ± 0.8, 79.6 ± 1.0, and 71.2 ± 5.5% for LC, VP, and ME samples respectively. In vivo degradation showed mass remaining measurements of 83.8 ± 1.1, 80.2 ± 1.4, and 68.8 ± 6.3% and volume remaining measurements of 84.0 ± 1.1, 81.1 ± 1.4, and 68.9 ± 6.0% for LC, VP, and ME samples respectively. Given the largest difference between the two assays, within the same manufacturing modality group, for both mass and volume remaining measurements was about 4% it appears that the in vitro enzymatic degradation assay can provide predictive information on the degradation of in vivo samples out to 2 months in a subcutaneous environment. Further testing will be required to determine whether this enzymatic assay accurately predicts mass and volume loss for placement in environments other than subcutaneous tissue. In particular, cardiovascular applications with exposure to increased flow conditions may lead to reduced degradation compared to an enzymatic degradation assay performed under static culture, given that polymeric scaffolds with acidic degradation products have been shown to have reduced degradation under flow conditions in conjunction with reduced autocatalysis of the degradation reaction via acidic degradation byproducts [Citation50,Citation51]. While APGD has not been tested in the cardiovascular environment, the degradation behaviour of thermally cured PGD has been assessed in a Yorkshire pig pulmonary artery model taken out to 3 months in vivo [Citation52]. Smooth PGD implants showed 75% mass remaining and 40% volume remaining at the 3-month timepoint. The most analogous group in this work, compared to those in the pulmonary artery study, are the LC samples. The LC samples measured a similar rate of mass loss, assuming linear mass loss would continue after 2 months, with roughly 84% mass remaining at 2M. However, the volume loss of the pulmonary artery samples was much faster than that of the LC samples, with 84% mass remaining at 2M. VP samples behaved similarly to the LC samples, with roughly 80 and 81% mass and volume remaining respectively, at 2M, while ME samples degraded faster than either group with roughly 69% mass and volume remaining at 2M. Whether these APGD samples would retain similar behaviour in the pulmonary model based on the behaviour of the thermally cured PGD is unclear given differences between material chemistry, environmental conditions, and sample geometry. Further testing will also need to be performed to determine whether the accuracy of the enzymatic assay continues beyond a 2-month time period, although previous testing of thermally cured PGD, which behaves similarly to APGD, showed similar linear mass loss out to 4 months in a subcutaneous mouse model [Citation49].
It is important to note that while the enzymatic assay appears to have predictive capabilities for in vivo mass and volume loss, the APGD samples under in vitro degradation showed different thermal properties as a result of the degradation processes compared to their in vivo counterparts. Measuring the change in Tm was of particular importance for this work, as these APGD samples need to maintain a Tm below body temperature (∼37°C) so that they remain in a soft nonlinear elastic state to match the mechanics of the surrounding soft tissue after implantation. Both hydrolytic and enzymatic in vitro degradation led to significant increases in APGD Tms, whereas in vivo APGD samples showed no significant changes in Tm ().
Importantly neither the hydrolytic nor the enzymatic degradation assays caused APGD samples to exhibit Tm above 37°C; at 2 months samples in the hydrolytic degradation assay measured Tms of 31.7 ± 0.5, 31.9 ± 0.3, and 32.8 ± 0.8°C and samples in the enzymatic degradation assay measured 29.3 ± 1.3, 29.3 ± 0.5, and 29.0 ± 0.03°C for LC, VP, ME groups respectively. Given that the untreated degradation controls at day 0 measured Tms of 26.0 ± 0.3, 27.5 ± 0.9, and 27.4 ± 0.8°C for LC, VP, and ME groups, respectively, it was interesting to see that the effect size of the Tm increase was larger due to hydrolytic versus enzymatic degradation. The explanation for this difference appears to be in part due to changes in APGD relative crystallinity and may explain why samples subjected to in vivo degradation did not measure changes in Tm. Specifically, APGD samples under hydrolytic degradation showed significant increases in ΔHfusion signifying that there were significant increases in APGD relative crystallinity ((A)). APGD samples subject to enzymatic degradation showed no significant change in ΔHfusion suggesting no change in APGD relative crystallinity ((B)). In vivo samples showed significant reductions in ΔHfusion implying a significant reduction in APGD relative crystallinity ((C)). Given that a polymer’s Tm is dependent on its crystallinity, where polymers of higher crystallinity will yield larger Tms due to the increased energetic stability of the polymer network, it follows that APGD samples with increasing or decreasing crystallinity would measure rising and falling Tms respectively [Citation53–55]. The hydrolytic degradation assay PBS reagent was likely only strong enough to degrade amorphous regions of the APGD, leading to an increase in sample relative crystallinity and Tm. Interestingly, the enzymatic assay showing no change in ΔHfusion suggests that the cholesterol esterase used in the assay was able to degrade both amorphous and crystalline regions at near equivalent rates such that there was no net change in APGD relative crystallinity. Despite no change to APGD relative crystallinity, APGD Tm still rose significantly perhaps indicating the enzyme was able to moderately disrupt APGD thermal crosslinks. While the 3D printing process utilises acrylate photochemistry to cure APGD samples, thermal post-processing was performed on these samples which creates thermal crosslinks. These thermal crosslinks are susceptible to enzymatic and cell-mediated attack and when disrupted lead PGD materials to experience an increase in Tm [Citation52]. This could also explain the results measured for the in vivo APGD samples, where a competitive interaction between the destruction of APGD crystalline regions, which should reduce the sample Tm, and disruption of APGD thermal crosslinks, which would increase sample Tm, net to no significant change in Tm over the course of the in vivo degradation process. The in vivo environment is more complex and harsher on samples which are exposed to a range of enzymes, hydrolytic degradation, robust mass transport systems that affect enzyme activity and degradation product removal, and oxidation from immune cells which can help explain differences measured between the Tms and ΔHfusions of APGD samples recovered from in vitro and in vivo assays [Citation54,Citation56,Citation57].
5. Conclusion
The degradation processes of many biodegradable SMPs are often left unstudied or not contextualised with relation to how those SMPs would behave in vivo. Through this work, we demonstrate two in vitro degradation assays, via hydrolytic and enzymatic degradation modes, and an in vivo degradation assay via implantation in a subcutaneous mouse model. The use of different APGD manufacturing modalities was tested to determine whether samples produced via different methods yield different degradation responses. Overall, ME samples measured the largest mass and volume loss amounts across the different degradation assays. This may be due to lowered crosslink density in these samples, as a result of the 3D printing setup being used, or due to increased void volume ME samples exhibit [Citation17]. This could be rectified using a different type of ME printing setup or modifying this particular printer to have a more concentrated UV light source near the resin as it is being extruded. This work also describes the first assessment of APGD in vivo biocompatibility, performed using a subcutaneous mouse model. Critically, samples showed no signs of a significant inflammatory response at either 1 or 2 months in vivo compared to the PCL negative control. This is likely due in part to the degradation of the APGD samples into their naturally occurring and non-cytotoxic monomer constituents, dodecanedioic acid and glycerol, as measured via mass spectrometry. Conversely, PLGA positive controls did show significant signs of inflammation via foreign body response at the 2 month timepoint. One final aspect of this work was the examination of APGD in vitro versus in vivo degradation, and whether the in vitro assays tested could reasonably predict the degradation behaviour of APGD samples in low flow in vivo environments out to 2 months. Throughout all 3 degradation assays, APGD samples showed surface-mediated degradation, which is preferred for clinical applications given that surface-mediated degradation progresses more predictable than bulk degradation. The results of the enzymatic degradation assay suggest that this in vitro test can reasonably predict the mass and volume loss of APGD samples in low flow in vivo environments out to 2 months. A critical finding of this work was that APGD samples implanted in vivo did not show any significant changes in their Tm over the 2 month implantation period. This is crucial as APGD materials in vivo require a stable Tm that does not increase over time to avoid the implant transitioning to stiff plastic behaviour, which would starkly contrast with the nonlinear elastic behaviour of the surrounding native soft tissue. Given that 3D printed APGD did not show a deleterious in vivo inflammatory response, exhibited surface-mediated degradation, and measured no change in Tm in vivo, these results are very exciting for the clinical translation of 3D printed APGD for use in the treatment of soft tissue pathologies via minimally invasive procedures.
Supplemental Material
Download MS Word (28.1 MB)Acknowledgements
We would like to acknowledge the efforts of Dr. Jeonghun Park in 3D printing PCL and PLGA control samples used in the in vivo tests shown in this work. This work was supported by the Georgia Institute of Technology’s Systems Mass Spectrometry Core Facility.
Disclosure statement
No potential conflict of interest was reported by the author(s).
Data availability statement
The data that support the findings of this study are available from the corresponding author, RA, upon reasonable request.
Additional information
Funding
References
- Ramaraju H, Akman RE, Safranski DL, et al. Designing biodegradable shape memory polymers for tissue repair. Adv Funct Mater. 2020;30:2002014. doi:10.1002/adfm.202002014
- Balk M, Behl M, Wischke C, et al. Recent advances in degradable lactide-based shape-memory polymers. Adv Drug Deliv Rev. 2016;107:136–152. doi:10.1016/j.addr.2016.05.012
- Ng WL, Lee JM, Zhou M, et al. Vat polymerization-based bioprinting—process, materials, applications and regulatory challenges. Biofabrication. 2020;12:022001. doi:10.1088/1758-5090/ab6034
- Zhang J, Hu Q, Wang S, et al. Digital light processing based three-dimensional printing for medical applications. Int J Bioprint. 2020;6:12–27. doi:10.18063/ijb.v6i1.242
- Zopf DA, Flanagan CL, Nasser HB, et al. Biomechanical evaluation of human and porcine Auricular cartilage. Laryngoscope. 2015;125:E262–E268.
- Szczesny SE, Peloquin JM, Cortes DH, et al. Biaxial tensile testing and constitutive modeling of human supraspinatus tendon. J Biomech Eng. 2012;134:021004-1–021004-9. doi:10.1115/1.4005852/450914
- Morales-Orcajo E, Souza TR, Bayod J, et al. Non-linear finite element model to assess the effect of tendon forces on the foot-ankle complex. Med Eng Phys. 2017;49:71–78. doi:10.1016/j.medengphy.2017.07.010
- Abraham AC, Moyer JT, Villegas DF, et al. Hyperelastic properties of human meniscal attachments. J Biomech. 2011;44:413–418. doi:10.1016/j.jbiomech.2010.10.001
- Chang B, Reighard C, Flanagan C, et al. Evaluation of human nasal cartilage nonlinear and rate dependent mechanical properties. J Biomech. 2020;100:109549. doi:10.1016/j.jbiomech.2019.109549
- Drummond J, Tran P, Fary C. Metal-on-metal hip arthroplasty: a review of adverse reactions and patient management. J Funct Biomater. 2015;6:486. doi:10.3390/jfb6030486
- Morrison RJ, Hollister SJ, Niedner MF, et al. Mitigation of tracheobronchomalacia with 3D-printed personalized medical devices in pediatric patients. Sci Transl Med. 2015;7:285ra64. doi:10.1126/scitranslmed.3010825
- Miao S, Zhu W, Castro NJ, et al. 4D printing smart biomedical scaffolds with novel soybean oil epoxidized acrylate. Sci Rep. 2016;6:1–10. doi:10.1038/s41598-016-0001-8
- Wan X, Wei H, Zhang F, et al. 3D printing of shape memory poly(d,l-lactide-co-trimethylene carbonate) by direct ink writing for shape-changing structures. J Appl Polym Sci. 2019;136:48177. doi:10.1002/app.48177
- Hung KC, Tseng CS, Dai LG, et al. Water-based polyurethane 3D printed scaffolds with controlled release function for customized cartilage tissue engineering. Biomaterials. 2016;83:156–168. doi:10.1016/j.biomaterials.2016.01.019
- Zhang S, Shi X, Miao Z, et al. 3D-printed polyurethane tissue-engineering scaffold with hierarchical microcellular foam structure and antibacterial properties. Adv Eng Mater. 2022;24:2101134. doi:10.1002/adem.202101134
- Gokyer S, Yilgor E, Yilgor I, et al. 3D printed biodegradable polyurethaneurea elastomer recapitulates skeletal muscle structure and function. ACS Biomater Sci Eng. 2021;7:5189–5205. doi:10.1021/acsbiomaterials.1c00703
- Akman R, Ramaraju H, Verga A, et al. Multimodal 3D printing of biodegradable shape memory elastomer resins for patient specific soft tissue repair. Appl Mater Today. 2022;29:101666. doi:10.1016/j.apmt.2022.101666
- Skylar-Scott MA, Mueller J, Visser CW, et al. Voxelated soft matter via multimaterial multinozzle 3D printing. Nature; 2019;575(7782):330–335. doi:10.1038/s41586-019-1736-8
- Van Belleghem S, Torres L, Jr, Santoro M, et al. Hybrid 3D printing of synthetic and cell-laden bioinks for shape retaining soft tissue grafts. Adv Funct Mater. 2020;30:1907145. doi:10.1002/adfm.201907145
- Guzzi EA, Tibbitt MW, Guzzi EA, et al. Additive manufacturing of precision biomaterials. Adv Mater. 2020;32:1901994. doi:10.1002/adma.201901994
- Kluska E, Gruda P, Majca-Nowak N. The accuracy and the printing resolution comparison of different 3D printing technologies. Trans Aerosp Res. 2018;2018:69–86. doi:10.2478/tar-2018-0023
- Simoneti DM, Pereira-Cenci T, dos Santos MBF. Comparison of material properties and biofilm formation in interim single crowns obtained by 3D printing and conventional methods. J Prosthet Dent. 2022;127:168–172. doi:10.1016/j.prosdent.2020.06.026
- Tan WS, Suwarno SR, An J, et al. Comparison of solid, liquid and powder forms of 3D printing techniques in membrane spacer fabrication. J Memb Sci. 2017;537:283–296. doi:10.1016/j.memsci.2017.05.037
- Akman R, Ramaraju H, Hollister SJ. Development of photocrosslinked poly(glycerol dodecanedioate)—a biodegradable shape memory polymer for 3D-printed tissue engineering applications. Adv Eng Mater. 2021;23:2100219. doi:10.1002/adem.202100219
- Lendlein A, Neuenschwandel P, Suter UW. Tissue-compatible multiblock copolymers for medical applications, controllable in degradation rate and mechanical properties. Macromol Chem Phys. 1998;199:2785–2796.
- Ferreira J, Gloria A, Cometa S, et al. Effect of in vitro enzymatic degradation on 3D printed poly(ϵ-caprolactone) scaffolds: morphological, chemical and mechanical properties. J Appl Biomater Funct Mater. 2017;15:185.
- Moetazedian A, Gleadall A, Han X, et al. Mechanical performance of 3D printed polylactide during degradation. Addit Manuf. 2021;38:101764.
- Grimes DR, Robbins C, O’Hare NJ. Dose modeling in ultraviolet phototherapy. Med Phys. 2010;37:5251–5257. doi:10.1118/1.3484093
- Santerre JP, Labow RS, doi:10.1002/(SICI)1097-4636(199708)36:2
- Lam CXF, Hutmacher DW, Schantz JT, et al. Evaluation of polycaprolactone scaffold degradation for 6 months in vitro and in vivo. J Biomed Mater Res A. 2009;90A:906–919. doi:10.1002/jbm.a.32052
- Sun H, Mei L, Song C, et al. The in vivo degradation, absorption and excretion of PCL-based implant. Biomaterials. 2006;27:1735–1740. doi:10.1016/j.biomaterials.2005.09.019
- Pitt GG, Gratzl MM, Kimmel GL, et al. Aliphatic polyesters II. The degradation of poly (DL-lactide), poly (ϵ-caprolactone), and their copolymers in vivo. Biomaterials. 1981;2:215–220. doi:10.1016/0142-9612(81)90060-0
- Lu L, Garcia CA, Mikos AG. In vitro degradation of thin poly(DL-lactic-co-glycolic acid) films. J Biomed Mater Res. 1999;46:236–244.
- Guo T, Holzberg TR, Lim CG, et al. 3D printing PLGA: a quantitative examination of the effects of polymer composition and printing parameters on print resolution. Biofabrication. 2017;9:024101. doi:10.1088/1758-5090/aa6370
- Lih E, Park W, Park KW, et al. A Bioinspired scaffold with anti-inflammatory magnesium hydroxide and decellularized extracellular matrix for renal tissue regeneration. ACS Cent Sci. 2019;5:458–467. doi:10.1021/acscentsci.8b00812
- Martins C, Sousa F, Araújo F, et al. Functionalizing PLGA and PLGA derivatives for drug delivery and tissue regeneration applications. Adv Healthc Mater. 2018;7:1701035. doi:10.1002/adhm.201701035
- Costa ML, Rezende MC, de Almeida SFM. Effect of void content on the moisture absorption in polymeric composites. Polym-Plast Technol Eng. 2007;45:691–698. doi:10.1080/03602550600609549
- Celestine ADN, Agrawal V, Runnels B. Experimental and numerical investigation into mechanical degradation of polymers. Compos B Eng. 2020;201:108369. doi:10.1016/j.compositesb.2020.108369
- Castro López C, Lefebvre X, Brusselle-Dupend N, et al. Effect of porosity and hydrostatic pressure on water absorption in a semicrystalline fluoropolymer. J Mater Sci. 2016;51:3750–3761. doi:10.1007/s10853-015-9692-7
- Wang J, MacKenzie JD, Ramachandran R, et al. Identifying neutrophils in H&E staining histology tissue images. Med Image Comput Comput Assist Interv. 2014;17:73–80.
- Carnicer-Lombarte A, Chen ST, Malliaras GG, et al. Foreign body reaction to implanted biomaterials and its impact in nerve neuroprosthetics. Front Bioeng Biotechnol. 2021;9:271. doi:10.3389/fbioe.2021.622524
- Anderson JM, Rodriguez A, Chang DT. Foreign body reaction to biomaterials. Semin Immunol. 2008;20:86–100. doi:10.1016/j.smim.2007.11.004
- Hernandez JL, Park J, Yao S, et al. Effect of tissue microenvironment on fibrous capsule formation to biomaterial-coated implants. Biomaterials. 2021;273:120806. doi:10.1016/j.biomaterials.2021.120806
- Linstrom P, Christian P. NIST standard reference database number 69. https://webbook.nist.gov/chemistry/.
- Shet MS, Fisher CW, Holmans PL, et al. The omega-hydroxylation of lauric acid: oxidation of 12-hydroxylauric acid to dodecanedioic acid by a purified recombinant fusion protein containing P450 4A1 and NADPH–P450 reductase. Arch Biochem Biophys. 1996;330:199–208. doi:10.1006/abbi.1996.0243
- Migneco F, Huang YC, Birla RK, et al. Poly(glycerol-dodecanoate), a biodegradable polyester for medical devices and tissue engineering scaffolds. Biomaterials. 2009;30:6479–6484. doi:10.1016/j.biomaterials.2009.08.021
- Saleh LS, Amer LD, Thompson BJ, et al. Mapping macrophage polarization and origin during the progression of the foreign body response to a poly(ethylene glycol) hydrogel implant. Adv Healthc Mater. 2022;11:1–32. doi:10.1002/ADHM.202102209
- Noskovicova N, Hinz B, Pakshir P. Implant fibrosis and the underappreciated role of myofibroblasts in the foreign body reaction. Cells. 2021;10:1–26. doi:10.3390/CELLS10071794
- Ramaraju H, Solorio LD, Bocks ML, et al. Degradation properties of a biodegradable shape memory elastomer, poly(glycerol dodecanoate), for soft tissue repair. PLoS One. 2020;15:e0229112.
- Zvicer J, Medic A, Veljovic D, et al. Biomimetic characterization reveals enhancement of hydroxyapatite formation by fluid flow in gellan gum and bioactive glass composite scaffolds. Polym Test. 2019;76:464–472. doi:10.1016/j.polymertesting.2019.04.004
- Agrawal CM, McKinney JS, Lanctot D, et al. Effects of fluid flow on the in vitro degradation kinetics of biodegradable scaffolds for tissue engineering. Biomaterials. 2000;21:2443–2452. doi:10.1016/S0142-9612(00)00112-5
- Ramaraju H, Massarella D, Wong C, et al. Percutaneous delivery and degradation of a shape memory elastomer poly(glycerol dodecanedioate) in porcine pulmonary arteries. Biomaterials. 2023;293:1–14. doi:10.1016/J.BIOMATERIALS.2022.121950
- Martino R. Modern Plastic Encyclopedia, 1989.
- Woodard LN, Grunlan MA. Hydrolytic degradation and erosion of polyester biomaterials. ACS Macro Lett. 2018;7:976–982. doi:10.1021/acsmacrolett.8b00424
- Ma Z, Wu Y, Wang J, et al. In vitro and in vivo degradation behavior of poly(trimethylene carbonate-co-d,l-lactic acid) copolymer. Regen Biomater. 2017;4:207. doi:10.1093/rb/rbx003
- Williams D. Corrosion and degradation of implant materials, 2009, 61–75.
- Santerre JP, Labow RS, Duguay DG, et al. Biodegradation evaluation of polyether and polyester-urethanes with oxidative and hydrolytic enzymes. J Biomed Mater Res. 1994;28:1187–1199. doi:10.1002/jbm.820281009