
 ?Mathematical formulae have been encoded as MathML and are displayed in this HTML version using MathJax in order to improve their display. Uncheck the box to turn MathJax off. This feature requires Javascript. Click on a formula to zoom.
ABSTRACT
With the development of lightweight aerospace equipment, magnesium alloys are receiving increasing attention. Wire-arc directed energy deposition (Wire-arc DED) is a highly promising manufacturing method for magnesium alloy parts, but its development has been severely restricted by the problems of coarse grain size and low mechanical properties. To address these issues, a hammer-forging assisted Wire-arc DED technology for magnesium alloy AZ91 is proposed. The effects of interlayer hammer-forging and synchronous hammer-forging on macrostructure, microstructure and mechanical properties of the Wire-arc DED samples are compared, and the microstructure evolution and performance enhancement mechanism are discussed. The results show that the maximum plastic deformation caused by hammer forging reaches 11.7%. Hammer forging can significantly refine grains, and the average grain size decreases from 27.7 μm to 13.5 μm. Synchronous hammer-forging is better than interlayer hammer-forging in terms of performance enhancement, the UTS reaches 301.8 MPa, an increase of 10.9%, which is comparable to that of traditional forged parts, mainly attributed to the grain refinement and increased dislocation density.
1. Introduction
Magnesium alloy, as the lightest metal structure material, is widely used in aerospace and other fields [Citation1,Citation2]. However, the traditional processing method has limitations such as long processing cycle and poor forming ability, which cannot meet the needs of future industrial applications [Citation3,Citation4]. In recent years, additive manufacturing (AM), which has the advantages of a short processing cycle and can fabricate arbitrarily complex parts, has been rapidly developed and widely used in aerospace and other important fields [Citation5–10]. Wire-arc DED is a method of using an arc to melt wire and then obtaining three-dimensional parts through layer-by-layer deposition. Compared to other AM methods, the high material utilization and deposition efficiency [Citation11–13] of Wire-arc DED make it more suitable for the manufacture of magnesium alloy components. However, the large heat input of the arc easily causes problems such as coarse grains in magnesium alloys, generally resulting in lower mechanical properties than the forging level [Citation14–16].
Aiming at the problems of coarse grains and insufficient mechanical properties of Wire-arc DED magnesium alloy, researchers have focused on some regulatory methods, such as optimizing process parameters and plastic deformation assistance [Citation17–19]. In the process optimization method, the heat input of wire-arc DED is controlled by adjusting the current and interlayer cooling [Citation20], which allows for columnar-equiaxial-transformation (CET) and the fabrication of thin-walled AZ31 components with fine equiaxial grains. In addition to this, using an ultrasonic frequency pulse (UFP) arc [Citation21] and the oscillating arc [Citation22] as the heat source to improve the solidification conditions through the oscillating molten pool also plays a role in promoting the growth of equiaxed grains and improving mechanical properties of magnesium alloys. Optimizing process parameters can play a role in refining grain size and improving mechanical properties, but the effect is limited and the research is relatively few. In contrast, more researchers focus on plastic deformation assistance. Friction stir processing (FSP) is a suitable assisted method for Wire-arc DED of magnesium alloy [Citation23,Citation24]. Through squeezing and rubbing the deposited layer to produce plastic deformation, FSP makes the microstructure dense, breaks the grains and increases the dislocation density, and the average grain size is reduced to less than 10 μm, which greatly improves its mechanical properties. The interlayer hammer forging auxiliary process [Citation25] has similar effects and principles as stirring friction, but due to the impact force, the impact area is small, the plastic deformation amount is high, and the plastic deformation effect is better, making it more suitable for manufacturing thin-walled components. In general, compared with the optimization of process parameters, the effect of plastic deformation assistance is more significant, but it usually sacrifices the deposition efficiency. In particular, interlayer hammer-forging requires large hammer-forging force or even multiple hammer-forging, and the deformation may be uneven. In contrast, the synchronous hammer-forging assisted plastic deformation method has the advantages of weak texture, good performance and no sacrifice of deposition efficiency. When the deposition layer is not completely cooled, large deformations can be generated with small hammer-forging forces, thereby refining the grains and improving mechanical properties [Citation26,Citation27]. However, the synchronous hammer-forging auxiliary process has not been applied to Wire-arc DED of magnesium alloy.
This study combines the hammer-forging auxiliary process with the magnesium alloy Wire-arc DED process to comparatively investigate the effects of both the interlayer hammer-forging and synchronous hammer-forging on the microstructure and properties of AZ91 alloy. The effects of different hammer-forging processes on the macrostructure, microstructure (phase, grain and texture) and mechanical properties (microhardness and tensile properties) of the samples are systematically discussed. The microstructure evolution and mechanical properties strengthening mechanism of hammer-forging assisted wire arc DED samples are revealed.
2. Experimental materials and methods
2.1. Experimental equipment and materials
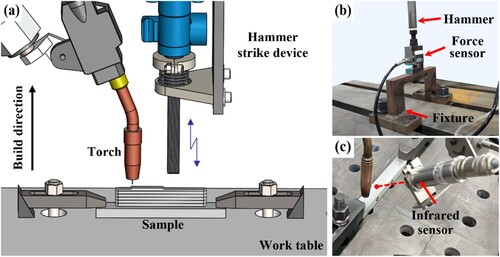
The experiment is carried out by coupling the self-built hammer-forging system with the Wire-arc DED system, and the experimental equipment is shown in (a). The Wire-arc DED system includes a Beijing Time MIG power supply (TDN 5000MB), an automatic wire feeder (TFN 6000F) and a Yaskawa manipulator (MH12). The hammer-forging system includes a hammer-forging source (GSH16-30, Bosch), a transformer (TDGC-2KV2), and another Yaskawa manipulator (GP180). A force transducer (DYLY-103) mounted on a specialized fixture is used to measure the hammer-forging force as shown in (b). The temperature of the deposited layer is measured using the infrared sensor (IGA 320, emissivity is set to 0.2) shown in (c) to obtain the molten pool temperatures variation curve.
Figure 1. Experimental equipment diagram (a) Schematic diagram of hammer-forging assisted Wire-arc DED platform (b) Hammer-forging force measuring device (c) Temperature measuring equipment.
AZ91 alloy wire with a diameter of 1.2 mm (Henan Victor Mg Alloy Technology Co., Ltd. China) and AZ91 alloy substrate with a size of 250 mm × 25 mm × 10 mm were selected. The chemical composition was measured by X-ray fluorescence, and its elemental composition and international standard are shown in .
Table 1. Chemical composition of the wire and base metal (wt%).
2.2. Experimental methods
The MIG power supply uses a one-dimensional program that automatically adjusts other parameters by simply adjusting the current. Thin-walled samples with an effective length of 140 mm and an effective height of 40 mm are deposited. During the sample preparation process, the deposition current decreases layer by layer. The currents of the first three layers are 130A, 120A, and 110A respectively, while the currents of the fourth layer and beyond remain at 100A. The distance between the welding torch and the substrate is 15 mm, the shielding gas is 20 L/min of high-purity argon, and the gas supply starts 0.5 s in advance, and closed 1 s later. Unidirectional deposition is used, with each layer being deposited from right to left at a scanning speed of 240 mm/min. The size of the hammer head is 15 mm × 15 mm, and the deposition interval of each layer is 150 s.
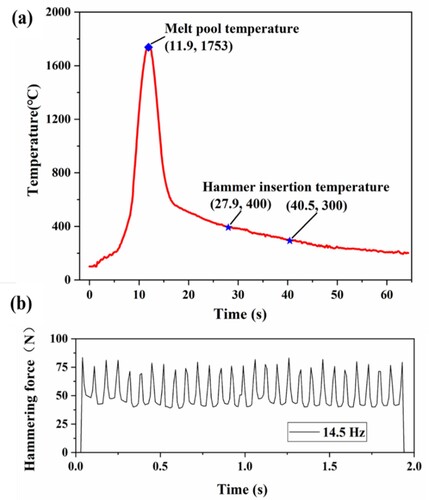
The intervention time and temperature of the forging-hammer were determined according to the temperature variation curve of the molten pool ((a)), and the hammer-forging force of 80 N was used ((b)). In the hammer-forging experiment, the hammer-forging route is the same as the deposition route. In this study, four kinds of samples are prepared. AM represents a conventional deposition sample, while ‘AMH’ represents an interlayer hammer-forging sample when the deposited layer cools to room temperature. The synchronous hammer-forging experiment is carried out when the hammer is 114 and 64 mm away from the welding torch, and the corresponding temperatures are 300 and 400°C, and the samples in these two states are recorded as AMH-300 and AMH-400, respectively.
Figure 2. (a) Temperature of depositions at different times (b) Measurement curve of hammer-forging force.
2.3. Microstructure characterization and mechanical testing
Tensile performance test samples and microstructure analysis samples were taken according to the positions and dimensions shown in . The microstructure analysis samples were ground with SiC sandpaper and polished with diamond grinding paste. The corrosion solution configured with 10 mL hydrochloric acid and 90 mL ethanol is used to wipe and corrode the surface of the specimen for 2–3 s. After the corrosion, the sample is washed with anhydrous ethanol. The grain morphology and size of YZ, XZ and XY planes are observed by optical microscope (OM, Axioscope 5). The phase composition is determined using an X-ray diffractometer (Shimadzu XRD-6000) and the microstructure of the sample is observed using a scanning electron microscope (SEM, JEOL JSM – 7900F). Grain size and orientation, texture strength and dislocation density are further characterized by electron back scatter diffraction (EBSD, Zeiss Supra 55).
Figure 3. Sampling diagram (a) Sampling position diagram (b) Tensile specimen size (mm).
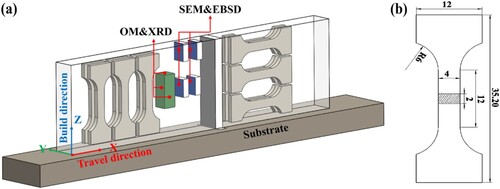
The hardness distribution in building direction is measured by Vickers hardness tester. During the hardness testing process, a load of 100 g is used and the load retention time is 15 s. Tensile test samples of building directions and travel directions are taken as shown in . Six samples are tested in each direction. The tensile samples are tested in accordance with ISO-6892-1-2009 on a universal testing machine (Shidaishijin instruments WDE-20E) at a strain rate of 1 mm/min at room temperature.
3. Results and discussion
3.1. Macrostructure
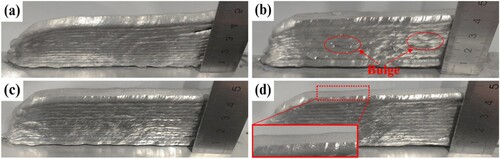
The samples macrostructure with different hammer-forging processes are shown in . With the hammer-forging, the samples can be stably shaped, and the flatness of the hammer-forging layer is obviously improved. Sudden change of heat input energy due to droplet instability and arc starting/extinguishing of each layer, the accumulated errors will eventually make the surface of AM shaped sample fluctuate [Citation28]. During hammer-forging, the higher part will contact the hammer first and be squeezed to reach the same height as other areas, thereby improving the flatness of the hammer-forging layer of the sample. The hammer-forging temperature of the AMH sample is low, and the fluidity is poor when the top is extruded to both sides during hammer-forging, which will lead to uneven extrusion on both sides and poor flatness of the side ((b)). However, the hammer-forging temperature of AMH-300 and AMH-400 is higher, and the fluidity of the top part is better, so the side wall is more flat and well structured ((c), (d)). The formula (1) is used to define the average deformation of the sample:
(1)
(1) where
means the average layer height of the sample without hammer-forging, and the
means the average layer height of the sample after hammer-forging. Compared with AM, the plastic deformation of AMH, AMH-300 and AMH-400 is 8.9%, 10.8% and 11.7%, respectively.
Figure 4. Macrostructure of samples (a) AM (b) AMH (c) AMH-300 (d) AMH-400.
3.2. Microstructure
3.2.1. Phase composition
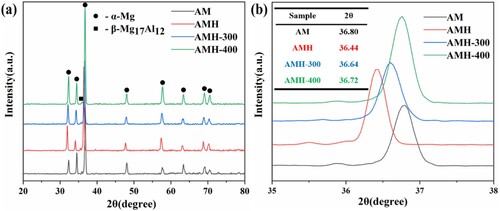
shows XRD patterns of different samples. According to the diffraction peak pattern, the phase of all samples is mainly composed of α-Mg and β-Mg17Al12. The diffraction peak intensity of α-Mg phase is much higher than that of β-Mg17Al12 phase, so the sample is mainly composed of α-Mg phase. With hammer-forging, the main diffraction peak angle is basically the same as that of the sample without hammer-forging, and no new diffraction peak is detected, which indicates that different hammer-forging processes do not produce new phases. Interestingly, with the application of hammer-forging, the main peak has an overall offset, with an offset of 0.08°–0.36°. The offset of AMH is the largest and that of AMH-400 is the smallest. This is caused by the rotation and deformation of the lattice plane during the plastic deformation of hammer-forging [Citation29]. During synchronous hammer-forging, it will still be at a high temperature after hammer-forging, and a certain degree of recovery and recrystallization will occur, which will restore the lattice distortion generated during hammer-forging. The higher the hammer-forging temperature, the more complete the recovery, so the peak offset is only 0.08° for AMH-400.
Figure 5. (a) XRD pattern of the sample (b) Magnification from 35° to 38°.
shows the SEM image of the YZ plane of different samples, and the microstructure with different hammer-forging processes is mainly composed of three phases: gray-black matrix phase, a small amount of gray-white phase and a smaller amount of white-bright phase. The elemental composition of the three phases is analyzed by EDS at high magnification ((c) Red line). The gray-black matrix phase is composed of Mg and Al elements, with an Mg content close to 95%, thus it can be determined as α-Mg phase. The gray-white phase is mainly composed of Mg and Al elements and contains a small amount of Zn elements, which is β-Mg17Al12 phase. The white-bright microstructure contains a lot of Mn elements, which is Al-Mn phase.
Figure 6. SEM images (a) AM (b) AMH (c) AMH-300 (d) AMH-400 (e) EDS patterns in AMH-300.
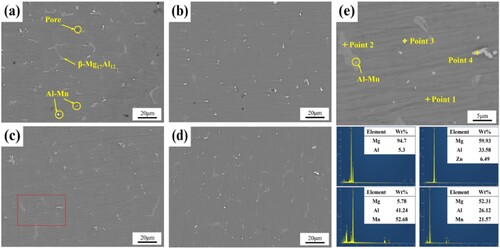
As shown in (a), the β-Mg17Al12 phase of the sample without hammer-forging is mostly coarse island and rod-like. After hammer-forging, the coarse β phase of the sample is squeezed, and the morphology changes obviously, mainly in the form of small rod-like and point-like, as shown in (b–d). Compared with the AM sample, the β phase in AMH is slightly reduced. However, the β phase in AMH-300 and AMH-400 is mainly point-like, containing some rod-like, and the content becomes more. Because AMH is fabricated with hammer-forging at room temperature, the plastic deformation causes the β phase to break or deform. However, in AMH-300 and AMH-400, because of the high intervention temperature, the β phase is broken and the Al element is re-precipitated during hammer-forging. Therefore, its content becomes more, and it is mostly point-like and rod-like dispersed evenly in the matrix microstructure. The Al-Mn phase is also observed in the β phase at high magnification, indicating that the Al-Mn phase is solidified before the β phase [Citation30].
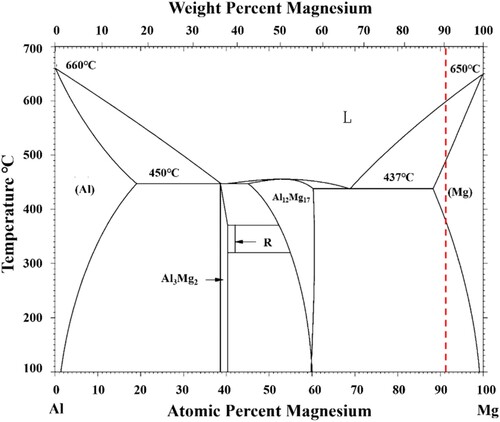
As shown in , when the temperature drops to the liquidus (about 600°C), α-Mg begins to precipitate. Because the diffusion of Al element in the solid phase is slow, and the cooling rate of wire-arc EDE is fast, some Al elements have no time to diffuse into the liquid phase, so they remain in the α-Mg matrix microstructure. With the decrease in temperature, other Al elements are continuously enriched in the liquid phase [Citation31]. At the eutectic temperature (437°C), eutectic α-Mg and Mg17Al12 are precipitated simultaneously. The atomic radius of Zn and Al is similar, Al atoms are easily replaced by Zn atoms [Citation32], and Mg17(Al, Zn)12 is formed with Mg, so a small amount of Zn element is found in the β phase in the EDS element content analysis. Because a small amount of Mn element is doped in magnesium alloy, it will first precipitate Mn-containing compounds with higher melting point. With the decrease in temperature, Mn-containing compounds will remain and enrich to form white-bright Al-Mn phase. The analysis results of microstructure composition and content by SEM images are consistent with the XRD results. Because of the low content of the Al-Mn phase, no distinct diffraction peak is detected in the XRD.
Figure 7. Binary phase diagram of Mg-Al alloy.
3.2.2. Grain morphology and size
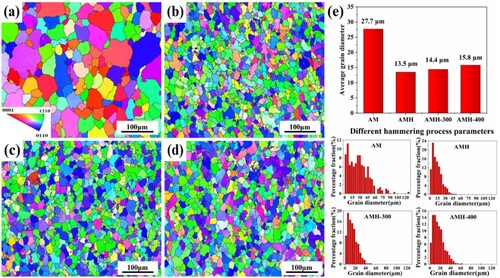
is the YZ plane EBSD diagram of samples prepared by different processes. The IPF diagram and the grain size distribution histogram of the samples are obtained by processing the data, and the average grain size under different processes is calculated. (e) shows the average grain size of different processes and the grain size distribution of corresponding processes. It is found that the samples with and without hammer-forging are all composed of equiaxed grains, and the grain refinement is obvious after hammer-forging. This is because the solute elements can produce component undercooling during solidification, thereby effectively controlling the nucleation and growth of grains. Compared with other magnesium alloys, AZ91 alloy contains more Al elements, which can provide greater component undercooling, thereby reducing the length of columnar grains and easier to form equiaxed grains [Citation33,Citation34]. The grains can be refined significantly by different hammer-forging processes, the average grain size of AM is 27.7 μm, and the grain size above 20 μm accounts for more than 60%. Compared with the AM sample, the average grain sizes of AMH, AMH-300 and AMH-400 are 13.5μm, 14.4 μm and 15.8μm, respectively, which decreased by 51.2%, 48.8% and 43.0%, and the proportion of grains below 20 μm is 60%-80%. Without hammer-forging, there are some grains with very large size. After the hammer-forging, the grain size is significantly reduced, and the grain size distribution is concentrated, indicating that the uniformity of the microstructure has been improved. This is because after the deposition is completed, the hammer-forging of the sedimentary layer will make it produce plastic deformation, so that the mature grains have mechanical crushing and extrusion deformation, which has the effect of refining the grains. However, during synchronous hammer-forging, because the hammer-forging temperature is above the recrystallization temperature (About 260°C [Citation35]) of the material, there will be a certain degree of recrystallization process after synchronous hammer-forging. The hammer-forging intervention temperature of AMH-400 is higher than that of AMH-300, and the grain growth time after forging hammer is longer, so the average grain size is larger, and the effect will not disappear with the emergence of a new deposition layer, and will eventually be reflected in the final microstructure.
Figure 8. Grain orientation and size (a) AM (b) AMH (c) AMH-300 (d) AMH-400 (e) Grain size distribution.
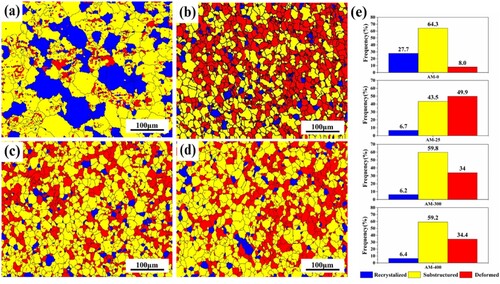
In order to verify whether there is a recovery and recrystallization behavior during the synchronous hammer-forging, samples are taken from the top layer of the sample for EBSD detection, and the recovery and recrystallization diagrams of the samples with different hammer-forging processes are obtained (). Among them, the blue area is the recrystallization structure, the yellow area is the recovery structure, and the red area is the deformation structure. The AM is mainly composed of recovery structures, containing a large amount of recrystallization structures and a small amount of deformation structures, and the recovery and recrystallization structures account for more than 70%. After hammer-forging, due to the plastic deformation, the deformation structure increases greatly, and the recrystallization structure is only about 6-7%. The whole sample is almost composed of a deformation and recovery structure. Compared with AMH, the deformed structures in AMH-300 and AMH-400 samples is significantly reduced, and the restored structures are the main component, with some recrystallized structures present. Therefore, it is verified that after the completion of synchronous hammer-forging, the material is still at a higher temperature, and there will be a recovery recrystallization process. The deformation structure of the AM sample is only 8%, and the AMH sample accounts for nearly 50%. For AMH-300 and AMH-400 samples, synchronous hammer-forging has a recovery and recrystallization process, deformation structure accounting for only about 34%.
Figure 9. Recovery and recrystallization diagram (a) AM (b) AMH (c) AMH-300 (d) AMH-400 (e) The proportion of recovery and recrystallization.
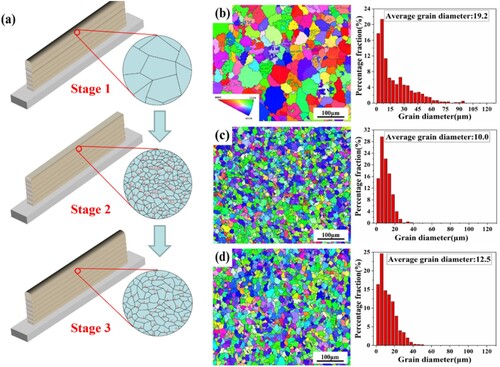
The grain refinement is the most significant evolution of the microstructure. Therefore, sampling is performed at the top, and the difference between the final state in the middle and the process state at the top is analyzed. Based on this, the evolution process of the microstructure is revealed. The sampling position and microstructure evolution are shown in (a). (b) is the top layer of AM sample, and (c,d) show the top and sub-top layers of the AMH-300 sample, respectively. Their average grain sizes are 19.2, 10.0 and 12.5 μm, respectively. Therefore, the microstructure evolution of hammer-forging samples can be divided into three stages. The first stage is composed of dense equiaxed grains under the combined action of large heat input and high cooling rate of Wire-arc DED, as shown in (b). The second stage is after hammer-forging, 9%–12% plastic deformation is produced, so that the newly grown grains are mechanically broken, the average grain size decreases significantly, and some grains are severely deformed, as shown in (c). The third stage is that with the deposition of the top layer when the temperature of the previous deposition layer is higher than the recrystallization temperature, the previous deposition layer recovers and recrystallizes, the dislocation and stress are released, the grain grows and the average grain size increases, as shown in (d) [Citation36]. Due to the high heat input of Wire-arc DED, the recrystallization of the deposited layer often occurs multiple times at this stage, that is, after re-deposition of multiple layers, the temperature of the deposited layer will always be lower than the recrystallization temperature and finally evolves into the final state in .
Figure 10. Microstructure evolution process and grain orientation and size distribution at corresponding stages (a) Microstructure evolution diagram (b) AM top layer (c) AMH-300 top layer (d) AMH-300 top.
3.2.3. Crystallographic texture
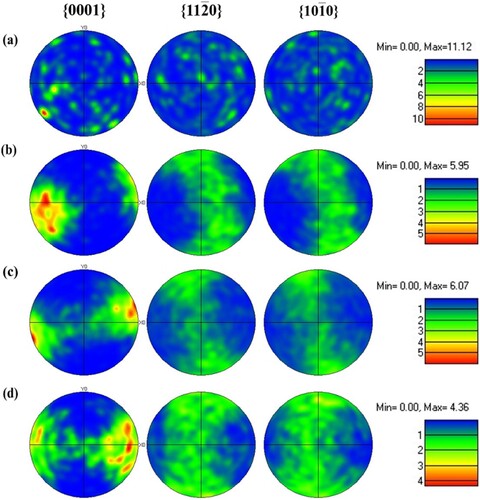
shows the pole figure of the crystal plane of sample {0001}, {110} and {10
0} with different hammer-forging processes. The texture intensity of the samples in all processes is higher on the {0001} crystal plane, and the texture intensity distribution is relatively uniform on the {11
0} and {10
0} crystal planes. The maximum texture intensity of AM is 11.12, after hammer-forging, the maximum texture intensity of AMH, AMH-300 and AMH-400 is 5.95, 6.07 and 4.36, respectively. Among them, the maximum texture intensity of AMH-400 decreases the most, reaching more than 60%. At the same time, it is found that the sample without hammer-forging does not show obvious texture orientation, but shows certain fiber texture trends after hammer-forging [Citation37,Citation38]. The results show that different hammer-forging processes can reduce the anisotropy of the tissue, and the effect of AMH-400 is the most significant.
Figure 11. Pole figures of different process samples (a) AM (b) AMH (c) AMH-300 (d) AMH-400.
3.4. Mechanical properties
3.4.1. Microhardness
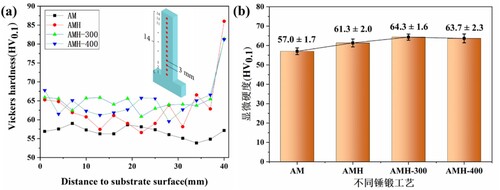
The microhardness distribution and average microhardness in the building direction are shown in . As shown in , the difference in the error bars of the samples is not large, which indicates that the microhardness uniformity of the samples has little change with the hammer forging. It is worth noting that the microhardness of the sample at the top will increase sharply after hammer-forging, which is because the top is pressed by hammer-forging and has severe work hardening. (b) shows the average microhardness of the sample. The average microhardness of AM is 57.0 HV, and the average microhardness of AMH, AMH-300 and AMH-400 is 61.3, 64.3 and 63.7 HV, respectively. Compared with the AM sample, the average microhardness of samples with hammer-forging increased by 7%–13%, and the hardness improvement of AMH-300 is the most significant. After hammer-forging, plastic deformation is produced, so a large number of dislocations are introduced, which significantly improves the microhardness of the sample. Because the resistance of synchronous hammer-forging is smaller than that of interlayer hammer-forging, a larger amount of plastic deformation is produced, and the increase of microhardness is higher than that of interlayer hammer-forging. The intervention temperature of AMH-400 is higher than that of AMH-300, and the recovery and recrystallization time of each sediment layer is longer, so its microhardness decreases slightly.
Figure 12. Microhardness diagram (a) Microhardness distribution in building direction (b) Average microhardness.
3.4.2. Tensile properties
shows the mechanical testing results of the sample. For the ultimate tensile strength (UTS) of the samples, the travel and building directions of AM sample are 272.2 and 274.4 MPa, respectively, which are much higher than the casting strength of the material (160 MPa). The travel and building directions of AMH and AMH-300 are between 287 and 294 MPa, and the increase is between 5% and 7%. The travel and building directions of AMH-400 sample are 301.8 and 298.6 MPa, respectively, increasing by 10.9% and 8.8%, respectively. In general, the UTS of samples in travel and building directions can be increased by different hammer-forging processes, and the samples after hammer-forging reach the forging level (280 MPa). Among them, AMH-400 has the largest increase, and the increase in the travel direction is greater than that in the building direction. For the yield strength (YS) of the samples, the travel and building directions of AM are 97.3 and 118.4 MPa, respectively, and the YS in the travel direction of all samples is increased after hammer-forging. The maximum increase of AMH is 147.5 MPa, with an increase of nearly 50%, but the YS in the building direction decreases, and the maximum decrease of AMH-400 is 11.8%. For the elongation (El) of the samples, the travel and building directions of AM are 12.2% and 14.6%, respectively. After the hammer-forging, El decreases in both directions, the decrease in the building direction is small, with a maximum decrease of 12.2% in AMH, and the decrease in the travel direction is large, with a maximum decrease of 51% in AMH-400. It is found that although the proportion of texture strength reduction of hammer forging is large, the specific value of decline is small, so the anisotropy of the hammer forging sample does not change much. At the same time, we found that after hammer forging, the engineering stress–strain curves of TD direction and BD direction are quite different. This is because the direction of the hammer forging force is in the BD direction, which is subjected to more severe extrusion, resulting in a reduction in plasticity and positive yield point. In addition, this is reflected in the reduction of yield strength and elongation at break.
Figure 13. Mechanical properties of specimens (a) Comparison of properties of different hammer-forging processes and directions (b) Engineering stress-strain curves (c) Comparison of the properties of AZ91 from existing studies.
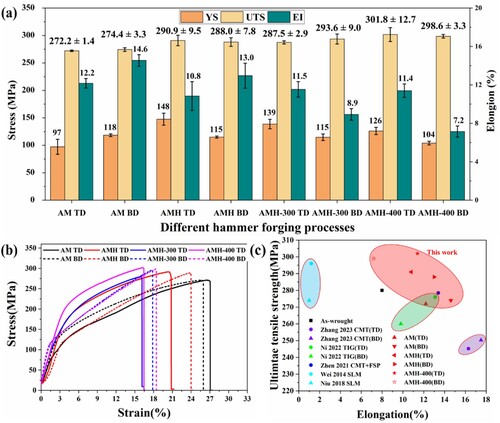
In general, the UTS and YS in travel direction can be significantly increased by different hammer-forging processes, but at the expense of decreasing YS and building direction El. In terms of UTS, the strength of the hammer-forging samples in the travel and building directions in this study are higher than in other existing studies. Including the CMT process [Citation39], TIG process [Citation40], CMT + FSP process [Citation21], etc., the properties of the hammer-forging samples all reach the forging level. Compared with some SLM processes [Citation41,Citation42], the hammer-forging samples still have good El while having high UTS. In terms of plasticity, except for AMH-400 (BD), the rest of the plasticity has reached the level of forging, but the overall plasticity is still not comparable to the CMT process and similar to the TIG process.
Large plastic deformation occurred in the hammer-forging sample, many dislocations were generated and accumulated, and average grain size decreased significantly, and the second phase of the material is the strengthening phase, and its morphology changes obviously. Therefore, there are three main reasons for the improved mechanical properties of the samples, namely, grain boundary strengthening, dislocation strengthening and second phase strengthening. The average grain size of AM samples is 27.7 μm, and the average grain size of the hammer-forging samples are 13.5, 14.4, and 15.8 μm, respectively. The grain refinement is evaluated using Hall-Petch formula [Citation43]:
(2)
(2) where
is the yield strength of the sample,
and
are constants (
),
is the average grain size. The strengths provided by grain boundary strengthening for AMH, AMH-300 and AMH-400 samples are 24.6, 22.1 and 18.5 MPa, respectively. As shown in , the YS increases of different hammer-forging processes in the travel direction are 51, 42 and 29 MPa respectively, and grain boundary strengthening accounts for a large proportion of improving performance, but not all. Dislocation strengthening is described by dislocation density, and kernel average misorientation (KAM) diagrams are commonly used to represent the magnitude of dislocation density. In general, the dislocation density is expressed by the following formula [Citation25]:
(3)
(3) where
is the step size,
is the Burgers vector length,
is the average KAM value, KAM diagram is obtained by processing EBSD.
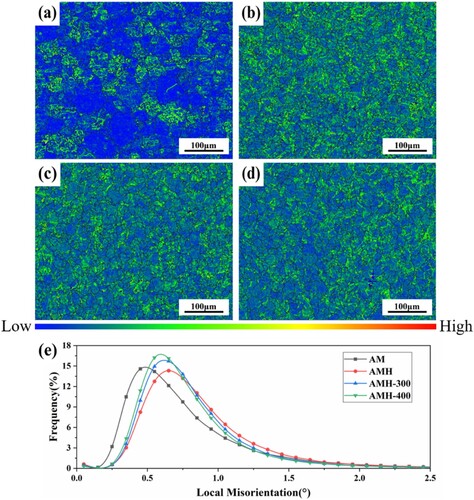
is the KAM diagram of different process samples. As shown in the figure, the main area of the figure is blue without hammer-forging, and the green part increases significantly after hammer-forging, indicating that the dislocation density increases. By comparison, AMH has the highest dislocation density, because its hammer-forging temperature is room temperature, and plastic deformation caused by mechanical hammer-forging will produce a large number of dislocation accumulation. However, AMH-300 and AMH-400 are hammer-forging above the recrystallization temperature. After hammer-forging, there will be a certain time of recovery and recrystallization, and some dislocations will be released, so the dislocation density is lower than that of AMH. Moreover, the higher the hammer-forging intervention temperature, the longer the recovery and recrystallization time, the more dislocations are released, so the dislocation density of AMH-400 is lower than that of AMH-300. However, no matter how hammer-forging, it will increase the dislocation density of the sample.
Figure 14. KAM diagram of different process samples (a) AM (b) AMH (c) AMH-300 (d) AMH-400 (e) KAM curve.
Because of the large plastic deformation under the action of hammer-forging, a large number of dislocations generated will also significantly affect its performance [Citation44]. Therefore, Taylor equation is used to evaluate the strengthening effect of dislocation [Citation45,Citation46]:
(5)
(5) where
is the YS of the specimen,
is the YS of the dislocation-free state,
is a constant (
),
is the Taylor factor (
),
is the shear modulus (
),
is the Burgers vector length (The material is close-packed hexagonal structure,
), and
is the dislocation density. The calculated relationship between dislocation density and KAM is shown in formula (2), where EBSD detection step size
. According to , the mean KAM values of AM, AMH, AMH-300 and AMH-400 samples can be calculated as 0.734°, 0.879°, 0.824° and 0.798°, respectively. According to the formula calculation, the performance improvement of dislocation strengthening is 28.1, 17.7 and 12.7 MPa, respectively.
Through the above analysis, the total improvement of AMH, AMH-300 and AMH-400 is 52.7, 39.8 and 31.2 MPa, which is similar to the tensile experiment. Therefore, the improvement of the YS in the travel direction of the sample by hammer-forging mainly comes from grain boundary strengthening and dislocation strengthening.
But in terms of UTS, AMH-400 has the highest value in both travel and building directions among all hammer-forging process samples, but its grain boundary strengthening and dislocation strengthening are not as large as those of other hammer-forging processes. The second phase of the material is a strengthening phase [Citation47], and the addition of hammer-forging leads to a change in the morphology of the second phase, as shown in . Compared with AMH and AMH-300, the overall content of the second phase of AMH-400 increases, and it is dispersed everywhere, which is relatively more uniform, forming dispersion strengthening [Citation48] and improving mechanical properties. The hammer-forging temperature of AMH-400 is much higher than the recrystallization temperature, and the return recrystallization of the hammer-forging sample will leave time for the precipitation of aluminum elements and form more second phase.
3.4.3. Fracture morphology
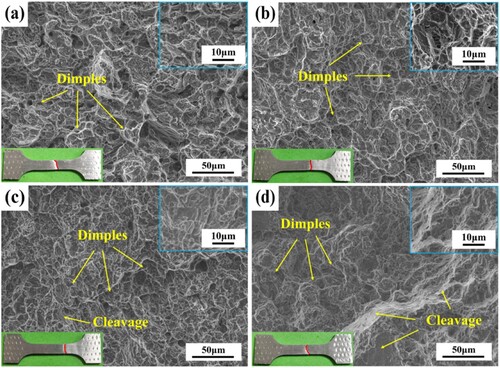
shows the fracture morphology in the travel direction of different process samples. The fractures of AM and AMH samples are all composed of small dimples, but the dimples of AMH samples are relatively shallow, so their plasticity is slightly lower ((a), (b)). AMH-300 has a small number of quasi-cleavage plane, but the size and number of quasi-cleavage plane are small. AMH-400 sample has a large quasi-cleavage plane. It is the appearance of these quasi-cleavage plane that causes its plasticity to be lower than that of the AM sample ( (c), (d)). The size and depth of the dimples are similar in different horizontal processes. The influence of a few quasi-cleavage planes is small, and the plasticity is not different.
Figure 15. Tensile fracture morphology in travel direction (a) AM (b) AMH (c) AMH-300 (d) AMH-400.
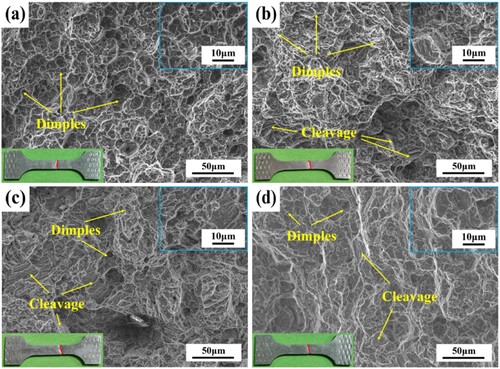
shows the fracture morphology in the building direction of different process samples. AM is composed of small dimples, AMH and AMH-300 have partial quasi-cleavage planes ((b), (c)), and the content of AMH-400 quasi-cleavage planes increases ((d)). Compared with the travel direction, the fracture difference of different process samples in the building direction is relatively obvious. Without hammer-forging, the dimple size is small and the depth is deep, with the application of hammer-forging process, the dimple depth gradually becomes shallow, and the dimple size gradually becomes larger, especially for AMH-400 sample. Therefore, compared with the samples without hammer-forging, the plasticity of hammer forging samples is worse, especially the plasticity of AMH-400 decreases obviously. In general, the travel and building tensile fractures of all samples are mainly dimple fractures, which belong to ductile fractures [Citation49]. After hammer-forging, there is a small amount of quasi-cleavage plane, and the fracture morphology of the travel and building directions is obviously different.
Figure 16. Tensile fracture morphology in building direction (a) AM (b) AMH (c) AMH-300 (d) AMH-400.
4. Conclusion
In this study, the problem of mechanical properties reduction due to coarse grains in Wire-arc DED of magnesium alloys was studied, and a hammer-forging assisted Wire-arc DED technology was proposed. AZ91 alloy thin-walled samples with different hammer-forging processes were successfully prepared. The effects of different hammer-forging processes on the microstructure and mechanical properties of fabricated samples were studied. Finally, the following conclusions are drawn:
The thin-walled AZ91 alloy with stable morphology and good macrostructure can be deposited by hammer-forging assisted Wire-arc DED technology. The plastic deformation of the samples prepared by interlayer hammer-forging, 300°C and 400°C synchronous hammer-forging were 8.9%, 10.8% and 11.7%, respectively.
The samples with and without hammer-forging assistance are both composed of equiaxed grains. With hammer-forging assistance, the average grain size refined from 27.7μm to 13.5μm, reducing by 51.2%. The sample without hammer-forging has no obvious texture orientation, but the texture strength decreases significantly with the hammer-forging and shows a certain fiber texture.
Different hammer-forging processes can significantly improve the UTS in the travel and building directions and the YS in the travel direction but will reduce the EI of the samples and YS in the building direction. The UTS in the travel and building directions of AMH-400 samples are 301.78 and 298.61 MPa, respectively, increasing by 10.9% and 8.8%. The improvement in performance is mainly attributed to the grain refinement and increased dislocation density.
Disclosure statement
No potential conflict of interest was reported by the authors.
Data availability statement
The authors will supply the relevant data in response to reasonable requests.
Additional information
Funding
References
- Motallebi R, Savaedi Z, Mirzadeh H. Post-processing heat treatment of lightweight magnesium alloys fabricated by additive manufacturing: a review. J Mater Res Technol. 2022;20:1873–1892. doi:10.1016/j.jmrt.2022.07.154
- Zeng Z, Salehi M, Kopp A, et al. Recent progress and perspectives in additive manufacturing of magnesium alloys. J Mag Alloys. 2022;10(6):1511–1541. doi:10.1016/j.jma.2022.03.001
- Ying T, Zhao Z, Yan P, et al. Effect of fabrication parameters on the microstructure and mechanical properties of wire arc additive manufactured AZ61 alloy. Mater Lett. 2022;307:131014. doi:10.1016/j.matlet.2021.131014
- Li X, Fang X, Zhang M, et al. Enhanced strength-ductility synergy of magnesium alloy fabricated by ultrasound assisted directed energy deposition. J Mater Sci Technol. 2024;178:247–261. doi:10.1016/j.jmst.2023.09.021
- Hamrani A, Bouarab FZ, Agarwal A, et al. Advancements and applications of multiple wire processes in additive manufacturing: a comprehensive systematic review. Virtual Phys Prototyp. 2023;18(1):e2273303. DOI: 10.1080/17452759.2023.2273303
- Javidrad H, Koc B, Bayraktar H, et al. Fatigue performance of metal additive manufacturing: a comprehensive overview. Virtual Phys Prototyp. 2024;19(1):e2302556. DOI: 10.1080/17452759.2024.2302556
- Ibhadode O, Zhang Z, Sixt J, et al. Topology optimization for metal additive manufacturing: current trends, challenges, and future outlook. Virtual Phys Prototyp. 2023;18(1):e2181192. DOI: 10.1080/17452759.2023.2181192
- Hao Yi LJ, Ding J, Li H. Achieving material diversity in wire arc additive manufacturing: leaping from alloys to composites via wire innovation. Int J Mach Tools Manuf. 2024;194:104103. doi:10.1016/j.ijmachtools.2023.104103
- Hua Q, Wang W, Li R, et al. Microstructures and mechanical properties of Al-Mg-Sc-Zr alloy additively manufactured by laser direct energy deposition. Chin J Mech Eng: Addit Manuf Frontiers. 2022;1(4):100057. doi:10.1016/j.cjmeam.2022.100057
- Gao C, Li C, Peng S, et al. Spiral-eutectic-reinforced biodegradable Zn-Mg-Ag alloy prepared via selective laser melting. Chin J Mech Eng: Addit Manuf Frontiers. 2022;1(2):100022. doi:10.1016/j.cjmeam.2022.100022
- Liu D, Lee B, Babkin A, et al. Research progress of arc additive manufacture technology. Materials. 2021;14(6):1415. doi:10.3390/ma14061415
- Cui X, Qi E, Sun Z, et al. Wire oscillating laser additive manufacturing of 2319 aluminum alloy: optimization of process parameters, microstructure, and mechanical properties. Chin J Mech Eng: Addit Manuf Frontiers. 2022;1(3):100035. doi:10.1016/j.cjmeam.2022.100035
- Yi H, Wang Q, Cao H. Wire-arc directed energy deposition of magnesium alloys: microstructure, properties and quality optimization strategies. J Mater Res Technol. 2022;20:627–649. doi:10.1016/j.jmrt.2022.07.083
- Yang Y, Xiong X, Chen J, et al. Research advances of magnesium and magnesium alloys worldwide in 2022. J Mag Alloys. 2023;11(8):2611–2654. doi:10.1016/j.jma.2023.07.011
- Jafari D, Vaneker THJ, Gibson I. Wire and arc additive manufacturing: opportunities and challenges to control the quality and accuracy of manufactured parts. Mater Des. 2021;202:109471. doi:10.1016/j.matdes.2021.109471
- Yi H, Wang Q, Zhang W, et al. Wire-arc directed energy deposited Mg-Al alloy assisted by ultrasonic vibration: improving properties via controlling grain structures. J Mater Process Technol. 2023;321:118134. doi:10.1016/j.jmatprotec.2023.118134
- Rodrigues TA, Duarte V, Miranda RM, et al. Current status and perspectives on wire and arc additive manufacturing (WAAM). Materials. 2019;12(7):1121. doi:10.3390/ma12071121
- Gneiger S, Österreicher JA, Arnoldt AR, et al. Development of a high strength magnesium alloy for wire arc additive manufacturing. Metals. 2020;10(6):778. doi:10.3390/met10060778
- Li X, Zhang M, Fang X, et al. Improved strength-ductility synergy of directed energy deposited AZ31 magnesium alloy with cryogenic cooling mode. Virtual Phys Prototyp. 2023;18(1):e2170252. DOI: 10.1080/17452759.2023.2170252
- Fang X, Yang J, Wang S, et al. Additive manufacturing of high performance AZ31 magnesium alloy with full equiaxed grains: microstructure, mechanical property, and electromechanical corrosion performance. J Mater Process Technol. 2022;300:117430. doi:10.1016/j.jmatprotec.2021.117430
- Cao Q, Qi B, Zeng C, et al. Achieving equiaxed microstructure and isotropic mechanical properties of additively manufactured AZ31 magnesium alloy via ultrasonic frequency pulsed arc. J Alloys Compd. 2022;909:164742. doi:10.1016/j.jallcom.2022.164742
- Cheng S, Liu F, Xu Y, et al. Effects of arc oscillation on microstructure and mechanical properties of AZ31 magnesium alloy prepared by CMT wire-arc directed energy deposition. Mater Sci Eng A. 2023;864:144539. doi:10.1016/j.msea.2022.144539
- Zhen Y, Shen J, Hu S, et al. Effect of friction stir processing on microstructure and properties of AZ91 magnesium alloy CMT cladding layer. Mater Lett. 2021;282:128701. doi:10.1016/j.matlet.2020.128701
- Long J, Wang Z, Yin F, et al. Microstructure and mechanical property improvement of AZ31B induced by the combination of cold metal transfer welding and friction stir processing. J Mater Eng Perform. 2022;31(4):3354–3361. doi:10.1007/s11665-021-06429-1
- Joshi SS, Patil SM, Mazumder S, et al. Additive friction stir deposition of AZ31B magnesium alloy. J Mag Alloys. 2022;10(9):2404–2420. doi:10.1016/j.jma.2022.03.011
- Robinson TW, Williams MB, Rao HM. Microstructural and mechanical properties of a solid-state additive manufactured magnesium alloy. Proc IEEE. 2021;144:131–139. DOI: 10.1115/1.4052968
- Fang X, Yang J, Jiang X, et al. Wire-arc directed energy deposited high-performance AZ31 magnesium alloy via a novel interlayer hammering treatment. Mater Sci Eng A. 2024;889:145864. doi:10.1016/j.msea.2023.145864
- Wu D, Yu C, Wang Q, et al. Synchronous-hammer-forging-assisted laser directed energy deposition additive manufacturing of high-performance 316L samples. J Mater Process Technol. 2022;307:117695. doi:10.1016/j.jmatprotec.2022.117695
- Niu F, Wang Q, Shan B, et al. Synchronous-hammer-forging-assisted wire arc additive manufacturing Al-Mg alloy. J Alloys Compd. 2023;965:171345. doi:10.1016/j.jallcom.2023.171345
- Jing C, Mao H, Xu T, et al. Fabricating 316 L stainless steel unsupported rods by controlling the flow of molten pool via wire arc additive manufacturing. J Mater Process Technol. 2023;319:118066. doi:10.1016/j.jmatprotec.2023.118066
- Gu J, Wang X, Bai J, et al. Deformation microstructures and strengthening mechanisms for the wire + arc additively manufactured Al-Mg4.5Mn alloy with inter-layer rolling. Mater Sci Eng A. 2018;712:292–301. doi:10.1016/j.msea.2017.11.113
- Ohno M, Mirkovic D, Schmidfetzre R. Liquidus and solidus temperatures of Mg-rich Mg–Al–Mn– Zn alloys. Acta Mater. 2006;54(15):3883–3891. doi:10.1016/j.actamat.2006.04.022
- Cen L, Gong M, Gao M, et al. Oscillating laser-arc hybrid additive manufacturing of AZ31 magnesium alloy. Adv Laser Process Manuf VI. 2022;12312:123120I. DOI: 10.1117/12.2641943
- Bi J, Shen J, Hu S, et al. Microstructure and mechanical properties of AZ91 Mg alloy fabricated by cold metal transfer additive manufacturing. Mater Lett. 2020;276:128185. doi:10.1016/j.matlet.2020.128185
- StJohn DH, Qian M, Easton MA, et al. Grain refinement of magnesium alloys. Metall Mater Trans A. 2005;36A:1669–1678. doi:10.1007/s11661-005-0030-6
- Paliwal M, Jung I-H. Solid/liquid interfacial energy of Mg-Al alloys. Metall Mater Trans A. 2013;44(4):1636–1640. doi:10.1007/s11661-013-1623-0
- Liu X, Xu P, Shiro A, et al. Heat-induced structural changes in magnesium alloys AZ91 and AZ31 investigated by in situ synchrotron high-energy X-ray diffraction. J Mater Sci. 2022;57(46):21446–21459. doi:10.1007/s10853-022-07917-y
- Guo Y, Quan G, Jiang Y, et al. Formability, microstructure evolution and mechanical properties of wire arc additively manufactured AZ80M magnesium alloy using gas tungsten arc welding. J Mag Alloys. 2021;9(1):192–201. doi:10.1016/j.jma.2020.01.003
- Zhang Z, Shen J, Bi J, et al. Microstructure and mechanical properties of weaving wire and arc additive manufactured AZ91 magnesium alloy based on cold metal transfer technique. Materials. 2023;16(11):4047. doi:10.3390/ma16114047
- Cheng N, Keyu Z, Jikang F, et al. Microstructure and mechanical properties of TIG arc additive manufacturing of AZ91 magnesium alloy. Chin J Nonferr Metals. 2022;32(3):692–699. doi:10.11817/j.ysxb.1004.0609.2021-42446
- Wei K, Gao M, Wang Z, et al. Effect of energy input on formability, microstructure and mechanical properties of selective laser melted AZ91D magnesium alloy. Mater Sci Eng A. 2014;611:212–222. doi:10.1016/j.msea.2014.05.092
- Niu X, Shen H, Fu J. Microstructure and mechanical properties of selective laser melted Mg-9 Al powder mixture. Mater Lett. 2018;221:4–7. doi:10.1016/j.matlet.2018.03.068
- Galindo-Nava EI, Rivera-Díaz-del-Castillo PEJ. A model for the microstructure behaviour and strength evolution in lath martensite. Acta Mater. 2015;98:81–93. doi:10.1016/j.actamat.2015.07.018
- Wang J, Gao J, Yang H, et al. High-strength Al-5Mg2Si-2Mg-2Fe alloy with extremely high Fe content for green industrial application through additive manufacturing. Virtual Phys Prototyp. 2023;18(1):e2235587. DOI: 10.1080/17452759.2023.2235587
- Guo Y, Han Q, Lu W, et al. Microstructure tuning enables synergistic improvements in strength and ductility of wire-arc additive manufactured commercial Al-Zn-Mg-Cu alloys. Virtual Phys Prototyp. 2022;17(3):649–661. DOI: 10.1080/17452759.2022.2048236
- Huang K, Zhao Q, Li Y, et al. Two-stage annealing of a cold-rolled Al–Mn–Fe–Si alloy with different microchemistry states. J Mater Process Technol. 2015;221:87–99. doi:10.1016/j.jmatprotec.2015.02.016
- Yin C, Shen J, Hu S, et al. Microstructure and mechanical properties of AZ91 magnesium alloy fabricated by multi-layer and multi-pass CMT based WAAM technique. Res Eng. 2023;18:101065. doi:10.1016/j.rineng.2023.101065
- You Z, Jiang A, Duan Z, et al. Effect of heat treatment on microstructure and properties of semi-solid squeeze casting AZ91D. China Foundry. 2020;17(3):219–226. doi:10.1007/s41230-020-9103-9
- Klein T, Arnoldt A, Schnall M, et al. Microstructure formation and mechanical properties of a wire-arc additive manufactured magnesium alloy. J Miner. 2021;73(4):1126–1134. doi:10.1007/s11837-021-04567-4