
 ?Mathematical formulae have been encoded as MathML and are displayed in this HTML version using MathJax in order to improve their display. Uncheck the box to turn MathJax off. This feature requires Javascript. Click on a formula to zoom.
ABSTRACT
Wire-arc directed energy deposition is promising for manufacturing ultra-high-strength Al-Zn-Mg-Cu alloy components. However, the undesired microstructure and performance of as-deposited alloys make the heat treatment a mandatory post-process, which still lacks systematic investigation. This work aims to establish a comprehensive understanding of it. An interplay between second-phase dissolution and defect formation in the single-stage solution of as-deposited Al-Zn-Mg-Cu alloy was found: as solution temperatures increase, the equilibrium proportion of residual phases decreases, but the proportion of pore defects increases significantly. Based on a systematic full-factor solution test, a 430°C/4 h + 450°C/4 h step solution process was proposed, which suppressed the pore defects by about 54.8% while keeping the effect of the residual phase dissolution unchanged. After the step solution and artificial aging, the average yield strength of the alloy reached 475 MPa, and the elongation reached 6.5%, showing 201.6% and 85.7% improvement compared with the as-deposited state, respectively.
1. Introduction
Wire-arc directed energy deposition (DED) is an efficient and low-cost additive manufacturing technology for large-scale aluminium alloys [Citation1]. Applying electric arcs as the heat source, wire-arc DED has lower solidification rates (usually 102–104 K/s [Citation2]) than additive manufacturing technologies based on high-energy beams (∼106 K/s [Citation3] for selective laser melting (SLM)), leading to lower solidification shrinkage rates. This is beneficial for controlling solidification cracks [Citation4], so additive manufacturing of high-strength aluminium alloys is possible with wire-arc DED.
However, the deposited high-strength aluminium alloy is usually characterised by mechanical property loss due to undesired solidification microstructures, which limits the application of wire-arc DED in the industry. According to the findings of Qi et al. [Citation5], the ultimate tensile strength (UTS), yield tensile strength (YTS), and elongation of wire-arc DED produced 2024-Al were only 60%, 54% and 30% of the AA2024-T6 plate. Bai et al. found that the microstructures of the deposited 2219-Al consisted of net-shaped eutectics, which was detrimental to the mechanical properties. The as-deposited specimen showed a 43% drop in UTS compared with the AA2219-T62 plate [Citation6].
Heat treatment is a practical solution to solve the above problem in the additive manufacturing field [Citation7]. Gu et al. [Citation8] applied a solution and artificial aging treatment to strengthen the 2319-Al fabricated by wire-arc DED with inter-layer rolling. After the solution at 535°C for 90 min and the aging at 175°C for 3 h, the 45 kN rolled specimen showed UTS and YTS over 450 MPa and 305 MPa, respectively, which were higher than the wrought 2219-Al at T6 state. Qi et al. [Citation9] applied solution+natural aging treatment to the high-strength 2024-Al fabricated by wire-arc DED. They found that high solution temperature was beneficial to both strength and elongation. With a 503°C solution and subsequent natural aging, the UTS and elongation of as-deposited components increased to 497 MPa and 16%, reaching the level of the wrought 2024-T6 plate. Li et al. [Citation10] investigated the responses of microstructures and mechanical properties of laser melting deposited Al-5Si-Cu-Mg alloy to the solution+artificial aging treatments. The deposited alloy reached an UTS of 416 MPa and an elongation of 15.2% after optimised heat treatment due to the spherizing of Si and precipitation of metastable particles. Fang et al. [Citation11] investigated the effects of solution and artificial aging treatments on the microstructures and mechanical properties of wire-arc DED produced A375 aluminium alloy. The YTS and UTS experienced a 119% improvement and a 59% increase, respectively, at the expense of a 61% drop in elongation. Eimer et al. [Citation12] applied inter-layer cold working and heat treatments to improve the properties of wire-arc DED produced 2024-Al and found the UTS in the horizontal direction can be improved from 324 MPa to 467 MPa, while the elongation increased from 7.7% to 22.6%. Zhou et al. [Citation13] investigated the effects of solution and aging treatments on the wire-arc DED produced 205A aluminium alloy, finding that Cu-Cd vacancy clusters lead to a strong precipitate driven force of θ’ phase. An UTS of 510.2 MPa and an elongation of 11.8% in the horizontal direction were achieved after the treatment. These researches indicate that the undesired microstructures and properties of additive-manufactured aluminium alloy can be improved by post-heat treatments.
In the former study, the feasibility of using wire-arc DED to fabricate Al-Zn-Mg-Cu alloy components has been verified. This type of aluminium alloy is usually characterised by excellent specific strength, modulus, fatigue resistance, and toughness and is widely used in the aerospace and military fields. Although wire-arc DED is proved to be a potential candidate for low cost and flexible manufacturing of this type of aluminium alloy, the deposited 7055-Al shows unsatisfactory mechanical properties: an UTS of 230.7 MPa and an elongation of 3.2%, which are much lower than the conventionally forged counterpart [Citation14]. Similar property loss was also found in other research. Wang et al. [Citation15] applied a multi-wire indirect arc DED technology to fabricate Al5.7Zn3.4Mg1.6Cu alloys via feeding Zn, 2319-Al, and 5356-Al wires simultaneously. The average UTS and elongation of the deposited specimen were 243.9 MPa and 5.9%, respectively. Yuan et al. [Citation16,Citation17] introduced TiN nanoparticles into the Al6.65Zn2.49Mg2.42Cu alloy to improve its properties. The as-deposited specimen achieved a UTS of 296.5 MPa and an elongation of 11.2% along the horizontal direction. Guo et al. [Citation18] added 0.24 wt% Sc into 7B55 alloy wires for wire-arc DED. The deposited 7B55-Sc specimen showed an average UTS of 358 MPa and an elongation of 4.8% without further heat treatments. Qie et al. [Citation19] introduced inter-layer friction stir processing to modify the mechanical property of wire-arc DED produced 7075 alloy. Without heat treatments, the UTS and elongation of the as-deposited specimen in the vertical direction were 348 MPa and 18.8%, respectively. Although modification methods show significant advantages in improving the mechanical properties, there are still big differences between wire-arc DED and conventionally fabricated Al-Zn-Mg-Cu alloys. Thus, there is a need to investigate the heat treatments of the deposited Al-Zn-Mg-Cu alloys.
As is proved by Girelli et al. [Citation20], the heat treatments suitable for conventionally fabricated aluminium sometimes show poor applicability to additive manufactured materials. The unique initial microstructures of additive-manufactured aluminium alloys should be considered when designing the heat treatment process and parameters. For the wire-arc DED produced aluminium alloys, secondary defects may present during the heat treatments due to hydrogen release or Kirkendall effects. Miao et al. [Citation21] explored the evolution law of porosity of the deposited Al-6.3Cu alloy during solution, finding that higher solution temperatures and longer solution time contributed to the increase of porosity, while porosity had a significant influence on the fatigue resistance of the deposited alloy. Mclean et al. [Citation22] investigated the porosity evolution during HIP and heat treatment of the deposited 2319-Al. They found that without HIP, the volume fraction of porosity increased by up to 40% during heat treatment. While the HIP was applied, although large pores were eliminated, a 288% increase of the fine porosity (<35 μm) was witnessed. So, a systematic study on heat treatments of the deposited Al-Zn-Mg-Cu alloy is urgently needed.
Recently, some progress has been made. Fu et al. [Citation23] applied a 400°C/4 h+468°C/8 h+473°C/6 h three-stage solution and a 120°C/16 h aging treatment to hot wire-arc additive manufactured 7055 alloys. A UTS of 563 MPa and an elongation of 10% were achieved. Guo et al. [Citation18] explored the influences of T6, T73, as well as retrogression and re-aging (RRA) heat treatment on the performance of wire-arc DED produced 7B55-Sc alloys. They found the T6 treatment achieved the highest UTS of 618 MPa, while the T77 achieved the highest corrosion resistance with a 17% expense on the UTS. However, the defects and microstructural evolution law during heat treatments, as well as the defect suppression approaches, are still not clear. To fill this knowledge gap, in this research, we fabricated several 7055-Al single-pass multi-layered parts with optimised parameters. Full-factor solution tests were applied to investigate the evolution of defects and second phases. The interplay between second-phase dissolution and defect formation in the single-stage solution was found. Based on a quantitative analysis of the microstructural and compositional evolution laws, a novel step solution treatment was proposed, and good defect suppression effects were achieved without sacrificing the second-phase dissolution effects. The work shed light on the heat treatment design routine of defect-sensitive aluminium alloy fabricated by wire-arc DED.
2. Experimental procedures
2.1. Wire-arc DED and heat treatments
Several single-pass multi-layered 7055 alloy parts (shown in ) were fabricated by wire-arc DED using the parameters listed in . Block specimens were cut from these components with wire electrode cutting for heat treatments.
Figure 1. Single-pass multi-layered parts and specimen information: (a) Single-pass multi-layered parts for heat treatments and (b) specimen extracting location and tensile specimen dimensions.
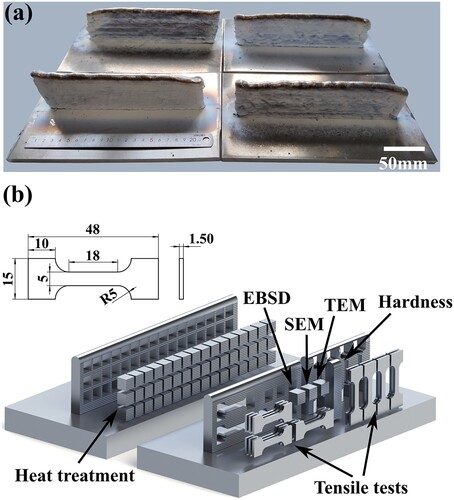
Table 1. Fabrication parameters of wire-arc DED.
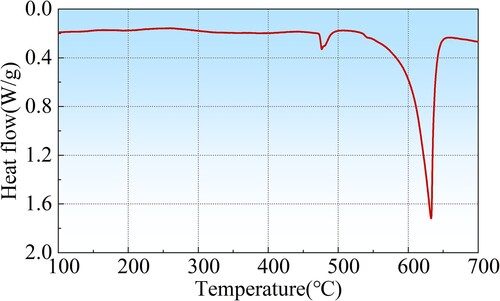
Since most of the alloy elements exist in large second phases in the as-deposited metal, a solution treatment has to be carried out to get a supersaturated matrix and dissolve large-scale second phases. At first, the safe temperature range of the solution was determined by differential scanning calorimetry (DSC). As shown in , the first peak indicates the dissolution peak of η(Mg(Zn, Cu, Al)2) phase, and the second one is the melting peak. The dissolution peak of η (Mg(Zn, Cu, Al)2) phase starts at 472°C and ends at 497°C. Therefore, the solid solution temperature should not exceed 472°C to prevent overburning.
Figure 2. The DSC curve of the as-deposited 7055 alloy.
Considering the temperature control accuracy of the furnace, the highest solid solution temperature was selected as 470°C, and other solid solution treatments were carried out at 450, 430 and 410°C to compare the microstructure and defect evolution. The longest solid solution time for each temperature was 72 h, and specimens were taken out from the furnace and quenched every 4 h for examination. In the first 4 h, additional specimens were taken out at 0.5, 1 and 2 h to investigate the early evolution. All samples were water-cooled after the solid solution, and aging was performed at 120°C for 24 h in order to stabilise the microstructure.
After finding the suitable solution process for the as-deposited Al-Zn-Mg-Cu alloy, the aging treatments were conducted at 100, 120, 140 and 160°C for up to 60 h. Specimens were taken out from the furnace, and their hardness was tested immediately. Also, in the first 4 h, additional specimens were taken out at 0.25, 0.5, 1 and 2 h to investigate the early aging response. The processing windows of artificial aging were chosen by examining the microhardness and time efficiency. The solution and artificial aging treatment were conducted in an air furnace (KSL-1500X, Hefei Kejing Material Technology Co., LTD, temperature-controlling precision: ±1°C) and an electric drying oven with forced convection (101A-E, Shanghai Shiyan Co., LTD, China, temperature-controlling precision: ±1°C), respectively.
2.2. Microstructural characterization
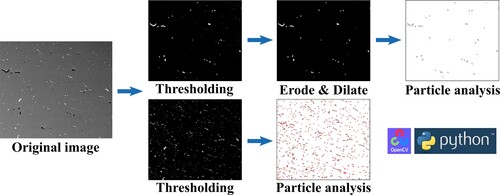
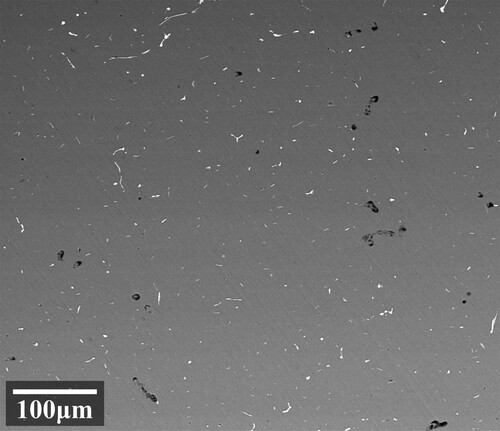
Block specimens with dimensions of 10 mm × 10 mm × 5 mm were cut from the heat-treated specimens for SEM analysis. They were mechanically polished on abrasive paper and velvet clothes. After that, the second phases and defects were analysed via an FEI 200FEG scanning electron microscope (SEM) with a mounted EDAX energy disperse spectroscope (EDS). For each specimen, 20 back-scattering electron (BSE) photos were randomly taken with a magnification of 500x. Then the two-dimensional proportion of residual second phases and defects was calculated based on these images following the image processing flow shown in . In the BSE photos, second phases are shown in white due to the high atomic number, while pore defects are shown in black due to local voids. For pore defects, thresholding was applied to the image to separate pixels with low grey levels, followed by eroding and dilating to remove tiny noise pixels. Then, particle analysis was conducted to separate pixel groups, and their total areas were calculated. The percentage of these pixels is calculated and regarded as the percentage of pores in this image. For second phases, thresholding was applied to the image to separate pixels with high grey levels. Since the dimensions of second phases can be very small, the erode and dilate are not used. Particle analysis was applied directly to the thresholded images. Then, the percentage of selected pixels is calculated, and the value is regarded as the percentage of second phases.
Figure 3. Image processing flow for the analysis of second phases and defect.
After solution and aging treatments, the grain morphology of heat-treated block specimens was checked by an FEI 200FEG SEM with mounted EDAX TSL electron back-scattering diffraction(EBSD). The preparation of specimens includes mechanical polishing and a final ion polishing on a Gatan ion plane polisher. An opensource Matlab toolkit MTEX was used to process the EBSD raw data. Then, flake specimens with dimensions of 10 mm × 10 mm × 0.5 mm were cut from the blocks for transmission electron microscope (TEM) observation. They were mechanically thinned to 45 um, and ion thinned to on a Gatan ion milling system. The nanoscale precipitations were observed with an FEI Talos 200X TEM under the bright field (BF), scanning transmission electron microscope (STEM), and high resolution (HR) mode. The chemical composition of the nanoscale precipitations was examined by the nanoscale EDS. The fast Fourier transformation (FFT) of the HR photos was conducted on the Gatan DigitalMicrograph software. While indexing the patterns, lattice parameters of the second phases in the Crystallography Open Database were used.
2.3. Mechanical property tests
Hardness tests were carried out on the artificially aged samples with a VHS 1000 microhardness tester. In the artificial aging tests, the hardness was chosen for aging response evaluation. For each specimen, the hardness was tested randomly at ten locations. After the heat treatment, hardness tests were conducted from the substrate to the top surface of the single-pass multi-layered specimen to evaluate the micro-regional mechanical properties. The hardness was tested with an interval of 1 mm along the vertical direction. At each height position, the tests were repeated five times. Tensile specimens in both the horizontal and vertical directions were included to investigate the anisotropy of tensile properties after heat treatments. For each direction, eight specimens were prepared for tests. The tensile tests were carried out on an Instron 5569 universal testing machine according to the Chinese national standard GB/T228.1-2010 with a contact extensometer. After the rupture of these specimens, fractures were examined with SEM.
3. Results and discussion
3.1. Effects of the regular single-stage solution treatment
3.1.1. Microstructure evolution
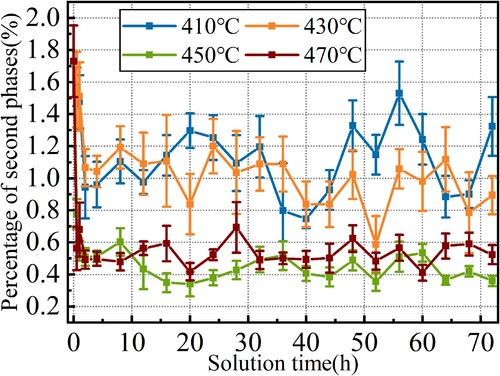
Since the alloy elements are the basis of the aging strengthening, during solution treatments, the dissolving of the second phase is vital. Their proportions at different solution temperatures and holding times were statistically analysed via the method described in section 2.2, the results of which are shown in . At different solution temperatures, the evolution laws of second phases are similar. Their proportions decrease fast at the initial stage of solution treatments. The initial percentage of second phases before solution is 1.73%. From 410°C to 470°C, the percentages were decreased by 44.5%, 39.7%, 70.3% and 71.6% in the first 4 h. After that, the decreasing rates of second phase percentages slowed down and began to fluctuate in a certain range. The fluctuation ranges of 410 and 430°C are larger than that of 450°C and 470°C. While the lowest percentages of second phases are the opposite. At 410°C, holding for 40 h can obtain the lowest percentage of 0.75%. At 430°C, the lowest point is 0.59%, with a holding time of 52 h. When solution at 450°C and 470°C, the lowest percentage can be obtained with a shorter solution time of 16 h, approaching 0.35% and 0.59%, respectively.
Figure 4. Residual second phase percentage vs. time at different solution temperatures.
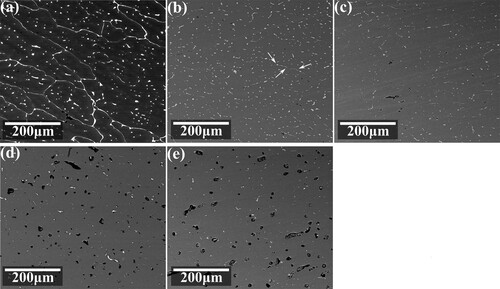
gives a comparison between the as-deposited specimen and those after solution for 72 h at different temperatures. In the as-deposited state, as shown in (a), second phases mainly occupy the grain boundaries and form continuous networks. Inside grains, second phases present as discrete islands ranging from a few to tens of microns. After the solution, these phases are dissolved and transformed into discontinuous rod-like and dot-like shapes. As shown in (b), when the solution is carried out at 410°C, the intergranular distribution characteristics of second phases can still be observed in the specimen. However, their distribution has been transformed from continuous to intermittent chain-like, as indicated by the white arrows in (b). When the solution is carried out at a temperature higher than 430°C, as shown in (c–e), second phase distribution becomes completely discrete, and the intergranular distribution characteristics are no longer visible.
Figure 5. BSE photos of the alloy with different heat treatments: (a) the as-deposited state, after solution for 72 h at (b) 410°C, (c) 430°C, (d) 450°C and (e) 470°C.
Despite the proportion evolution, we also wonder about the chemical composition of the second phase. After heat treatment, the composition of residual second phases was analysed via EDS. For each sample, the EDS analysis was conducted on 20 different residual second phases. In order to make the results comparable, we only considered three main alloying elements: Mg, Cu and Zn. Their relative proportions were calculated for comparison.
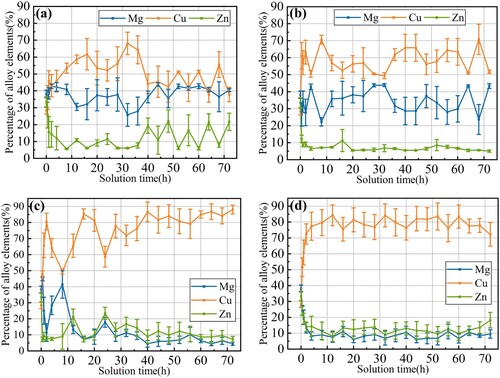
The proportion evolution of these three elements at different temperatures is shown in . At different temperatures, the proportion of Zn gradually generally decreases at first and then tends to be stable near 10% with the extension of solution time. As shown in (c,d), at 450°C and 470°C, the proportion of the Mg element gradually decreased with time, and the final proportion can be lower than that of the Zn element. But when solution at 410 and 430°C, as shown in (a,b), its proportion oscillated near the range of 30%–40%. The proportion of Cu element shows a trend of gradually increasing with time at different temperatures, and Cu element was dominant in the final composition of the second phase.
Figure 6. Alloy element contents in second phases vs. time with different solution temperatures: (a) 410°C, (b) 430°C, (c) 450°C and (d) 470°C.
The diffusion coefficients of Mg, Cu and Zn in the Al matrix at different temperatures can be obtained by [Citation24]:
(1)
(1)
(2)
(2)
(3)
(3)
Where DMg, DCu and DZn are the diffusion coefficients of Mg, Cu and Zn (unit: m2/s), and T is the temperature (unit: K). Based on this, the diffusion coefficients of the three main alloying elements at different temperatures were calculated, as shown in . The Zn element has the highest diffusion coefficient at all temperatures, so the Zn in the second phase has the fastest drop rate during solid solution. The Cu element has the slowest diffusion rate, so the equilibrium content of the Cu element in the residual second phase is the highest.
Mg, Cu and Zn can form a variety of second phases with Al. Significant differences in the equilibrium proportion of the Mg element at different solution temperatures may cause different second-phase transition routes. To determine this, we conducted TEM analysis on the 8 h specimens at different solution temperatures. Selected area diffraction, high-resolution images, and nanoscale EDS were used to identify the type of residual second phases, the results of which are shown in .
Figure 7. Bright-field images, HRTEM images and EDS maps of second phases during solution: (a) 410°C, (b) 430°C, (c) 450°C and (d) 470°C. Subfigures from left to right are bright-filed images, HRTEM images or selected area electron diffraction patterns, and EDS maps, which include the distribution of Al, Zn, Mg, Cu and Fe.
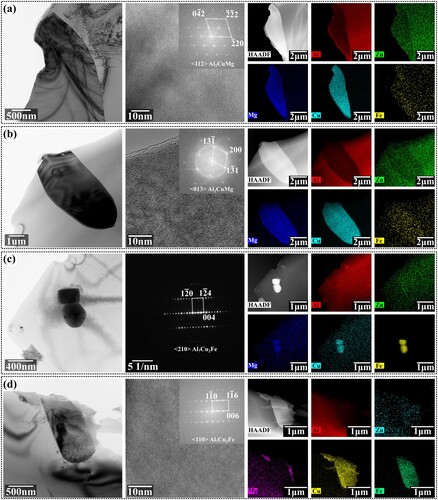
Table 2. Diffusion coefficients of major alloy elements at different temperatures(m2/s).
The results shown in (a,b) indicate that when solution at 410°C and 430°C, the original main second phase η(Mg(Zn, Cu, Al)2) first transformed into the S(Al2CuMg) phase before dissolution. The main residual second phase became the S(Al2CuMg) phase due to the limited diffusion rate of the Mg element. When solution at 450°C and 470°C, as shown in (c and d), since both Zn and Mg had fast diffusion rates, the original main second phase η(Mg(Zn, Cu, Al)2) phase first transformed into Al7Cu2Fe phases before dissolution. The main residual second phase became the Al7Cu2Fe phase. No transformation from η(Mg(Zn, Cu, Al)2) phase to θ(Al2Cu) phase was found in current research.
3.1.2. Formation of defects
During solution, despite the phase transformation and dissolution of the second phase, also shows that pore defects present in different degrees. As the solution temperature increases, the size of the pores gradually increases. When the solution was carried out at 410 and 430°C, as shown in (b and c), the size of the pores was small, with a diameter of about 4 μm. When the solid solution was carried out at 450 and 470 °C, as shown in (d,e), the size of the pores grew to larger than 10 μm, and these pores even appeared to connect with each other at 470°C. A small amount of residual second phases could be observed on the edge of most pores.
The generation of these pore defects is mainly caused by the Kirkendall effect. During the solution process, alloying elements in the second phase diffuse into the Al matrix driven by the concentration gradient, while Al atoms in the matrix diffuse into the second phase reversely. Material continuity is maintained only when these bidirectional diffusions can balance each other. However, the diffusion activation energy of alloying elements Mg and Zn in the second phase is much lower than that of Al. Their diffusion to the matrix is significantly faster than that of Al into the second phase. Such an unbalanced diffusion causes vacancy aggregation in the second phase and gradually forms microscopic pores, namely, Kirkendall pores.
The aggregation rate of vacancies in this process can be described by the following equation [Citation25]:
(4)
(4) Where
is the vacancy diffusion flux of the second phase (unit: m−2·s−1),
is the vacancy diffusion flux of matrix (m−2·s−1),
is the diffusion coefficient of alloying elements in the second phase (m2/s),
is the diffusion coefficient of Al in the second phase (m2/s),
is the diffusion coefficient of alloying elements in the matrix (m2/s),
is the diffusion coefficient of Al in the matrix (m2/s),
is the concentration of alloying elements in the second phase (m−3) and
is the concentration of alloying element Al (m−3).
With the increase of solidification temperature, the diffusion speed of alloying elements increases significantly, and it is known from Equationequation (4)(4)
(4) that the degree of interface diffusion imbalance intensifies, resulting in the increase of vacancy aggregation. So, the pore defects are more serious when solution at higher temperatures. At the same time, micro-porosity formed during the solidification process can act as the nucleation site of the pore defects. In addition, the content of residual hydrogen in additive-manufactured aluminium alloys is generally high. It will also diffuse into pores during solution, further promoting the growth of pore defects [Citation26,Citation27].
The evolutions of pore defects were quantitatively analysed via the method described in Section 2.2. Their proportions at different solution temperatures and times are shown in .
Figure 8. The evolution of pore defects at different solution temperatures.
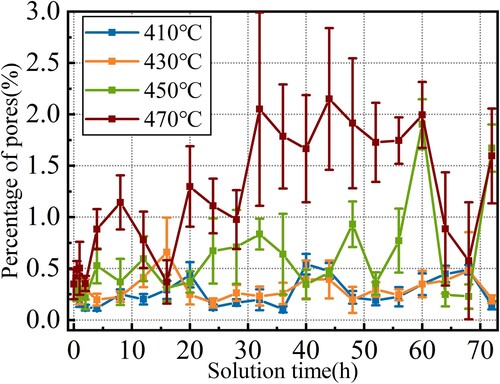
As the solution time extends, the proportion of pores increases at different solidification temperatures. With a high solution temperature, the growth rate of pore defects also increases. The variation trends of pores at 410 and 430°C are similar. Comparing and , we can find that the evolution of second phase proportions is opposite with pore defects. Higher temperatures and longer times promote second phase dissolving but lead to severe pore defects. Considering both of them, a solution treatment at 450°C for 16 h can achieve a relatively balanced state. gives the backscattered electron image of the specimen treated with this parameter.
Figure 9. The effect of the 450°C/16 h solution treatment.
3.2. The design and verification of the step solution treatment
In the single-stage solution, there is an irreconcilable contradiction between the dissolution effect of the second phase and the generation of pore defects. shows that the specimen treated with optimised parameter 450°C/16 h also inevitably has considerable contents of pores, which is harmful to the mechanical properties of the deposited Al-Zn-Mg-Cu alloy. In order to solve this problem, we proposed a step solution treatment in this section.
According to the evolution law of alloy elements in the residual second phases, only Zn can diffuse effectively at 410 and 430°C. As the diffusion activities are relatively weak, pore defects are suppressed. At 450 and 470°C, both Zn and Mg can diffuse effectively, and the diffusion activities become intense. So, the pore defects begin to appear densely, and the number of pores increases with the extension of time. Avoiding multiple alloying elements having high diffusion rates at the same time period and shortening solution time may be an effective way to inhibit the generation of pore defects. To achieve that, we can divide the solution process into two sections, i.e. applying a step solution, as shown in . At first, we set the solution temperature at a low level. During this period, the diffusion of Mg and Cu elements is inhibited. After the Zn element is fully diffused into the matrix, the solution temperature is increased to a higher level. The diffusion of Mg and Cu can begin. We can achieve the ordered diffusion of different alloy elements by this step solution, and the dense non-equilibrium diffusion at the interface between second phases and matrix can be avoided.
Figure 10. The step solution treatment.
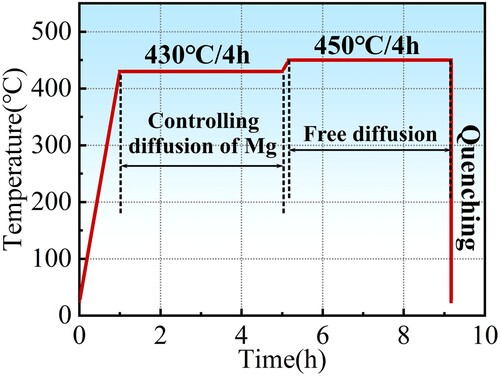
As for the choice of solution parameters, the first stage of the solution should guarantee the diffusion of Zn while inhibiting others, and the solution time should be minimised. According to , at 410°C, it takes about 8 h to approach the equilibrium concentration of Zn, while the time can be reduced to less than 4 h at other temperatures. At a temperature below 430°C, the contents of Mg is basically unchanged. And there are no significant differences in the contents of pore defects between 410 and 430°C in the first 8 h. So, 430°C/4 h is a good choice for the first stage, according to current evidence.
The second stage of the solution should sufficiently promote the dissolution of the second phase. According to and , the evolution laws of alloy contents in the second phases are similar at 450 and 470°C. However, the velocity of pore defect generation is much faster at 470°C. So, a solution at 450°C is a better choice. Referring to the evolution of Mg contents at 450°C, it can be found that in the first 4 h, The Mg concentration has been reduced to the equilibrium level. So, a solution time of 4 h is sufficient for the second stage. The full heat treatment process curve is shown in . After the solution, the samples are quenched in water.
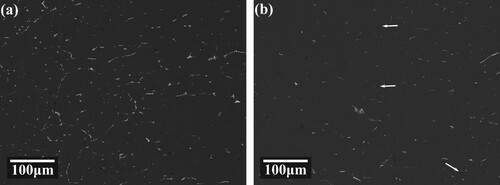
The step solution treatment is followed by artificial aging at 120°C for 24 h to stabilise the microstructures. shows the BSE photos of the specimen treated by the first stage of solution and the full step solution, respectively. After the first stage, as shown in (a), parts of the continuous second phases on the grain boundaries are still visible. And almost no pore defects were generated. When the second level solution treatment was completed, as shown in (b), the residual second phases were been fully dissolved. The contents of residual phases are similar to the level of 450°C/16 h (shown in ). As indicated by the white arrows in the figure, there are a small amount of solution pore defects generated, but it is significantly reduced compared with , which proves the effectiveness of the step solution.
Figure 11. BSE images of the sample at different stages of step solution treatment: (a) 430°C/4 h; (b) 430°C/4 h+450°C/4 h.
Next, the changes of residual second phases, pore defects, and alloy elements during the step solution process are quantitatively analysed using the same method described in sections 2 and 3.1.1. As shown in (a), compared with the as-deposited specimens, 43.9% of the second phases have been dissolved during the first stage of solution, and 82% after the second stage. The residual second phase contents of the single-stage solution (450°C/16 h) and step solution are almost identical, while the solution time was saved by 50%. (b) gives the contents of pore defects. For the step solution, the pore proportion reaches 0.12% after the first stage and 0.14% after the second stage, and the pore proportion gets to 0.31% after the single-stage solution (450°C/16 h), indicating a reduction of 54.8%.
Figure 12. The effects of step solution treatment on (a) the contents of residual second phases, (b) the proportions of pore defects and (c) the chemical composition of second phases.
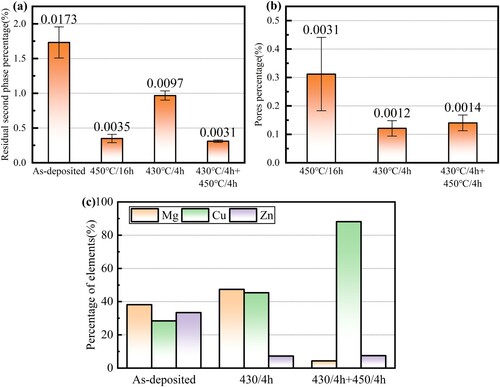
(c) verifies the diffusion behaviour of alloy elements during the step solution process. At the end of the first stage, the proportion of Mg is still high, reaching more than 40%, while the proportion of Zn has dropped to the equilibrium level, indicating the full diffusion of Zn. At the end of the second stage, the proportion of Mg decreased significantly, while Zn remained unchanged, indicating the full diffusion of Mg. Thus, the step solution has successfully achieved the aim of controlling the diffusion order of the main alloy elements in the as-deposited Al-Zn-Mg-Cu alloy.
Although the operating temperatures of the two stages of the step solution differ only by 20°C, this difference has significant effects. The first stage successfully achieved two purposes: (1) dissolution of second phases to some extent and (2) adequate diffusion of Zn from second phases to the matrix. In the second stage, since the content of Mg and Cu is lower in the alloy system. Although the solution temperature is higher, the diffusion activity is still much weaker than in the situation where Zn, Mg and Cu diffuse at the same time. Second phases can be sufficiently dissolved while the diffusion imbalance is also suppressed. Benefiting from that, the step solution shows much better than the isothermal single-stage solution.
Next, the transformation route of the residual second phase at different stages during the step solution process was investigated via HRTEM and nanoscale EDS. As shown in (a), at the end of the first stage of the step solution, the structures of most residual phases have been partially transformed. According to the EDS map, almost all Zn has diffused out in the lower left corner of the second phase, leading to a high concentration of Cu and Mg. High-resolution (HR) images are captured in zones A and B, and the calibration of FFT patterns proves that zone A is the S (Al2CuMg) phase with orthorhombic structures, while zone B is η (Mg(Zn, Cu, Al)2) phase with hexagonal structures. After completion of the second stage, as shown in (b), the main residual second phase has been transformed into the Al7Cu2Fe phase. As indicated by white arrows in the EDS map, an untransformed η (Mg(Zn, Cu, Al)2) phase containing more Zn elements was also observed in the gap of Al7Cu2Fe, which indicates a direct transformation from η (Mg(Zn, Cu, Al)2) phase to Al7Cu2Fe phase.
Figure 13. The microstructure evolution during step solution: (a) bright-filed image, (b-c) EDS mappings, (d-g) HR images and corresponding FFT patterns of 430°C/4 h specimen; (h) bright-filed image, (i) HR image and (j) EDS mappings of 430°C/4 h+450°C/4 h specimen.
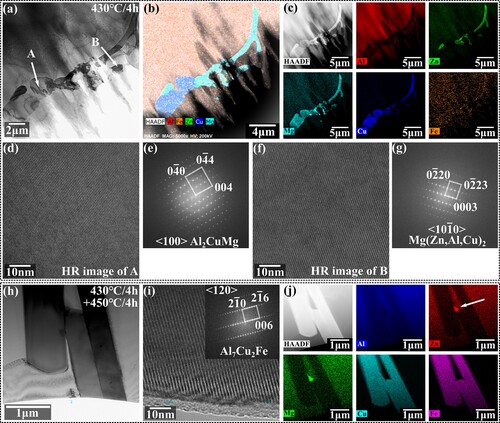
It can be seen that controlling the diffusion order leads to the generation of the intermediate product S(Al2CuMg) phase. The phase transformation route during the step solution becomes η(Mg(Zn, Cu, Al)2) → S(Al2CuMg) phase at the first stage, and η(Mg(Zn, Cu, Al)2), S(Al2CuMg) phase → Al7Cu2Fe phase during the second stage.
3.3. Aging treatment
The aging response was evaluated via microhardness, and the results of all samples are summarised in . Aging at all tested temperatures contributes to significant microhardness improvement in the first 5 h, showing a high aging driving force. When aged at 100, 120 and 140°C, the microhardness of the samples increases at first and then fluctuates between 200HV0.2 and 220HV0.2. The hardness level of 120°C is slightly higher than that of 100 and 140°C aging. According to the hardness evolution law, the overaging tendencies at these temperatures are not obvious. When aged at 160°C, the microhardness increases with time at first, reaching the maximum hardness at 12 h, and then decreases gradually to about 164HV0.2 at 60 h, showing a significant over-aging tendency. This indicates that the growth rate of the precipitated phase at this temperature is faster than at 100, 120 and 140°C.
Figure 14. The microhardness evolution during aging at different temperatures.
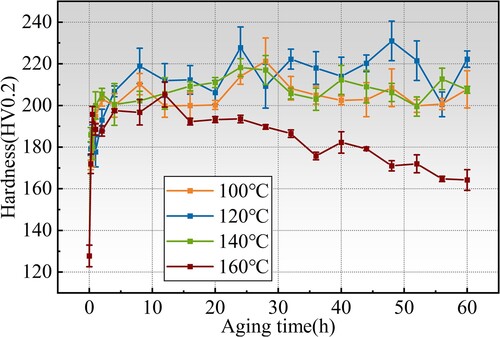
Comparing the maximum hardness at different temperatures, when the samples were aged at 100°C, the hardness reached 221HV0.2 at 28 h, which is 73.2% compared with the hardness after solution. When the samples were aged at 120°C, there were two hardness peaks at 24 and 48 h, respectively, which were 228HV0.2 and 231HV0.2. Compared with the hardness after solution, an increase of 78.3% and 80.8% was witnessed. However, considering the existence of measurement error, the hardness of these two peaks is very small. When the samples were aged at 140°C, the hardness reached the maximum value of 218HV0.2 at 24 h, showing a 70.8% increase compared with the hardness after solution. Considering the maximum hardness, the time to reach the peak hardness, and the over-aging tendency, it is reasonable to choose 120°C /24 h as a preferable aging process. So far, we have determined that the reasonable heat treatment process for as-deposited Al-Zn-Mg-Cu alloy should be 430°C/4 h+450°C/4 h step solution with an immediately aging at 120°C for 24 h.
3.4. Microstructures and mechanical properties after heat treatment
Single-pass multi-layered specimens treated with this process are used for further microstructure and mechanical property analysis. At first, EBSD scanning was conducted to examine the changes in grain morphology and orientation during heat treatment. and show the results before and after the heat treatment, respectively.
Figure 15. Grain morphologies and textures before heat treatments: (a) IPF map; (b) (100) pole figure; (c) (110) pole figure; (d) (111) pole figure; (e) misorientation distribution.
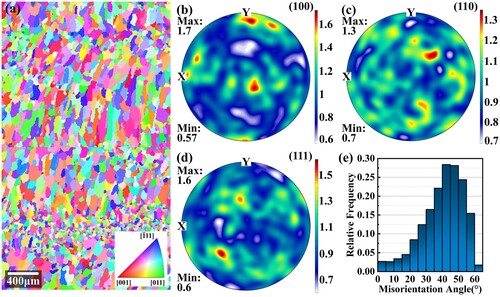
Figure 16. Grain morphologies and textures after heat treatments: (a) IPF map; (b) (100) pole figure; (c) (110) pole figure; (d) (111) pole figure; (e) misorientation distribution.
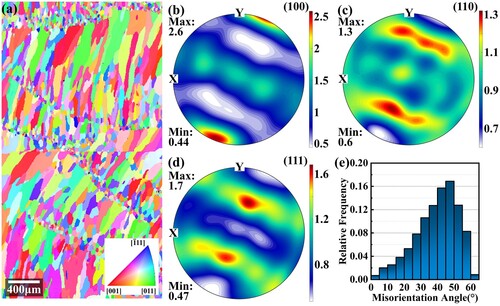
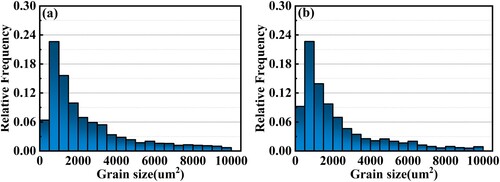
In the as-deposited state, as shown in , the alloy shows an alternating distribution of fine equiaxed and columnar grains and presents very weak < 100 > textures. After heat treatments, as shown in , the grain morphologies are similar. However, the size and aspect ratio of columnar grains have increased. The maximum pole density of the (100) pole figure also increases. The misorientation angle distribution diagram shows that the amount of large angle grain boundaries decreases, although they are still dominant. The grain size distribution is statistically summarised further in . After the heat treatment, the average grain size increases from 2348.5 μm2 to 4578.6 μm2, and the proportion of grains in the range of 0–1500 μm2 decreases significantly. There are two reasons for the grain growth occurring in heat treatment: (1) During heat treatment, as the temperature is elevated, the atoms gain enough energy to migrate, which allows grain boundaries to move. The small short columnar crystals tend to merge with their neighbours to reduce the overall system energy. (2) The step solution process promotes the dissolution of residual second phases, which mostly occupy the grain boundaries. After dissolution, their pinning effects on the grain boundary are weakened, and grain boundary migration becomes possible.
Figure 17. Grain size distribution before and after the heat treatment.
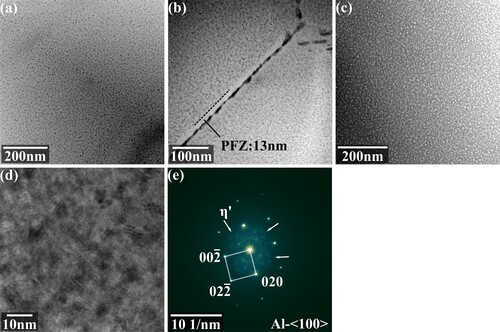
Then, the precipitates were examined by TEM. As shown by (a), a large amount of dispersed fine precipitates can be observed when rotating the Al matrix to the < 100 > zone axis. The precipitates on the grain boundary are larger and form a continuous band, as shown in (b). Based on three-dimensional atom probe microscopy, Zhao et al. [Citation28] found that in Al-Zn-Mg-Cu alloys, after heat treatment, there is still microsegregation of solute atoms at grain boundaries after solid solution, which reduced the incubation period for precipitation. So, the aging process at grain boundaries was faster, and it was easier to form larger and continuous phases. At the same time, since the grain boundary-precipitates interface could act as vacancy traps, the diffusion of alloying elements was restricted, and a precipitate-free zone (PFZ) with a width of 13 nm can also be observed on the grain boundary in (b). (c) shows a high-angle dark field image of the matrix, and the higher contrast of precipitates comes from its enriched alloying elements. These precipitated phases were then observed further via HR mode. As shown in (d), the precipitates maintain coherence with the matrix, and some strain contrast can be found. The average diameter of precipitates was about 5 nm. The FFT pattern of (d) is shown in (e), and after calibration, the precipitates were found to be η’ phase, which is the main metastable phase during the peak aging period of Al-Zn-Mg-Cu alloys [Citation29].
Figure 18. Precipitates after the heat treatment: (a) precipitates in the grain; (b) precipitates near the grain boundary; (c) dark field image of precipitates; (d) high-resolution image of precipitates; (e) FFT pattern.
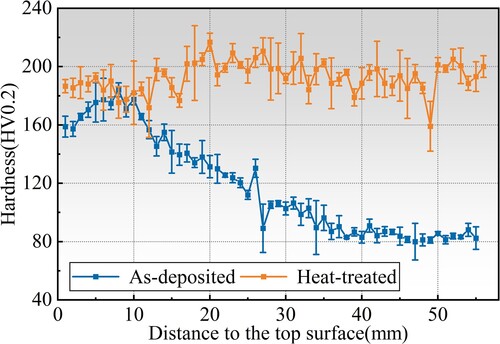
Next, the micro-regional mechanical properties after heat treatment were evaluated via a microhardness test, and the results are shown in . The hardness was tested with a spacing of 1 mm from the bottom to the top of the specimen. The average hardness of the specimen reached 193HV0.2. Compared with the as-deposited state, an 89.5% increase is witnessed, and the uniformity of hardness in various regions of the sample after heat treatment was also significantly improved. This is because the size and distribution uniformity of precipitated phases is improved.
Figure 19. Hardness distribution along the height direction after the heat treatment.
At last, macro mechanical properties were evaluated by tensile tests, and the results are shown in . The yield strength, tensile strength and elongation of the alloy after the 450°C/4 h+430°C/4 h+120°C/24 h heat treatments reach 482 MPa, 564 MPa and 7.61% in the horizontal direction, and reach 468 MPa, 537 MPa and 5.4% in the vertical direction. The mechanical performance in the horizontal direction is better than in the vertical direction. The tensile properties after the 450°C/16 h + 120°C/24 h heat treatments were also compared. The tested yield strength, tensile strength, and elongation are 467 MPa, 510 Pa, and 1.3% in the horizontal direction, and 461 MPa, 469 MPa, and 1.9% in the vertical direction. Since the pore defects are avoidless, the performance gap between single-stage and step heat treatments is large. The average yield strength, tensile strength and elongation after step heat treatment are increased by 201.6%, 113.3% and 85.7% compared with as-deposited alloy. This was attributed to the control of pore defects, grain refinement, dissolution of coarse residual phase and optimisation of size and distribution precipitates. compares the heat-treated alloy and those in other states. The alloy shows inferior elongation than the forged and SLMed counterparts, although the strength shows some advantages. Compared with spray-formed and extruded alloys, which are properly heat-treated, the strength and elongations in this study are both lower. The performance gap can be reduced in the future via further control of the original as-deposited microstructures and heat treatment parameter optimizations. The tensile fractures of the horizontal and vertical tensile specimens after step heat treatment are given in . There are both dimples and smooth shearing surfaces on the fracture, indicating a mixed microvoid coalescence and shearing fracture mode. On both horizontal and vertical fractures, the boundaries of columnar grains are visible.
Figure 20. Tensile properties before and after the heat treatment: (a) Tensile properties; (b) Tensile curves.
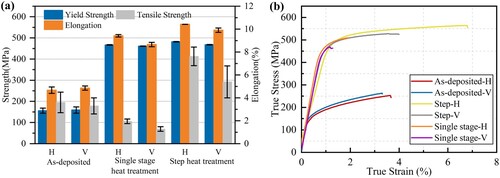
Figure 21. Tensile fractures after the heat treatment: (a) horizontal fracture, (b) vertical fracture.
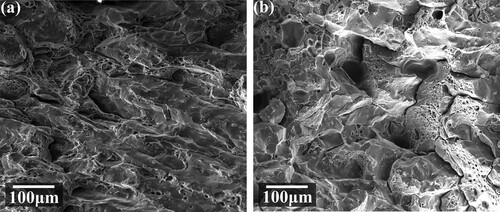
Table 3. A comparison between heat-treated alloy and its counterparts fabricated via other techniques.
4. Conclusions
In this work, Solution treatments with different parameters were applied to investigate the evolution of defects and second phases. Based on that, a step solution treatment with good defect suppression effects was proposed. The conclusions are as follows:
There is an interplay between the second phase dissolution and pore defect formation in the single-stage solution process of the as-deposited Al-Zn-Mg-Cu alloy. With the increase of solution temperature, the equilibrium proportion of residual phases decreases, but the proportion of pore defects increases significantly. During the solution, Zn has a faster diffusion rate at all test temperatures, while Mg diffusion is inhibited below 430°C, and Cu element diffuses slowly at all temperatures. It is the unbalanced diffusion of the Mg element and Zn element that causes the generation of pore defects when the solution is performed above 450°C.
The 430°C/4 h + 450°C/4 h step solution can control the diffusion of the Zn element, Mg element and Cu element, reducing the imbalance of second phase/matrix interface diffusion. The step solution reduces the pore defects by about 54.8% while keeping the effect of second-phase dissolution unchanged.
When aging at 140°C and below, the hardness increases rapidly with aging time and then reaches a stable value, and the over-aging stage is not obvious. When single-stage aging at 160°C, the hardness increases first and then decreases with aging time, and the reasonable aging parameter is 120°C/24 h;
The grain size of the as-deposited Al-Zn-Mg-Cu alloy was increased during heat treatment. The second phase (mainly η(Mg(Zn, Cu, Al)2) phase) in the first stage of step solution was incompletely transformed into the S(Al2CuMg) phase. In the second stage, the S(Al2CuMg) phase and residual η(Mg(Zn, Cu, Al)2) phase were transformed into the Al7Cu2Fe phase. A large amount of fine η′ phase precipitated in the matrix after heat treatment, and the average hardness reached 193HV0.2. The average yield strength was 475 MPa, and the elongation reached 6.5%, showing 201.6% and 85.7% improvement compared with the as-deposited state, respectively.
The findings in this work shed light on the heat treatment design routine of defect-sensitive aluminium alloy fabricated by wire-arc DED. However, a comprehensive investigation and further parameter optimisation of the step solution are still needed in the future. Subsequent artificial aging can also be optimised to achieve better mechanical performances.
Disclosure statement
No potential conflict of interest was reported by the author(s).
Data availability statement
Data available on request from the authors.
Additional information
Funding
References
- Zhou Y, Qi Z, Cong B, et al. Sc/Zr microalloying on strength-corrosion performance synergy of wire-arc directed energy deposited Al-Mg. Virtual Phys Prototyp. 2024;19:e2358981. doi:10.1080/17452759.2024.2358981
- Guo Y, Yan Y, Hu J, et al. Sub-rapid-solidification dominated microstructure modification and strength increment for wire-arc directed energy deposited Al-Ce-Mg alloys. Addit Manuf Front. 2024;3:200131. doi:10.1016/j.amf.2024.200131
- Galy C, Le Guen E, Lacoste E, et al. Main defects observed in aluminum alloy parts produced by SLM: from causes to consequences. Addit Manuf. 2018;22:165–175. doi:10.1016/j.addma.2018.05.005
- Kou S. A criterion for cracking during solidification. Acta Mater. 2015;88:366–374. doi:10.1016/j.actamat.2015.01.034
- Qi Z, Cong B, Qi B, et al. Properties of wire + arc additively manufactured 2024 aluminum alloy with different solution treatment temperature. Mater Lett. 2018;230:275–278. doi:10.1016/j.matlet.2018.07.144
- Bai JY, Fan CL, Lin SB, et al. Mechanical properties and fracture behaviors of GTA-additive manufactured 2219-Al after an especial heat treatment. J Mater Eng Perform. 2017;26(4):1808–1816. doi:10.1007/s11665-017-2627-5
- Cao Q, Zeng C, Qi B, et al. Excellent isotropic mechanical properties of directed energy deposited Mg-Gd-Y-Zr alloys via establishing homogeneous equiaxed grains embedded with dispersed nano-precipitation. Addit Manuf. 2023;67:103498. doi:10.1016/j.addma.2023.103498
- Gu J, Ding J, Williams SW, et al. The strengthening effect of inter-layer cold working and post-deposition heat treatment on the additively manufactured Al-6.3Cu alloy. Mater Sci Eng A. 2016;651:18–26. doi:10.1016/j.msea.2015.10.101
- Qi Z, Qi B, Cong B, et al. Microstructure and mechanical properties of wire + arc additively manufactured 2024 aluminum alloy components: as-deposited and post heat-treated. J Manuf Process. 2019;40:27–36. doi:10.1016/j.jmapro.2019.03.003
- Li J, Cheng X, Li Z, et al. Improving the mechanical properties of Al-5Si-1Cu-Mg aluminum alloy produced by laser additive manufacturing with post-process heat treatments. Mater Sci Eng A. 2018;735:408–417. doi:10.1016/j.msea.2018.08.074
- Fang X, Li H, Li X, et al. Effect of post heat treatment on the microstructure and mechanical properties of wire-arc additively manufactured A357 alloy components. Mater Lett. 2020;269:127674–127674. doi:10.1016/j.matlet.2020.127674
- Eimer E, Ganguly S, Czink S, et al. Effect of inter layer cold work on 2024 aluminium alloy produced by wire directed energy deposition. Mater Sci Eng A. 2023;880:145272. doi:10.1016/j.msea.2023.145272
- Zhou S, Wu K, Yang G, et al. Microstructure and mechanical properties of wire arc additively manufactured 205A high strength aluminum alloy: the comparison of as-deposited and T6 heat-treated samples. Mater Charact. 2022;189:111990. doi:10.1016/j.matchar.2022.111990
- Dong B, Cai X, Lin S, et al. Wire arc additive manufacturing of Al-Zn-Mg-Cu alloy: microstructures and mechanical properties. Addit Manuf. 2020;36:101447. doi:10.1016/j.addma.2020.101447
- Wang L, Wu T, Wang D, et al. A novel heterogeneous multi-wire indirect arc directed energy deposition for in-situ synthesis Al-Zn-Mg-Cu alloy: process, microstructure and mechanical properties. Addit Manuf. 2023;72:103639. doi:10.1016/j.addma.2023.103639
- Yuan T, Ren X, Chen S, et al. Grain refinement and property improvements of Al–Zn–Mg–Cu alloy by heterogeneous particle addition during wire and arc additive manufacturing. J Mater Res Technol. 2022;16:824–839. doi:10.1016/j.jmrt.2021.12.049
- Yuan T, Ren X, Chen S, et al. Al–Zn–Mg–Cu alloy with both high strength and high plasticity fabricated with wire arc additive manufacturing. Sci Technol Weld Joining. 2023;28:81–88. doi:10.1080/13621718.2022.2117532
- Guo X, Xue P, Li H, et al. Microstructures and properties of wire-arc additively manufactured ultra-high strength aluminum alloy under different heat treatments. J Mater Res Technol. 2023;24:1663–1678. doi:10.1016/j.jmrt.2023.03.100
- Qie M, Wei J, He C. Microstructure evolution and mechanical properties of wire-arc additive manufactured Al–Zn–Mg–Cu alloy assisted by interlayer friction stir processing. J Mater Res Technol. 2023;24:2891–2906. doi:10.1016/j.jmrt.2023.03.205
- Girelli L, Tocci M, Gelfi M, et al. Study of heat treatment parameters for additively manufactured AlSi10Mg in comparison with corresponding cast alloy. Mater Sci Eng A. 2019;739:317–328. doi:10.1016/j.msea.2018.10.026
- Miao J, Chen J, Ting X, et al. Effect of solution treatment on porosity, tensile properties and fatigue resistance of Al–Cu alloy fabricated by wire arc additive manufacturing. J Mater Res Technol. 2024;28:1864–1874. doi:10.1016/j.jmrt.2023.12.114
- Mclean N, Bermingham MJ, Colegrove P, et al. Effect of hot isostatic pressing and heat treatments on porosity of wire arc additive manufactured Al 2319. J Mater Process Technol. 2022;310:117769. doi:10.1016/j.jmatprotec.2022.117769
- Fu R, Lu W, Guo Y, et al. Achieving high strength-ductility of Al-Zn-Mg-Cu alloys via hot-wire arc additive manufacturing enabled by strengthening precipitates. Addit Manuf. 2022;58:103042. doi:10.1016/j.addma.2022.103042
- Xu D, Li Z, Wang G, et al. Phase transformation and microstructure evolution of an ultra-high strength Al-Zn-Mg-Cu alloy during homogenization. Mater Charact. 2017;131:285–297. doi:10.1016/j.matchar.2017.07.011
- Yu J, Kim JY. Effects of residual S on Kirkendall void formation at Cu/Sn–3.5Ag solder joints. Acta Mater. 2008;56:5514–5523. doi:10.1016/j.actamat.2008.07.022
- Gu J, Yang S, Gao M, et al. Micropore evolution in additively manufactured aluminum alloys under heat treatment and inter-layer rolling. Mater Des. 2020;186:108288–108288. doi:10.1016/j.matdes.2019.108288
- Dai W, Guo W, Xiao J, et al. Tailoring properties of directed energy deposited Al-Mg alloy by balancing laser shock peening and heat treatment. J Mater Sci Technol. 2024;203:78–96. doi:10.1016/j.jmst.2024.03.051
- Zhao H, De Geuser F, Kwiatkowski da Silva A, et al. Segregation assisted grain boundary precipitation in a model Al-Zn-Mg-Cu alloy. Acta Mater. 2018;156:318–329. doi:10.1016/j.actamat.2018.07.003
- Chung TF, Yang YL, Huang BM, et al. Transmission electron microscopy investigation of separated nucleation and in-situ nucleation in AA7050 aluminium alloy. Acta Mater. 2018;149:377–387. doi:10.1016/j.actamat.2018.02.045
- Qi T, Zhu H, Zhang H, et al. Selective laser melting of Al7050 powder: melting mode transition and comparison of the characteristics between the keyhole and conduction mode. Mater Des. 2017;135:257–266. doi:10.1016/j.matdes.2017.09.014
- Martin JH, Yahata BD, Hundley JM, et al. 3D printing of high-strength aluminium alloys. Nature. 2017;549:365–369. doi:10.1038/nature23894
- Otani Y, Sasaki S. Effects of the addition of silicon to 7075 aluminum alloy on microstructure, mechanical properties, and selective laser melting processability. Mater Sci Eng A. 2020;777:139079. doi:10.1016/j.msea.2020.139079
- Liu Y, Jiang D, Li B, et al. Heating aging behavior of Al-8.35Zn-2.5Mg-2.25Cu alloy. Mater Des. 2014;60:116–124. doi:10.1016/j.matdes.2014.03.060
- Liu Y, Liang S, Jiang D. Influence of repetitious non-isothermal aging on microstructure and strength of Al-Zn-Mg-Cu alloy. J Alloys Compd. 2016;689:632–640. doi:10.1016/j.jallcom.2016.08.017
- Yu H, Wang M, Sheng X, et al. Microstructure and tensile properties of large-size 7055 aluminum billets fabricated by spray forming rapid solidification technology. J Alloys Compd. 2013;578:208–214. doi:10.1016/j.jallcom.2013.05.117