
 ?Mathematical formulae have been encoded as MathML and are displayed in this HTML version using MathJax in order to improve their display. Uncheck the box to turn MathJax off. This feature requires Javascript. Click on a formula to zoom.
ABSTRACT
The current designs of low-frequency acoustic absorption metamaterials suffer from inadequate prediction accuracy and low efficiency. Herein, by integrating impedance theory with artificial neural networks, we propose an optimisation method of unit impedance correction (UIC). Meanwhile, a mutated honeycomb structure with teardrop-shaped apertures (MHSTA) fabricated by stereolithography is proposed, which can enhance the low-frequency coupling performance through rationally arranging the relative positions of the apertures. To verify prediction ability of the UIC method, the 50 mm-thickness typical structures of MHSTA are designed for two low-frequency ranges (220–500 Hz and 230–550 Hz). Compared with the simulation, the UIC result can reach the maximum relative error of 3.9% and the maximum absolute error of 0.033, which ensures the accurate prediction commendably. The experiment also demonstrates that the acoustic absorption coefficients are highly consist with the UIC result. This work provides a novel strategy of precise design for low-frequency acoustic absorption metamaterials.
1. Introduction
Due to the poor low-frequency acoustic absorption performance, large scale and other issues of traditional acoustic absorption materials [Citation1–3], low-frequency noise control below 500 Hz faces the challenges of thinner size and broadband acoustic absorption. Acoustic metamaterials possessing the ability to control waves exhibit tremendous potential in the deep subwavelength acoustic field. Membrane-mass resonance structures [Citation4–9] modulate the resonant frequency by means of decorative mass blocks, which exhibit strong acoustic performance at low frequencies. However, the membranes are fragile and the tension of which is struggled to control. Even more, membrane deteriorates quickly and cannot be served in severe conditions, which hampered the practical engineering application. In addition, triply periodic minimal surface [Citation10] structures, hierarchical structures [Citation11] and multi-layer perforated structures [Citation12] also possessing excellent sound absorption properties. However, the relatively fixed shape and size of the units in these structures are less flexible, resulting in small thicknesses that cannot be realised when acting at low frequencies. Even more, these structures will become quite complicated, which brings difficulties in manufacturing, therefore they are more suitable for medium and high-frequency noise control. Moreover, as an alternative, the multi-unit coupled acoustic absorption metamaterials based on Helmholtz [Citation13–20] achieving excellent low-frequency noise control were designed and manufactured for the practical applications. Lv et al. proposed a deep-subwavelength-scale ultrasparse coiled-up acoustic metamaterial. With the thickness approximately 1/10 of the operating wavelength, the metamaterial which includes six coiling-up cavities can reach an average absorption of 0.93 in 226–304 Hz [Citation18]. Zhang et al. developed a hexagonal honeycomb sandwich panel showing casing rough embedded necks, which enables thickness reduction through the adjustment of their relative roughness. Within 282–480 Hz, this 70 mm-thick structure exhibited acoustic absorption surpassing 0.9 [Citation19]. Ji et al. developed a metamaterial structure with the variable cross-section Helmholtz resonant cavity. The resonance frequency of the structure could be changed through the dimensions of the neck radius and the cavity cross-section. The structure can achieve an average absorption coefficient of 0.85 in 50–100 Hz with a thickness of 200 mm [Citation21].
However, the utilised theories [Citation22–25] in these studies depend on multiple approximations when dealing with intricate systems. For instance, the shape of the cavity cross-section is disregarded and the emphasis focuses on either the cross-section area (for homogeneous cavities) or the volume (for inhomogeneous cavities) [Citation26,Citation27], which will suffer from a large prediction error when the structure is complex. The recent researches reveal that theoretical prediction deviations can be efficiently resolved using machine learning [Citation28–34]. This method promotes a more precise design of acoustic metamaterials that is aimed at the specified frequency ranges with the desired absorption coefficients. Liu et al. obtained a dataset of 20,000 samples from multi-units coupled FP channels. Two distinct convolutional neural network models were trained independently to accurately predict both the structural parameters and corresponding absorption spectrum. The neural network prediction results achieved a maximum absolute error of 0.065 [Citation35]. Wang et al. introduced a curled FP channel structure with multiple parameters. A probabilistic generation network model was trained using 100,000 samples to obtain accurate predictions with a mean absolute error (MAE) less than 0.06. Additionally, the parameters of the 59 mm-thick structure were optimised based on the specific demand of acoustic absorption coefficients over 0.8 in 250–450 Hz [Citation36]. However, when applied to complicated structures with numerous parameters, such many samples collection is extremely inconvenient.
To realise efficient and accurate design of low-frequency acoustic absorption, a mutated honeycomb structure with teardrop-shaped apertures (MHSTA) is proposed. Wherein, the low-frequency performance of the proposed structure can be enhanced through arranging the relative positions of the apertures. Next, the unit impedance correction (UIC) method is applied to the designed structure to achieve accurate optimisation by integrating impedance theory with artificial neural network (ANN) (the unit model using the UIC method is constructed using a two-layer ANN with 900 samples). As verification, two typical structures of MHSTA are designed for various frequency ranges (220–500 Hz and 230–550 Hz) with a thickness of 50 mm. The experiment demonstrates the acoustic absorption coefficients are over 0.8 within 223–504 Hz. The experimental, simulation and UIC results are highly consistent, indicating that the UIC method facilitates accurate design of low-frequency acoustic absorption metamaterials.
2. Materials and methods
2.1. The constitutions of MHSTA
The final designed unit is exhibited in (a). Wherein, and
denote the thickness of the unit and the wall respectively.
and
denote the lengths of the neck and the inner edge of each small honeycomb cavity respectively.
denotes the radius of the inner tangent circle of the teardrop-shaped neck.
Figure 1. Schematic diagram of MHSTA. (a) Unit structure with related parameters. (b) Various types of unit structures. (c) MHSTA. (d)–(f) Structures of various apertures. (g) Advantageous frequency ranges of units with different n.
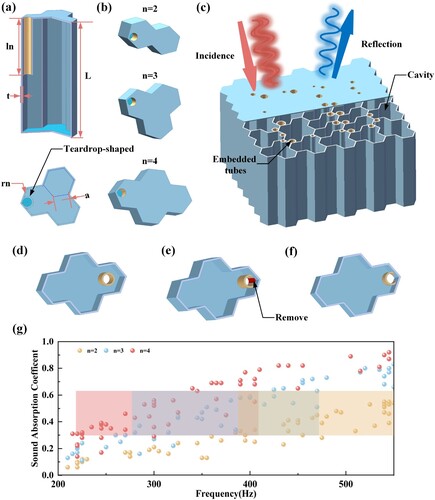
The design of the unit is based on two main considerations: the shape of the aperture and the cavity. In (d–f), three kinds of apertures are compared separately. (d) exhibits cylindrical aperture arranged in the middle of the cavity. Due to lack of support, this aperture is susceptible to deformation during manufacture. Moreover, the lateral force bearing performance is inferior, thus the aperture is easy to be break or damaged during long-term service. In (e), on account of moving the aperture to the edge of the cavity, the neck is in direct contact with the cavity wall thus obtains support for it. The manufacturing performance and using performance of the aperture are improved due to the supporting effect of the walls. Subsequently, removing the red part in (e), a teardrop-shaped aperture is formed in (f), which is shaped to fit perfectly with the walls of the cavity. Such aperture arrangements are more compact with the cavity, improving the capacity resistance for deformation and damage. Meanwhile, due to avoid unnecessary material consumption, the total structural weight can be reduced in weight to some extent. Furthermore, the apertures are arranged at the edge of the cavities so that smaller relative distances between the apertures of different units can be realised, which enhances the low-frequency performance of multiple units coupling structure (detail analysis is revealed in ).
For the individual honeycomb cavities to be tightly aligned, the side lengths of each honeycomb are identical due to the significant symmetry of the honeycomb structure [Citation37]. In contrast to rectangular cavity, the honeycomb enforces limitations on design flexibility due to the inability to alter its cross-section. To achieve variable cross-section, several honeycomb cavities of identical dimensions are integrated into a larger cavity. The MHSTA coupled by multiple units is exhibited in (c). Wherein, the units we used are over-damped units. The absorption coefficients in 0.3–0.65 are moderate in the target frequency band (excessive absorption coefficient engender deterioration of coupling performance). As shown in (g), Three kinds of units (n = 2,3,4) randomly generated 60 groups sound absorption coefficients of corresponding resonant frequencies. It can be observed that three kinds of units possess their advantageous frequency ranges and the combination of the three units can cover 220–550 Hz. It means that using the three kinds of units to achieve optimisation in the range of 220–550 Hz is more advantageous. Similarly, if the target frequency range is more low-frequency, a larger n is needed. This enables the flexibility of frequency band design greatly improved.
2.2. Theory model of the unit in MHSTA
The unit impedance consists of three parts: the neck impedance, the cavity impedance and the corrected impedance. According to the Stinson model [Citation23,Citation38], the neck acoustic impedance can be expressed as:
(1)
(1) where
,
and
are the air density, speed of sound and specific heat ratio.
,
and
denote the complex wave number, heat function and viscosity function of the neck, which can be obtained by the following equations:
(2)
(2)
(3)
(3)
(4)
(4)
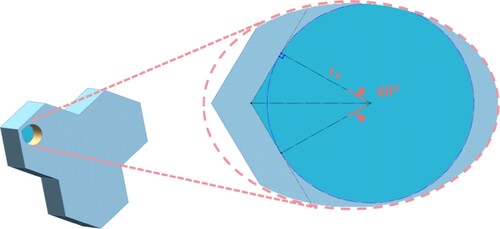
The neck of the unit is a teardrop-embedded neck with an equivalent diameter of .
is the neck cross-sectional area, which can be seen as the sum of the area of 5/6 circles and two right triangles
, as exhibited in .
and
are the thermal and viscous wave numbers, which can be expressed as:
(5)
(5)
(6)
(6) where
,
and
denote the dynamic viscosity of the air, the specific heat at constant pressure and the thermal conductivity of the fluid, respectively. The acoustic impedance of unit cavity can be approximated as [Citation26]:
(7)
(7)
and
refer to the maximum cross-sectional area of the cavity and the volume of the cavity excluding the space occupied by the neck. The cross-sectional area of the neck wall is approximated as a rectangle with a length of 5/6 the circumference of the neck and a width of the wall thickness. Here,
. The correction impedance consists of acoustic mass end correction and acoustic resistance end correction, which can be denoted as:
(8)
(8) where
.
is the cavity diameter ratio of the unit and
is the equivalent diameter of the cavity.
is the acoustic resistance end correction originates from the friction loss of the airflow along the neck boundary [Citation39]. The unit impedance is adjusted based on the perforation rate of the unit neck for MHSTA and the unit impedance rate of unit is [Citation40]:
(9)
(9) where
is the total cross-sectional area of the MHSTA. The coupling of multiple units satisfies Kirchhoff’s law and the total impedance of the whole structure can be expressed as:
(10)
(10)
Figure 2. Schematic diagram of the neck section.
Based on the total impedance, the acoustic absorption coefficients can be further calculated as:
(11)
(11)
The physical parameters involved and their values are described in .
Table 1. Physical parameters and their values.
3. Low-frequency coupling enhancement mechanism analysis
3.1. Simulation model
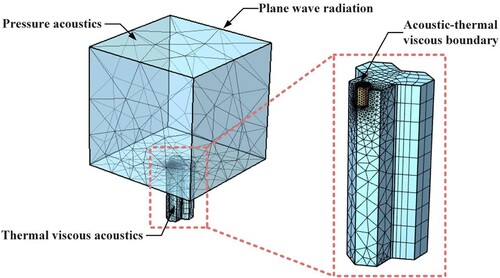
The acoustic-thermal-viscous interaction module is applied in COMSOL Multiphysics 6.1 to establish the simulation. As shown in , pressure acoustic is adopted in the incident air domain. Thermo-viscous acoustic is used in the air inside the structure. The contact surface of two parts of the air domain is the acoustic-thermo-viscous boundary. The plane wave is radiated downwards from the upper surface of the incident air domain. The maximum mesh size of the neck is while the minimum is
.
denotes the thickness of the thermal viscous boundary layer
. Thermal viscosity loss is characterised by two boundary layers, each with a thickness of
.
Figure 3. Simulation model.
3.2. Enhancement mechanism of double-unit coupling with various aperture arrangements
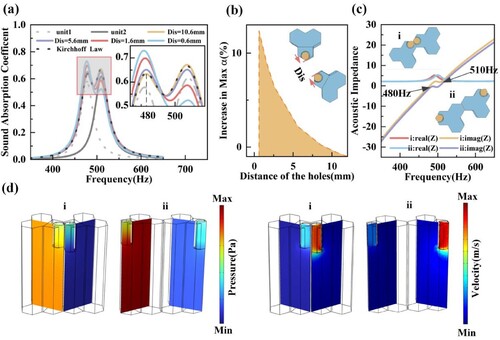
According to Equation (10), the coupling between the units follows Kirchhoff’s law, but the additional effects (such as the relative positions of the apertures) are not considered. In order to illustrate the enhancement coupling effect on the relative positions of the unit apertures in low-frequency, two units with various aperture arrangements are investigated. As illustrated in (a–b), the acoustic performances of the various distances are compared by moving the units to change the relative positions of the apertures while maintaining the units unchanged. The coupling results are in agreement with Kirchhoff’s law when the relative distance of the apertures is large. However, with the relative distance between the apertures becoming closer, the lower frequency absorption peak increases and the higher frequency absorption peak decreases while the resonance frequency remains almost unchanged. Hence, compared with Kirchhoff’s law, the change in the relative position of the apertures causes additional coupling effects. In (b), we observe that the absorption peak of the units with the smallest relative distance of the apertures is 12% higher than that of the coupling result of adopting Kirchhoff’s law at 480 Hz. Therefore, the low-frequency enhancement can be achieved by arranging the apertures at the edge rather than the centre of the cavity. To investigate the effect of the relative positions of the apertures on the impedance of the double-unit coupling structure, the impedance performances of two different unit coupling structures are demonstrated in (c–d). The spacing between the apertures is minimal in structure i while maximal in structure ii (the inset in (c)). As indicated in (c), the acoustic reactance of the structure i and ii are close to each other when they are away from the resonance frequency. However, the acoustic reactance of the structure i is significantly closer to 0 than that of the structure ii near the first resonance frequency (480 Hz). The changes of acoustic resistances are slight across the frequency range. Among them, the peak of acoustic resistance of the structure i shifted marginally towards lower frequencies than that of structure ii. Meanwhile, (d) illustrates the sound pressure and velocity of the two structures at 480 Hz (the left unit of structure ii reaches resonance). Compared with structure ii, the two units in structure i are less differentiated in terms of both sound pressure and velocity due to the smaller aperture distance. Meanwhile, in (c), we observe that the impedance matching effect of structure i is better than structure ii. Hence, the relative position arrangement of the apertures is extremely pivotal to improve the sound absorption of the structure.
Figure 4. Low-frequency enhancement mechanism of double-unit coupled structure. (a) Sound absorption coefficients with various relative positions of the apertures. (b) Enhancement of absorption peak of various relative positions of the apertures compared with Kirchhoff’s law . Wherein
is the absorption peak of various relative positions of the apertures and
is the absorption peak of Kirchhoff’s law. (c) Acoustic impedances of the structure i and ii. (d) Pressure and velocity of the structure i and ii at 480 Hz.
3.3. Broadband and uniform enhancement of multi-unit coupling
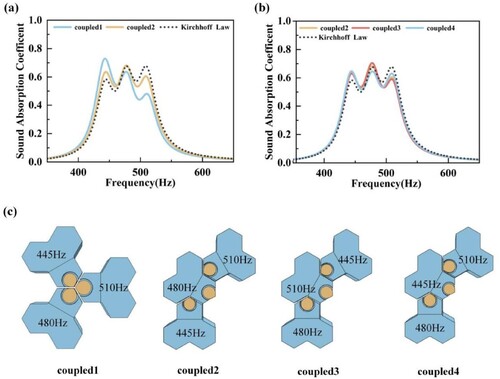
To study the influence of the relative position of the apertures on the multi-unit coupling performance, the absorption curves of four coupling layouts (denoted as the coupled 1–4 in (c)) with three units are compared. Wherein, the apertures are the most concentrated in the coupled 1 while dispersed in the coupled 2–4. As illustrated in (a), both coupled 1 and coupled 2 can achieve low-frequency enhancement compared with Kirchhoff’s law. The coupled 2 only reduces the absorption near the third resonance frequency, but the coupled 1 reduces the absorption coefficients near both the second and third resonance frequencies while only enhances the absorption near the lowest resonance frequency. Therefore, the dispersed layout of apertures is more favourable for uniform broadband enhancement. (b) exhibits the effect of the position of the units with different resonant frequencies on the coupling performance when the apertures are arranged in the dispersed layout. When the unit with the high-resonance frequency is located in the middle position (the coupled 3), only the highest-frequency absorption is decreased so that the other two lower frequency absorption curves are uniformly enhanced. Therefore, based on the low-frequency coupling enhancement mechanism of MHSTA, the units can be reasonably arranged so as to achieve the low-frequency coupling broadband uniform enhancement.
Figure 5. Broadband and uniform enhancement of multi-unit coupling. (a) Comparison of coupling characteristics of coupled 1 and 2. (b) Comparisons of coupling characteristics of coupled 2–4. (c) Four coupling layouts.
4. Optimisation methodology
4.1. Design strategy of the UIC method
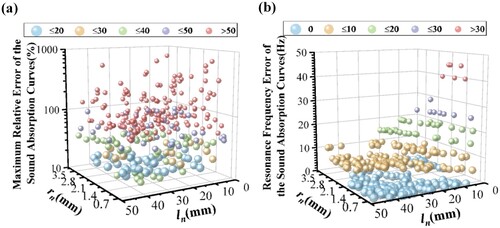
In the sound absorption theory of the unit, the inherent approximations as well as the approximations from more complex neck and cavity shapes are exist. Therefore, the theory solution of sound absorption of the unit will exhibit significant deviation from the simulation. The simulation results of unit (n = 4) are used as reference. The tangent circle radius and length
of the neck are chosen as the variable parameters (
with the increment of 0.1 mm and
with the increment of 1 mm). The 300 data sets of absorption curves generated randomly are compared by theory and simulation. (a) describes the maximum relative error
of the sound absorption curves between the theoretical and simulation results for the combination (
,
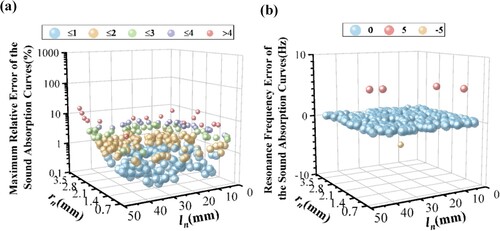
) in each set. 83.3% of the data (247 sets) exist significant differences between theory and simulation (maximum relative error exceeded 20%). Meanwhile, the errors of the resonance frequency position are reflected in (b). Wherein, over half data sets (176 sets) exhibit resonance frequency errors over 5 Hz. Hence, high prediction accuracy cannot be fitted for the unit by theory alone in such vast variation range of (ln, rn).
Figure 6. The maximum relative errors and resonance frequency errors between the theories and simulations of single unit. (a) The maximum relative errors. (b) The resonance frequency errors.
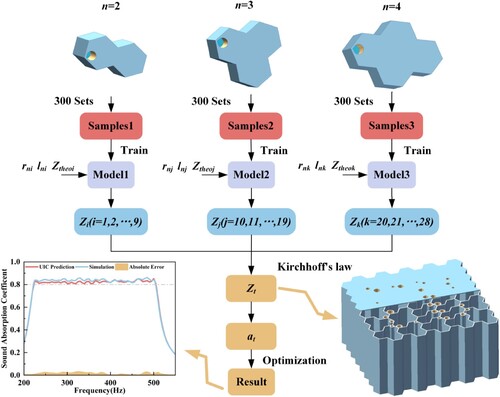
We propose the UIC method to achieve the precise acoustic performance design for a single unit. Due to the fewer parameters, by applying ANN with limited samples, the impedance of the unit can be corrected in a quite short time. The structure presented in the paper contains various deviations, such as irregular shapes, interactions between the neck and cavity, etc. The UIC method proposed in this paper is for the correction of all deviations between the theoretical and simulation models of the unit. For the theoretical Equations (1)–(9), it mainly describes the calculation of the unit impedance, which can be corrected using the UIC method. Wherein, the corrected impedance in Equation (8) is the end correction for the neck of the resonant acoustic structure. The deviations between theoretical and simulation models stem from the additional energy dissipation on the adjacent cavity wall and extended acoustic propagation path. Subsequently, the acoustic performance design of MHSTA can be achieved through Kirchhoff’s law. The detailed design strategy of the UIC method for MHSTA is shown in . The 900 sets of simulation data of three type units (n = 2, 3 and 4) are extracted for the desired frequency range to construct the dataset. Next, the prediction model for unit impedance is trained through ANN. The impedances of various kind of units with various parameters are predicted and the total impedance of MHSTA is obtained using Kirchhoff’s Law. Combining the pattern search algorithm, the optimisation of the absorption coefficient for specific frequency ranges facilitate rapid and precise design. It is worth noting that since the theoretical formulas of Kirchhoff’s law cannot take into account the relative positions of the apertures, the position design of the apertures are manually arranged by us.
Figure 7. Design strategy of the UIC method for MHSTA.
4.2. UIC model for units in MHSTA
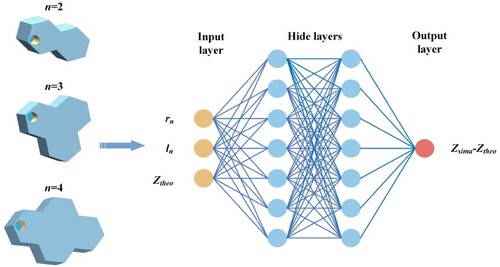
We set same invariable parameters (L = 50 mm, t = 0.6 mm and a = 6 mm) for each kind of unit (n = 2, 3 and 4). The 900 sets of simulation data are obtained from these three kinds of units (each kind accounts for 300 sets) by changing parameter combination (rn, ln), which are randomly allocated in 7:2:1 to create training, validation and test sets. The two-layer ANN is constructed in . The input layer includes three neurons. Each of the two hidden layers contains seven neurons. The output layer contains one neuron. The target root mean square error is 10−6 and the learning rate is 0.001. The parameter rn, ln and theoretical impedance Ztheo are used as the input layer. The difference between simulation impedance Zsimu and theoretical impedance Ztheo is used as the output layer. To further improve the prediction accuracy, the maximum relative error (set to 5%) is used as an evaluation metric. When the network training is completed, the maximum prediction relative errors will be examined. If the requirement is met, the training is stopped. If it exceeds 5% the network is retrained until it meets the requirement (shown in Fig. S1 and Fig. S2 in Text S1 of Supporting Information).
Figure 8. The ANN with various parameters to be trained.
4.3. UIC method for units in MHSTA
A small number of samples (900 data sets) are collected to achieve rapid completion of the training process. Next, the unit parameters in the test set are taken to verify the accuracy of UIC. Wherein, three sets of them are used to validate the acoustic resistance (shown in (a–c)), acoustic reactance (shown in (d–f)) and acoustic curves (shown in (g–i)). With the increase in , the UIC method maintains high level of agreements with the simulation results while the relative errors of the theoretical solutions increase (more validations are demonstrated in Fig. S3 in Text S2 of Supporting Information). (a) exhibits the largest relative error of each absorption curve following the UIC method corresponding to (a). Wherein, only 5.3% data sets (including 16 sets) of the data exist maximum relative error more than 4%, which reveals the high precision prediction of UIC. Similarly, in (b), almost all data of resonance frequency exist quite little errors (no more than 5 Hz). Hence, the accuracy of the UIC method is sufficient to substitute for theoretical solutions.
Figure 9. Comparison of acoustic resistances, acoustic reactance and acoustic curves among simulations, theories and UIC methods. (a), (d) and (g) Describe the acoustic resistance. (b), (e) and (h) Describe the reactance. (c), (f) and (i) Describe the acoustic curves.
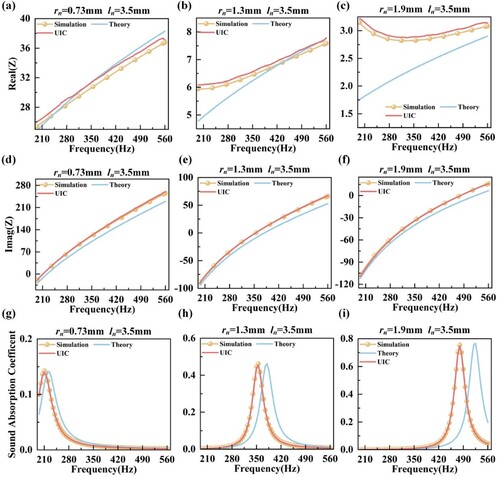
Figure 10. The resonance frequency errors after the UIC method of single unit. (a) The maximum relative errors. (b) The resonance frequency errors.
4.4. Optimisation design of MHSTA based on the UIC method
To achieve broadband acoustic absorption, an MHSTA with 28 units (9 units for n = 2 and 3, 10 units for n = 4) is constructed. By using the UIC method and combining pattern search algorithm, the variable parameters of MHSTA can be optimised as required. We restrict the minimum value of the acoustic absorption coefficient in two typical design frequency ranges (220–300 Hz and 230–550 Hz). The larger weighting is added to the frequency points in the lower frequency range to boost the low-frequency absorption. The objective function is designed according to Equation (13)
(12)
(12)
(13)
(13) where
,
and
, respectively denote the predicted acoustic absorption coefficient at the ith frequency, the unit number of the MHSTA and the additional weight on the ith frequency point. The optimal results with corresponding structural parameters are shown in Table S1 and Table S2 in Text S3 of Supporting Information.
4.5. Simulation verification
The MHSTA (50 mm thickness) with two typical frequency ranges (220–500 Hz and 230–550 Hz) are designed to confirm the prediction accuracy and optimisation flexibility. To confirm the prediction results, the acoustic absorption curves of the two typical structures are simulated.
The impedances and absorption coefficient curves fit excellently between UIC and simulation in the two frequency ranges, respectively (shown in (a–e)). In (a), the absorption coefficients of the simulation result in the range of 223–504 Hz are higher than 0.8 with an average absorption of 0.84. The maximum relative error of the UIC is 3.5% and the maximum absolute error is 0.03. Similarly, in (d), the absorption coefficients are higher than 0.8 in the range of 228–553 Hz with the average absorption coefficient of 0.83. The UIC method results show a maximum relative error of 3.5% and a maximum absolute error of 0.027. It should be noted that the deviation between simulation and the UIC method mainly stems from the coupling enhancement by arranging aperture positions of the units strategically, which is beyond the scope of Kirchhoff’s law. Moreover, the coupling enhancement characteristic results in the simulations of almost all frequencies consistently surpassing the UIC method. For the two typical structures without odd arrangement, the sound absorptions of them (the scatters in (a and d)) almost coincide with the UIC method, which further illustrates the accuracy of UIC prediction.
Figure 11. Absorption performance of typical structures in different frequency ranges. (a) Absorption curve, (b) impedance and (c) sound pressure distribution of the cavity in 225–500 Hz. (d) Absorption curve, (e) impedance and (f) sound pressure distribution of the cavity in 230–550 Hz.
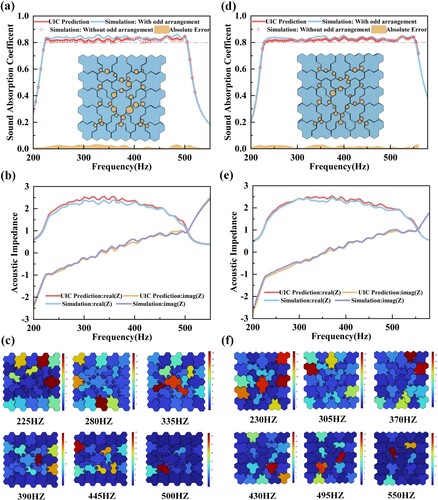
(c and f) reveals the sound pressure distribution of two typical structures. Due to the uniformity and stabilisation of the sound absorption performance of the two typical structures in the target frequency range, we extract respectively six frequency points in the frequency range to study the sound pressure distribution. At the chosen frequency points in the target frequency range, there are one or more units with higher absolute sound pressure in their cavities. This reveals that the maintenance of broadband high sound absorption coefficient lies in the resonance of different units in the target frequency range. It facilitates the realisation of uniform and stable sound absorption.
4.6. Experimental verification
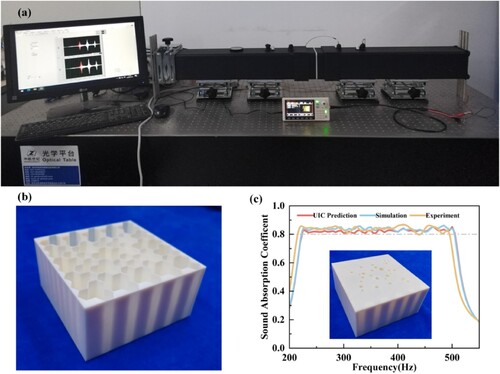
We manufacture and verify the acoustic absorption performance of the MHSTA in 223–504 Hz to further confirm the accuracy of the UIC method. The sample (the cross-section with 100 mm × 100 mm, 50 mm overall thickness and 0.6 mm wall thickness) is fabricated by using stereolithography 3D printing technology, as exhibited in (b). The acoustic absorption coefficients of the sample in the operating frequency range are measured using the two-microphone method in a 100 mm × 100 mm square impedance tube (shown in (a)). The loudspeaker transmits sound waves with a frequency range of 200–550 Hz. The results of the UIC method, simulation and experiment are displayed in (c). It confirms the accuracy of the UIC method.
Figure 12. Experimental verification of the performance of acoustic absorption metamaterial in 223–504 Hz. (a) Experimental system. (b) Sample. (c) Comparisons of the UIC, simulation and experiment.
4.7. Comparison with other advanced metamaterials
In , we summarize the absorption performances of low-frequency broadband advanced metamaterials in recent years. Achieving high and smooth sound absorption performance in low-frequency range generally requires quite large thicknesses of metamaterial. The absorption curve of such metamaterial is flatter outside the target frequency range, resulting in too much excessive response [Citation16]. However, the absorption performance outside the target frequency range is not needed in practice, which handicap the absorption performance within the target frequency range. Furthermore, the absorption curve with the reduced metamaterial thickness exhibits notable fluctuations within the target frequency range, thus failing to ensure consistent stationarity. In order to reflect the advantages of MHSTA with various metamaterials, in , we calculate their thickness relative to the maximum wavelength, relative bandwidth (bandwidth/centre frequency: and the extreme difference of sound absorption coefficient in the frequency range. Firstly, the thickness of MHSTA is only 1/31 of the maximum wavelength in the sound absorption range. It is the thinnest among all metamaterials, indicating that it possesses the advantage of being thinner at low frequencies. Secondly, the relative bandwidth of MHSTA is 77.3%. It is the widest among all metamaterials, illustrating its broadband advantage in the target frequency range. Lastly, the extreme difference of sound absorption coefficient of MHSTA in the frequency range is only 0.05. It is the smallest among the various metamaterials, exhibiting that the sound absorption curve is uniform in the target frequency range thus keep consistently stationary.
Table 2. Comparison with other advanced metamaterials.
In , the neural network applied in previous studies for typical acoustic metamaterials takes the full parameters as input and the absorption coefficients at all points in the frequency range as output. This makes the network structure very complex and requires a large amount of sample data to achieve high prediction accuracy. Complex networks with a large number of sample requirements make the design inefficient and unfavourable for practical applications. Instead, in this work, the complex metamaterial is split into units to construct a neural network model and then Kirchhoff’s law is used to realise high-accuracy coupling. Therefore, the constructed ANN possesses quite simple components that contain only two inputs, one output and two hidden layers (seven neurons each). Especially, such ANN structure allows for significant reduction in the number of samples and guarantees the model prediction accuracy. Among the metamaterials illustrated in , the network structure in this work is the simplest. It requires the smallest number of samples and achieves the highest prediction accuracy. Hence, the UIC method is more operational and suitable for practical applications.
Table 3. Comparison with other metamaterials optimisation with neural network.
5. Conclusion
In this paper, the method of UIC integrating impedance theory with ANNs for acoustic absorption metamaterials is proposed for precise and fast design. Meanwhile, a MHSTA which can enhance low-frequency coupling absorption performance is proposed to verify the prediction ability of UIC. Wherein, reasonable aperture arrangements can achieve broadband and uniform enhancement at low frequencies. With the thickness of 50 mm, by UIC prediction, we achieve continuous absorption coefficients exceeding 0.8 across the frequency range from 223 to 504 Hz. The simulation and experiment validate the corresponding acoustic absorption performances. It provides a new idea of rapid and accurate design of low-frequency and broadband acoustic absorption metamaterials.
Supplemental Material
Download ()Acknowledgements
This research did not receive any specific grant from funding agencies in the public, commercial, or not-for-profit sectors.
Disclosure statement
No potential conflict of interest was reported by the author(s).
Data availability statement
The data that support the findings of this study are available from the corresponding author upon reasonable request.
References
- Arenas J, Crocker M. Recent trends in porous sound-absorbing materials. Sound Vib. 2010;44(7):12–17.
- Sakagami K, Yairi M, Morimoto M. Multiple-leaf sound absorbers with microperforated panels: an overview. Acoust Aust. 2010;38(2):76–81.
- Mohamed AM, Yao K, Yousry YM, et al. Open-cell poly(vinylidene fluoride) foams with polar phase for enhanced airborne sound absorption. Appl Phys Lett. 2018;113(9):092903. doi:10.1063/1.5048336
- Mei J, Ma G, Yang M, et al. Dark acoustic metamaterials as super absorbers for low-frequency sound. Nat Commun. 2012;3:756. doi:10.1038/ncomms1758
- Ma G, Yang M, Xiao S, et al. Acoustic metasurface with hybrid resonances. Nat Mater. 2014;13(9):873–878. doi:10.1038/nmat3994
- Yang M, Meng C, Fu C, et al. Subwavelength total acoustic absorption with degenerate resonators. Appl Phys Lett. 2015;107(10):104104. doi:10.1063/1.4930944
- Yang M, Li Y, Meng C, et al. Sound absorption by subwavelength membrane structures: a geometric perspective. Comp Rend Méca.. 2015;343(12):635–644. doi:10.1016/j.crme.2015.06.008
- Zhao J, Li X, Wang Y, et al. Membrane acoustic metamaterial absorbers with magnetic negative stiffness. J Acoust Soc Am. 2017;141(2):840–846. doi:10.1121/1.4976042
- Xu Q, Qiao J, Sun J, et al. A tunable massless membrane metamaterial for perfect and low-frequency sound absorption. J Sound Vib. 2021;493:115823. doi:10.1016/j.jsv.2020.115823
- Yang W, An J, Chua CK, et al. Acoustic absorptions of multifunctional polymeric cellular structures based on triply periodic minimal surfaces fabricated by stereolithography. Virtual Phys Prototyp. 2020;15(2):242–249. doi:10.1080/17452759.2020.1740747
- Wang Z, Guo Z, Li Z, et al. Design, manufacture, and characterisation of hierarchical metamaterials for simultaneous ultra-broadband sound-absorbing and superior mechanical performance. Virtual Phys Prototyp. 2023;18(1):e2111585. doi:10.1080/17452759.2022.2111585
- Yang W, Bai X, Zhu W, et al. 3D printing of polymeric multi-layer micro-perforated panels for tunable wideband sound absorption. Polymers (Basel). 2020;12(2):360. doi:10.3390/polym12020360
- Xu W, Liu J, Yu D, et al. Coherent coupling based meta-structures for high acoustic absorption at 220-500 Hz frequency. Appl Acoust. 2021;182:108181. doi:10.1016/j.apacoust.2021.108181
- Wu Y, Liang Q, He J, et al. Deep-subwavelength broadband sound absorbing metasurface based on the update finger coiling-up method. Appl Acoust. 2022;195:108846. doi:10.1016/j.apacoust.2022.108846
- Shao C, Zhu Y, Long H, et al. Metasurface absorber for ultra-broadband sound via over-damped modes coupling. Appl Phys Lett. 2022;120(8):083504. doi:10.1063/5.0080930
- Zhou Z, Huang S, Li D, et al. Broadband impedance modulation via non-local acoustic metamaterials. Natl Sci Rev. 2022;9(8):nwab171. doi:10.1093/nsr/nwab171
- Li X, Yu X, Chua JW, et al. Harnessing cavity dissipation for enhanced sound absorption in Helmholtz resonance metamaterials. Mater Horiz. 2023;10(8):2892–2903. doi:10.1039/D3MH00428G
- Lue C, Tang S, Wu J-L, et al. Low-frequency acoustic absorption realized by ultrasparse coiling-up metasurfaces. Results Phys. 2023;49:106488. doi:10.1016/j.rinp.2023.106488
- Zhang L, Zhang W, Xin F. Broadband low-frequency sound absorption of honeycomb sandwich panels with rough embedded necks. Mech Syst Signal Process. 2023;196:110311. doi:10.1016/j.ymssp.2023.110311
- Li Q, Dong R, Mao D, et al. A compact broadband absorber based on helical metasurfaces. Int J Mech Sci. 2023;254:108425. doi:10.1016/j.ijmecsci.2023.108425
- Ji J, Li D, Li Y, et al. Low-frequency broadband acoustic metasurface absorbing panels. Front Mech Eng. 2020;6:586249. doi:10.3389/fmech.2020.586249
- Karal FC. The analogous acoustical impedance for discontinuities and constrictions of circular cross section. J Acoust Soc Am. 1953;25(2):327–334. doi:10.1121/1.1907041
- Stinson MR. The propagation of plane sound waves in narrow and wide circular tubes, and generalization to uniform tubes of arbitrary cross-sectional shape. J Acoust Soc Am. 1991;89(2):550–558. doi:10.1121/1.400379
- Kim SR, Kim Y-H, Jang J-H. A theoretical model to predict the low-frequency sound absorption of a Helmholtz resonator array (L). J Acoust Soc Am. 2006;119(4):1933–1936. doi:10.1121/1.2177568
- Doutres O, Atalla N, Osman H. Transfer matrix modeling and experimental validation of cellular porous material with resonant inclusions. J Acoust Soc Am. 2015;137(6):3502–3513. doi:10.1121/1.4921027
- Huang S, Fang X, Wang X, et al. Acoustic perfect absorbers via Helmholtz resonators with embedded apertures. J Acoust Soc Am. 2019;145(1):254–262. doi:10.1121/1.5087128
- Zeng K, Li Z, Guo Z, et al. Acoustic metamaterial for highly efficient low-frequency impedance modulation by extensible design. Extreme Mech Lett. 2022;56:101855. doi:10.1016/j.eml.2022.101855
- Donda K, Zhu Y, Merkel A, et al. Ultrathin acoustic absorbing metasurface based on deep learning approach. Smart Mater Struct. 2021;30(8):085003. doi:10.1088/1361-665X/ac0675
- Mahesh K, Kumar Ranjith S, Mini RS. Inverse design of a Helmholtz resonator based low-frequency acoustic absorber using deep neural network. J Appl Phys. 2021;129(17):174901. doi:10.1063/5.0046582
- Donda K, Zhu Y, Merkel A, et al. Deep learning approach for designing acoustic absorbing metasurfaces with high degrees of freedom. Extreme Mech Lett. 2022;56:101879. doi:10.1016/j.eml.2022.101879
- Lee SY, Lee J, Lee JS, et al. Deep learning-based prediction and interpretability of physical phenomena for metaporous materials. Mater Today Phys. 2023;30:100946. doi:10.1016/j.mtphys.2022.100946
- Baali H, Addouche M, Bouzerdoum A, et al. Design of acoustic absorbing metasurfaces using a data-driven approach. Commun Mater. 2023;4(1):40. doi:10.1038/s43246-023-00369-0
- Kumar S, Jin H, Lim KM, et al. Comparative analysis of machine learning algorithms on prediction of the sound absorption coefficient for reconfigurable acoustic meta-absorbers. Appl Acoust. 2023;212:109603. doi:10.1016/j.apacoust.2023.109603
- Mahesh K, Ranjith S, Mini R. A deep autoencoder based approach for the inverse design of an acoustic-absorber. Eng Comput. 2023;40:297–300. doi:10.1007/s00366-023-01789-9.
- Liu L, Xie L-X, Huang W, et al. Broadband acoustic absorbing metamaterial via deep learning approach. Appl Phys Lett. 2022;120(25):251701. doi:10.1063/5.0097696
- Wang Z-W, Chen A, Xu Z-X, et al. On-demand inverse design of acoustic metamaterials using probabilistic generation network. Sci China Phys Mech Astron. 2023;66(2):224311. doi:10.1007/s11433-022-1984-1
- Ren Z, Cheng Y, Chen M, et al. A compact multifunctional metastructure for low-frequency broadband sound absorption and crash energy dissipation. Mater Des. 2022;215:110462. doi:10.1016/j.matdes.2022.110462
- Stinson MR, Shaw EAG. Acoustic impedance of small, circular orifices in thin plates. J Acoust Soc Am. 1985;77(6):2039–2042. doi:10.1121/1.391776
- Maa D-Y. Potential of microperforated panel absorber. J Acoust Soc Am. 1998;104(5):2861–2866. doi:10.1121/1.423870
- Wu T, Cox TJ, Lam YW. From a profiled diffuser to an optimized absorber. J Acoust Soc Am. 2000;108(2):643–650. doi:10.1121/1.429596