
 ?Mathematical formulae have been encoded as MathML and are displayed in this HTML version using MathJax in order to improve their display. Uncheck the box to turn MathJax off. This feature requires Javascript. Click on a formula to zoom.
ABSTRACT
A novel AlMo0.25FeCoCrNi2.1 high-entropy alloy (HEA) was additively manufactured using laser direct energy deposition (LDED) process. The microstructure, mechanical properties and corrosion resistance of the prepared alloy were investigated and adjusted by annealing heat treatment. The results showed that inadequate melting and diffusion of Mo powders cause the nonuniform Mo concentration and finally result in the microstructure diversity in the banded layer. Fine lamellar eutectic structures composed of Mo-rich σ phase and body-centered cubic (BCC) phase form within Mo supersaturated FCC phases. The annealing heat treatment promotes the precipitation and coarsening of needle-like B2 phases within the incipient FCC phases and granular σ phases at phase boundaries between FCC and BCC/B2, synergistically improving the toughness of this alloy with slight deterioration of ultimate tensile strength. The corrosion resistance of the alloy is notably improved by a 2-hour annealing heat treatment. These results contribute to rapidly designing/manufacturing/adjusting novel HEAs by LDED process.
1. Introduction
High entropy alloys (HEAs) were first proposed by Cantor et al. [Citation1] and Yeh et al. [Citation2] in 2004, and have been becoming a research frontier of materials science [Citation3,Citation4]. Unlike the traditional one or two main elements design method of metal alloys, HEAs typically comprise five or more primary elements with equiatomic or near-equiatomic proportions ranging from 5% to 35% [Citation5,Citation6], supporting wide compositional space to explore innovative elements combinations and design novel alloys [Citation7,Citation8]. The steep upward trend of the HEAs is mainly ascribed to distinctive properties such as high strength and hardness [Citation9,Citation10], excellent thermal stability [Citation11], good wear resistance [Citation12,Citation13], and outstanding corrosion resistance [Citation14,Citation15] over a wide range of mixing compositions. At present, excellent strength and ductility trade-off is still a longstanding challenge for simple face-centered cubic (FCC) or body-centered cubic (BCC) structured HEAs, and severely restricts the application of HEAs [Citation16]. To address this issue, Lu et al. [Citation17] proposed a new AlCoCrFeNi2.1 eutectic HEA (EHEA) which is composed of fine lamellar FCC/BCC dual-phase eutectic structures. Due to its excellent performances such as excellent strength-ductility trade-off and good phase stability, the AlCoCrFeNi2.1 EHEA obtains plenty of attentions and exhibits great potential as the material of high-performance components in advanced industries [Citation18-20].
Recently, based on the common HEAs, minor modification methods of compositions such as doping extra additives including principal elements [Citation21-24], oxides [Citation25,Citation26] carbides [Citation27,Citation28] to create novel HEAs and improve their microstructure and properties attract a great deal of attention from the academic and industry communities. Among these extra additives, Mo, as an effective solution-strengthening element with high melting point and large atomic size, is usually added into basic HEAs to adjust the microstructure, mechanical properties, corrosion and wear resistances [Citation29]. Cichocki et al. [Citation30] designed (FeMnNiCo)100-xMox HEAs by vacuum arc melting process, and reported that the moderate Mo addition can distinctly enhance tensile strength with a deterioration of elongation. Similarly, Qin et al. [Citation31] prepared (CoCrFeMnNi)100-xMox HEAs and found that σ phases form when the Mo content is more than 8%, and benefit the improvement of compressive yield strength. Li et al. [Citation32] added Mo into CoCrFeNi-based HEAs and found the Mo content could enhance the lattice distortion and resultantly improve compression strength with a high strain-hardening rate. Shang et al. [Citation33] found that the corrosion resistance of CoCrFeNiMox HEAs is improved by the Mo addition and obtains optimal values with x = 0.2 or 0.4. Wu et al. [Citation34] prepared FeNiCoCrMox HEAs coatings on SS316 plate by laser direct energy deposition (LDED) process, and found the microhardness, wear and corrosion resistances of coatings could be effectively improved by the increase of Mo content. These above works indicated that regularly improving properties of these traditional HEAs through adding a suitable content of Mo is achievable and can be quickly synthesised by LDED process. LDED process could rapidly deposit powder materials with novel or modified compositions and owns an ability to additively manufacture metallic components track by track and layer by layer in a near-net shape. The high cooling rate of molten pool generated by high-energy laser beam inhabits the elements segregation and is beneficial to the homogeneity of HEAs. Thus, based on the LDED technique, tries to further explore the properties and potential applications through minorly modifying AlCoCrFeNi2.1 EHEA with Mo element are meaningful and contribute to the development of rapidly designing/manufacturing novel HEAs. However, the knowledge about the effect of Mo adding on AlFeCoCrNi2.1 EHEA is still deficient and needs deep exploring.
Due to the hysteretic precipitation effect, the microstructure and mechanical properties of HEAs can be further improved by a subsequent heat treatment process [Citation35-37]. Peng et al. [Citation38] studied the effect of heat treatment process on the as-cast AlCoCrFeNi2.1 EHEA, and found that the increase of heat treatment temperature from 600 °C to 800 °C advances the precipitation and coarsening of fine FCC phases within incipient B2 phases, and resultantly improves the tensile and compression strengths with a deterioration of ductility. Ye et al. [Citation39] annealed the AlCoCrFeMo0.05Ni2 HEA at 800 °C for 72 h, and found that the annealing heat treatment promotes the microstructure transformation from FCC structure to BCC structure. The precipitation of massive σ phases at grain boundaries reduces the ductility of the alloy. Thus, to further improve the properties and expand the potential application space of AlFeCoCrNi2.1 EHEA, it is of great value to study the feasibility of synthesising novel AlMo0.25FeCoCrNi2.1 HEA through doping slight Mo into AlFeCoCrNi2.1 and rapidly manufacturing/verifying by LDED process, with an in-depth investigation of the effect of annealing heat treatment on the microstructure and properties of the prepared AlMo0.25FeCoCrNi2.1 alloy.
In this study, a novel AlMo0.25FeCoCrNi2.1 HEA was additively manufactured using LDED process and heat treated at 900°C. The effect of annealing time on the microstructure, mechanical properties and corrosion resistance of the novel alloy were investigated. The microstructure diversity, as well as the effect of precipitated B2 and σ phases on mechanical properties and corrosion resistance, was discussed in detail.
2. Materials and methods
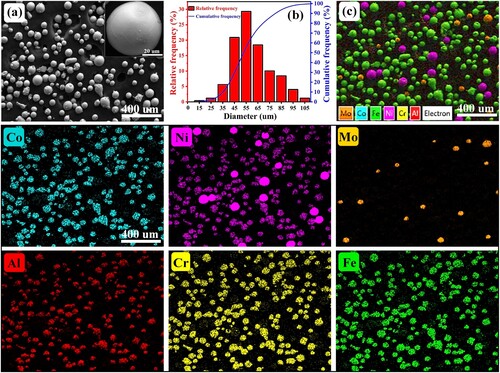
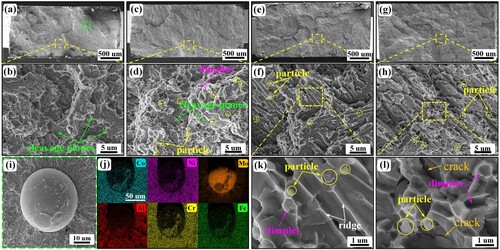
In this study, the raw powder material of AlMo0.25FeCoCrNi2.1 alloy was prepared by mechanically mixing AlFeCoCrNi HEA powders, pure Ni powders and pure Mo powders for 2 h by a planetary ball mill (QM-3SP04). The weight ratio between agate balls and powders in the vacuumed mill jar is 1:2. The rotation speed of the planetary ball mill is 60 r/min. The pre-alloyed AlFeCoCrNi HEA powders were prepared by a gas atomisation (GA) process and owned spherical or near-spherical shapes. The pure Mo and Ni powders were manufactured by plasma rotating electrode process (PREP) and owned a well-spherical shape. (a) shows the SEM map of mixed raw AlMo0.25FeCoCrNi2.1 HEA powders with an inserted image of pure Mo. The particle size of the mixed AlMo0.25FeCoCrNi2.1 powders was in the range 45 μm ∼ 105 μm, as shown in (b). (c) shows the EDS mapping results of AlMo0.25FeCoCrNi2.1 HEA powders. The doped Mo and Ni powders distributed uniformly without a distinguished segregation. A stainless steel 316L (SS316L) plate was used as the substrates. The deposition surface of the SS316L substrate was cleaned with sandpaper and alcohol. Before the LDED process, the AlMo0.25FeCoCrNi2.1 powders were dried in a vacuum oven at 80°C for 6 h to improve the fluidity.
Figure 1. (a) The SEM map, (b) particle size distribution and (c) associated EDS mapping results of the mixed AlMo0.25FeCoCrNi2.1 powders. The inserted image in (a) is the high-magnification SEM map of pure Mo particles.
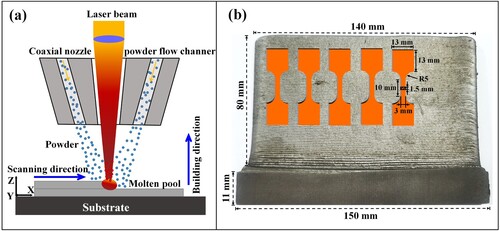
(a) shows the schematic of the coaxial LDED system used in this study. The LDED system was composed of a three-axial CNC center, argon gas cylinders, a 3 KW fiber laser (YLS-3000, IPG), a coaxial deposition nozzle (YC52, PRECITEC) and a two-cylinder powder feeder. Under the protection of argon gas (99.999% in purity), the mixed AlMo0.25FeCoCrNi2.1 powders were transported from the double-cylinder powder feeder into the coaxial nozzle. The focused laser beam owns a wavelength of 1070 ± 10 nm and vertically irradiates on the surface to form a molten pool through melting the substrate and powders. The processing parameters including fiber laser power (1200 W), beam diameter (2 mm), scanning speed (7.5 mm/s), powder feeding speed (9 g/min) and incremental layer height (0.5 mm) were constantly set during the LDED process. The laser beam moved layer-by-layer under a zigzag scanning strategy, and additively fabricated a crack-free thin-wall build with a size of 140 mm (length) × 80 mm (height) × 4 mm (thickness), as shown in (b). The tensile samples were cut by a wire-cut electrical discharge machining. Samples were heated up to 900°C in a tube resistance furnace (GSL-1600X) with a rising rate of 6 °C/min, and then held for 2 , 10 and 26 h (marked as AHT-2, AHT-10 and AHT-26 in order) respectively, and finally furnace cooled to room temperature. The as-deposited sample was marked as AHT-0.
Figure 2. (a) Schematic diagram of the multilayer LDED process with a zigzag scanning strategy, (b) the geometrical descriptions of the LDEDed thin-wall build and tensile samples.
Before observing the microstructure, these metallographic samples were ground with sandpaper, polished with diamond polishing spray, and finally etched by an aqua regia (HNO3: HCl = 1: 3) for 5 s. The phase structures were analyzed by x-ray diffraction (XRD, D8 ADVANCE) using Cu Kα radiation. The scanning range (2θ) was from 20° to 90° with a scanning rate of 2 °/min. The microstructure was observed and analyzed by optical microscopy (OM, Axio observer 3), a scanning electron microscopy (SEM, TESCAN MIRA LMS) equipped with an energy disperse spectroscopy (EDS). The grain morphologies and phase structures were observed by an electron backscattering diffractometer (EBSD). The samples for EBSD tests were prepared by a vibratory polisher (VibroMet2, Buehler). The crystals and lattice structures were verified by transmission electron microscopy (TEM, FEI Talos F200X). The samples for TEM were prepared by an electro polisher (Tenupol-5, Struers). The Vickers hardness tests were carried out using a microhardness tester (HV-1000) with a load of 500 g and a dwell time of 10 s. For each specimen, a minimum of 5 indents were measured and analyzed. Room-temperature tensile tests were carried out by an electronic universal testing machine (INSTRON 5982) using a strain rate of 5 × 10⁻⁴ s−1. The potentiodynamic polarisation tests were conducted on a three-electrode electrochemical workstation (Bio-Logic SP-150) to evaluate the corrosion resistance of the alloys. All the electrochemical measurements were taken in 3.5 wt.% NaCl solution at an ambient temperature of 30 °C.
3. Results and discussion
3.1. XRD results
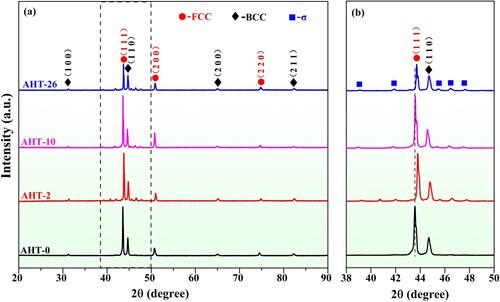
shows the XRD results of as-deposited and annealed microstructures. It is noted that the diffraction peaks (111) of FCC phase and (110) of BCC phase are prominent and stable under various annealing times, indicating that the phase structures of AlMo0.25FeCoCrNi2.1 HEA are mainly comprised of FCC and BCC and own a perfect stability. No distinguishable diffraction peaks of σ phases can be detected within the as-deposited AHT-0 sample. Around diffraction peaks (111) of FCC phase and (110) of BCC phase, weak diffraction peaks of σ phases [JCPDS no. 04-007-2230] are detected within the annealed AHT-2, AHT-10 and AHT-26 samples. The results show that the annealing heat treatment could facilitate the precipitation of σ phases. Similar σ phases also have been observed and reported in previous work [Citation40,Citation41]. In the local amplified 2θ ranging from 38° to 50° shown in (b), it can be found that the diffraction peaks (111) of FCC and (110) of BCC tend to shift right with the increase of annealing time, which can be attributed to the release of internal residual stress generated during the multilayer LDED process, and may also be ascribed to the σ phases precipitation during the annealing heat treatment.
Figure 3. (a) XRD patterns of AlMo0.25FeCoCrNi2.1 HEA with various annealing times, (b) the local amplified of the 2θ ranging from 38° to 50°.
3.2. As-deposited microstructure analysis
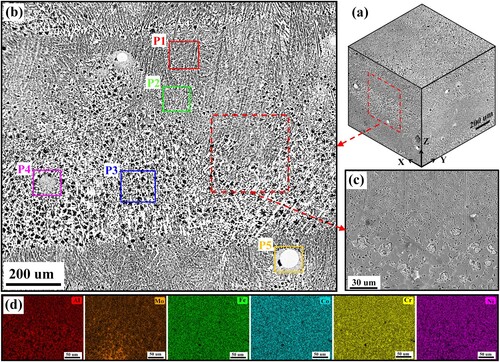
shows the OM observations and high-magnification SEM map of the as-deposited microstructure in AHT-0 sample. As shown in (a), the crack-free microstructure exhibits a distinct banded feature under the zigzag scanning strategy. Unlike the uniform lamellar FCC/BCC dual-phase microstructure in the LDEDed AlFeCoCrNi2.1 EHEA [Citation36], in this study, the microstructure morphology in the as-deposited AlMo0.25FeCoCrNi2.1 HEA shows an obvious diversity. As shown in (b), near the top half of the banded layer, the lamellar feature of the columnar dendritic microstructure is distinct and similar to that of LDEDed AlFeCoCrNi2.1 EHEA. While, near the half bottom of the banded layer, the microstructure exhibits indiscernible orientations and is featured with plenty of dark spots. According to the high-magnification SEM maps near the middle of the banded layer shown in (c), these dark spots show a flower-like structure characterisation and are surrounded by coarse matrix phases. A few of pure Mo particles are incompletely melted during the rapid solidification of molten pool and randomly remain in the as-deposited microstructure. According to the EDS mapping results shown in (d), these primary elements distribute relatively uniformly in the as-deposited microstructure, indicating the fabrication of novel AlMo0.25FeCoCrNi2.1 HEA by LDED process is feasible and flexible.
Figure 4. (a) Three-dimensional and (b) X-Z section OM observations of the microstructure in as-deposited AlMo0.25FeCoCrNi2.1 alloy. (c) High-magnification SEM image and (d) associated EDS results of the microstructure selected in the middle region of banded layers shown in (b).
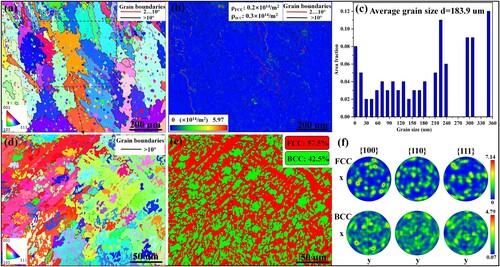
The EBSD results of the as-deposited microstructure in the banded layer are exhibited in . According to the inverse pole figure (IPF) map shown in (a), the microstructure is mainly composed of disoriented coarse grains and plenty of mottled fine grains. (b) shows the geometrically necessary dislocation (GND) density map derived from the EBSD data. The mean GND densities of FCC and BCC phases are 0.2 × 10¹⁴ m−2 and 0.3 × 10¹⁴ m−2, respectively. The dislocations are apt to distribute along the low-angle grain boundaries and phase boundaries. The average grain size of the as-deposited microstructure is 183.9 μm, as shown in (c). An amplified selected region from (a) is further displayed and discussed in (d)–(f). According to the phase map shown in (e), the microstructure is mainly comprised of FCC and BCC phases. The burly FCC phases with a content of 57.5% mainly occupy the crystal trunks of columnar dendrites, while the BCC phases with a content of 42.5% tend to distribute at interdendritic regions. The crystallographic orientations of FCC and BCC phases are chaotic, as shown in (f).
Figure 5. (a) The IPF map, (b) GND density map and (c) average grain size of the as-deposited AlMo0.25FeCoCrNi2.1 microstructure. (d) The high-magnification IPF map, (e) phase map and (f) IPFs of amplified region from (a).
To investigate the microstructure diversity in the banded layer clearly and in detail, here five representative regions (marked by P1, P2, P3, P4 and P5 in ) in the as-deposited microstructure are displayed and discussed in . As shown in (a), near the top of the banded layer (region P1), the columnar dendritic microstructure is featured by fine FCC/BCC lamellar eutectic structure. The FCC and BCC phases occupy the thick and thin lamellas, respectively. The Mo content of EDS map scanning results is about 2.98 at.%. Near the middle of the banded layer (region P2) shown in (b), the microstructure still keeps a lamellar eutectic structure. Meanwhile, part of FCC lamellas exhibits a gradually thickening trend, and some particles first precipitate within the BCC phases. The Mo content of EDS map scanning results is about 3.73 at.%. Near the bottom of the banded layer (region P3) shown in (c), plenty of Al-Ni-rich flower-like structures form within the coarse FCC matrix and are accompanied by many bright white short rod-like and nanoscale granular precipitations. The Mo content of EDS map scanning results is about 5.77 at.%. In the specific region P4 shown in (d), the microstructure is composed of ultrafine Cr–Mo-rich lamellar structures and coarse blocky phases. The Mo content of EDS map scanning results is about 12.71 at.%. Comparing (a) and (d), the average lamellar spacing (0.2 μm) of ultrafine Cr–Mo-rich lamellar structures is smaller than that (0.43 μm) of FCC/BCC lamellar structures. In the specific region P5 shown in (e), some residual Mo particles randomly exist in the microstructure. The size of these Mo particles mainly distributes in the range of 14 μm – 79 μm which is smaller than that of the raw Mo particles in the mixed AlMo0.25FeCoCrNi2.1 powder materials, indicating some raw Mo particles in the mixed AlMo0.25FeCoCrNi2.1 powder materials are partially melted and finally remain in the solidified microstructure. The ultrafine lamellar structure forms around these residual Mo particles. The Mo content of EDS map scanning results is about 13.66 at.%. Comparing (a)-(e), it can be found that the microstructure diversity directly relates to the Mo concentration. With the low Mo concentration, the microstructure in regions P1 and P2 can still keep the lamellar feature. The further increase of Mo concentration promotes the formation of flower-like structures and ultrafine lamellar structures.
Figure 6. SEM maps and associated EDS mapping results of representative regions (a) P1, (b) P2, (c) P3, (d) P4 and (e) P5 in as-deposited microstructure shown in .

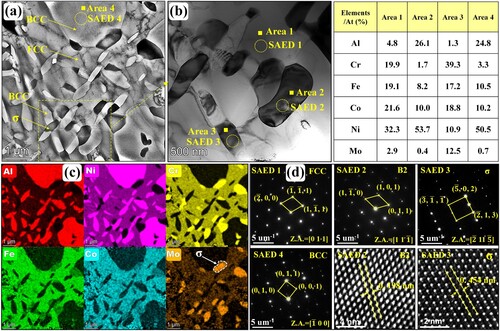
To further figure out these special short rod-like and nanoscale granular precipitations within the flower-like structures shown in (c), the TEM maps, associated EDS mapping results and selected area electron diffraction (SAED) patterns of microstructure in region P3 are exhibited in . According to the EDS results and SAED patterns, it is distinct that the Al-Ni-rich flower-like structures are BCC phases. These short rod-like precipitations within the incipient flower-like BCC structures are Cr-Fe-Co-Mo-rich FCC phases. According to the EDS point results shown in , the composition of the precipitated short rod-like FCC phase is similar to that of the incipient FCC matrix except for a lower content of Mo element (4.5 at.%). This is because the incipient flower-like BCC structures are poor in Mo element. During the precipitation process, these short rod-like FCC phases cannot adequately obtain Mo element from the incipient BCC structures. Meanwhile, some short rod-like and nanoscale granular precipitations with extra bright colors of Cr and Mo elements can be distinguished easily in (b). According to the SAED patterns, these Cr–Mo-rich short rod-like and nanoscale granular precipitations are σ phases. According to the EDS point results shown in , the Mo element content of σ phases exceeds 11 at.%, which is significantly higher than that in the incipient FCC and BCC phases. These σ phases mainly accompany with the precipitated FCC and are apt to exist among the FCC/BCC phase boundaries. According to the electron hole theory applied to high-temperature alloys, alloys are more likely to precipitate σ phases once the average electron hole number exceeds a critical value 2.50 [Citation42]. The average electron hole number can be calculated by the following formula
(1)
(1) where
is the average electron hole number of alloy, n is the number of elements in the alloy, mi is the atomic percent of a particular element, and
is the number of electron holes in elements: Al 2.66, Mo 4.66, Fe 2.66, Co 1.71, Cr 4.66 and Ni 0.66 [Citation43,Citation44]. For the AlMo0.25FeCoCrNi2.1 alloy, the calculated
is 3.90, which is larger than the critical value 2.50. Therefore, the AlMo0.25FeCoCrNi2.1 HEA prepared in this study is more prone to precipitate σ phases.
Figure 7. (a) TEM map, (b) associated EDS mapping results and (c) SAED patterns of flower-like structure of microstructure in region P3 shown in (c).
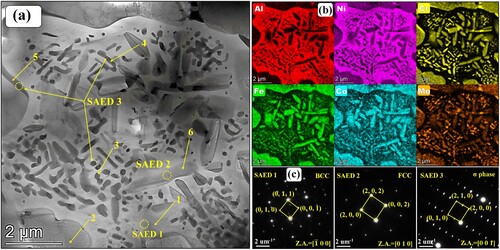
Table 1. EDS point results of structures in region P3 (at. %).
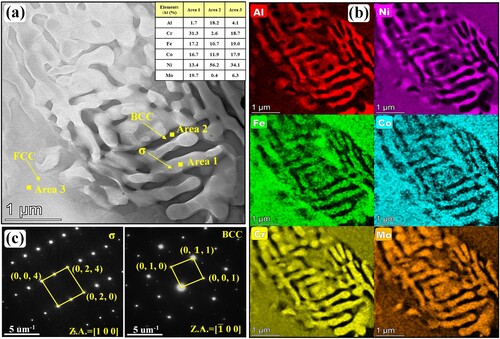
To get more insight into these unique ultrafine lamellar structures and coarse blocky phases shown in (d), the associated TEM image, EDS results and SAED patterns of microstructure in region P4 are shown in . According to the EDS results and SAED patterns, these Cr-Fe-Co-Mo-rich lamellas in area 1 are σ phases while these Al-Ni-rich lamellas in area 2 are BCC phases. These σ and BCC laminas form ultrafine lamellar σ/BCC eutectic structures. The coarse blocks around the ultrafine σ/BCC eutectic structure are FCC phases. Comparing and , it is distinct that the Mo content of ultrafine σ phase laminas (about 19.7%) is further higher than that in rod-like and granular σ phase in flower-like structure, manifesting that the nonuniform Mo concentration relates to the diversity of the as-deposited microstructure.
Figure 8. (a) TEM maps, (b) EDS mapping results and (c) SAED patterns of nanoscale lamellar structure in region P4 shown in (d).
To clearly explain the formation mechanism of Mo concentration nonuniformity and associated microstructure diversity in additively manufactured AlMo0.25FeCoCrNi2.1 alloy, a schematical illustration of dynamic melting-solidification process during the LDED of mixed AlMo0.25FeCoCrNi2.1 powders are exhibited in . As shown in , the Mo element owns highest melting point and high density among these other elements in AlMo0.25FeCoCrNi2.1 HEA. During the LDED process, the AlFeCoCrNi and pure Ni powders are irradiated by a high-intensity laser beam and melt as soon as they fall into the liquid molten pool. However, these high-melting-point and high-density Mo powder particles, once fall into the liquid molten pool, cannot obtain enough heat to melt as soon as possible and sink toward the bottom of molten pool. During the sinking process, the Mo powder particles continuously absorb heat. A few of small-size Mo powder particles obtain enough melting energy first and sufficiently diffuse into the liquid metal, forming the low-Mo-concentration region near the top of the banded layer. During the rapid solidification process, the microstructure of the low-Mo-concentration region could keep well columnar dendritic morphology with fine lamellar FCC/BCC dual-phase structure. With the further increase of sinking distance, more and more Mo particles begin to melt and diffuse. The fast-increased Mo concentration promotes the microstructure morphology transformation from columnar grains into equiaxed grains with coarse FCC phases and flower-like BCC phases. The precipitation of short rod-like FCC and granular σ phases not only reduce the lattice distortion energy but also benefit the stability of the flower-like BCC phase.
Figure 9. Schematic illustration of the dynamic melting-solidification process of during the LDED of AlMo0.25FeCoCrNi2.1 HEA.
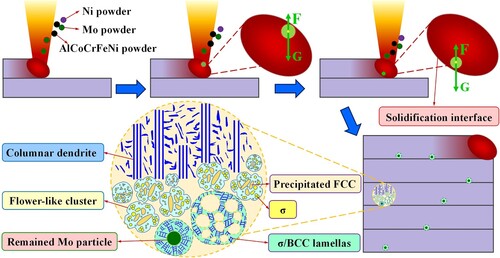
Table 2. Atomic size, melting points, density and mixing enthalpy of elements in mixed AlMo0.25FeCoCrNi2.1 HEA.
Meanwhile, the fast moving of molten pool cannot support enough time for the complete melting and diffusion of all the Mo powder particles. Some large-size Mo powders completely melt but cannot diffuse sufficiently when they sink toward the bottom of the molten pool, generating a local Mo supersaturation region at the half bottom of the banded layer. The supersaturation concentration of Mo element further facilitates the growth of σ phase and the formation of σ/BCC eutectic structure. Resultantly, the microstructure is composed of ultrafine σ/BCC eutectic lamellas and coarse blocky FCC phases. Some huge-size Mo powders partially melt, and finally remain in the solidified microstructure. Similarly, the Mo supersaturation regions around these residual Mo powders form ultrafine σ/BCC lamellar eutectic structures. Usually, fluid flow could effectively promote the element diffusion in the molten pool. While, due to the sluggish melting of high-density Mo particles, the fluid flow does not have sufficient time to promote the diffusion of Mo element during the fast solidification of molten pool, and resultantly improves Mo concentration nonuniformity very little.
3.3. Effect of annealing heat treatment
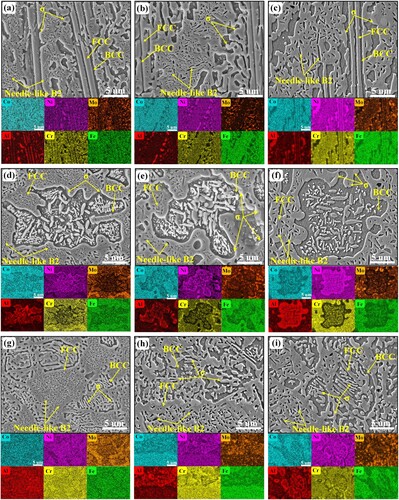
To analyze the effect of annealing heat treatment on the microstructure variations, the SEM maps and associated EDS mapping results of annealed microstructure in representative regions P2, P3 and P4 are exhibited and discussed in . As shown in (a)–(c). Some dense needle-like phases precipitate within the coarse FCC phases in region P2, and gradually coarsen with the increase of annealing time. Meanwhile, according to the associated EDS results, the Mo concentration becomes more and more distinct with an expanded size. As shown in (d)-(f), these precipitated short rod-like FCC in the flower-like BCC structures gradually coarsen with the increase of annealing time, while the number of nanoscale granular σ phase decreases due to the dissolution. (g)-(i) shows the microstructure variation in the region P4. With the increase of annealing time, the σ/BCC eutectic structure coarsens.
Figure 10. The SEM maps and associated EDS results of annealed microstructure in the representative regions (a)-(c) P2, (d)-(f) P3 and (g)-(i) P4.
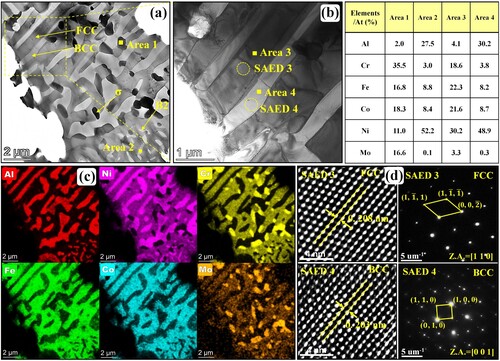
To finger out the needle-like precipitates within the coarse FCC phases during the annealing heat treatment, the TEM analysis on region P2 of AHT-26 sample are shown in . According to the TEM map, EDS point results, SARD patterns and high-revolution TEM (HRTEM) images, these dense-distributed Al-Ni-rich needle-like precipitates within the incipient FCC phase are ordered B2 phases, while these blocky Cr–Mo-rich precipitates are σ phases. The lattice spacing of B2 and σ phases are 0.198 and 0.454 nm, respectively. It is worth noting that these σ phases are apt to distribute at the phase boundaries between the BCC/B2 and coarse FCC. Comparing the EDS point scanning results between and , it is obvious that the Al and Mo contents in the incipient FCC phase are reduced after 26-hour annealing. This is mainly attributed to the presence of the hysteretic precipitation effect of HEAs. In the AlMo0.25FeCoCrNi2.1 HEA, the enthalpy of mixing of Al and Ni (- 22 kJ /mol) is the smallest, and therefore Al and Ni are more likely to form stable phases with BCC structures and precipitate out during the subsequent heat treatment process. The precipitation of Al-Ni-rich B2 phase reduces the Al content in the incipient FCC phase. Meanwhile, the enthalpy of mixing of Mo and Cr elements is zero, which makes it possible to have an infinite solid solution. The lattice constant of Mo atoms is larger than that of other atoms and the lattice distortion energy with other atoms is greater, making it segregate at the boundaries to reduce the lattice distortion. The precipitation of Cr–Mo-rich σ phase reduces the Mo content in the incipient FCC phases.
Figure 11. (a) TEM map, (b) high-magnification TEM map, (c) associated EDS test results and (d) associated SAED patterns and HRTEM images of coarse FCC phases in region P2 of AHT-26 sample.
shows the TEM results of fine incipient FCC/BCC lamellar structure in the region P2 of AHT-26 sample. The typical fine lamellar feature of microstructure can be observed clearly from the TEM maps in (a) and (b). The SAEDs shown in (d) identify the Al-poor laminas (Area 3) are FCC phases and the Al-rich laminas (Area 4) are BCC phases. Comparing and , it is noted that there is no needle-like B2 phase precipitating from the incipient thin FCC laminas. These needle-like B2 phases are apt to precipitate within the coarse FCC phases. This is because on one hand, the coarse FCC phases contain more lattice distortions and imperfections than the thin FCC phases. Therefore, the coarse FCC phases own higher lattice distortion energy to support the B2 to overcome the nucleation barrier and grow up than the thin FCC phases. On the other hand, the precipitation of Al-rich B2 phases (26.1 at%) needs to accumulate plenty of Al element from the incipient Al-pool FCC phase (5.2 at%). Comparing the and , it can be found that once these needle-like B2 phases precipitate, the Al content of the FCC phase near these B2 phases decreases from 5.2 at% to 4.8 at%. The thin FCC phase is too narrow and small to support enough Al element and space for the formation of needle-like B2 phases. Therefore, the precipitation of needle-like B2 is apt to happens in coarse FCC phases. According to the EDS results and associated SAED patterns shown in Figure 12(c) and (d), these blocky Cr–Mo-rich precipitates at the FCC/BCC boundaries are σ phases.
Figure 12. (a) TEM map, (b) high-magnification TEM map, (c) associted EDS test results and (d) associated SAED patterns and HRTEM images of fine FCC/BCC eutectic structures in region P2 of AHT-26 sample.
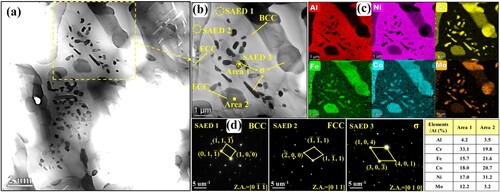
shows TEM images, EDS results and SAEDs of flower-like structures in region P3 of AHT-26 sample. The granular σ phases (Area 1) and FCC phases (Area 2) within the flower-like structures can be identified clearly by the brightness of Mo element from the EDS mapping results in (c). Comparing and , it is clear that after 26-hour annealing, on one hand, the number of granular σ phases within the flower-like BCC phases decreases, while the σ phases at the FCC/BCC phase boundaries (mainly at outlines of flower-like structures) coarsen significantly. On the other hand, some of the precipitated FCC phases within the flower-like BCC phases are not changed significantly in size. Notably, comparing to the EDS results of as-deposited FCC phases in , the Mo content of the precipitated FCC phases within the flower-like BCC structures decreases from 4.5 at.% to 3.2 at.% after 26-hour annealing, whereas the Mo content of granular σ phase increases from 11.2 at.% to 12.2 at.%.
Figure 13. (a) TEM map, (b) local amplified TEM map, (c) EDS mapping results and (d) SAED patterns of flower-like structures and precipitations in region P3 of AHT-26 sample.
3.4. Mechanical properties
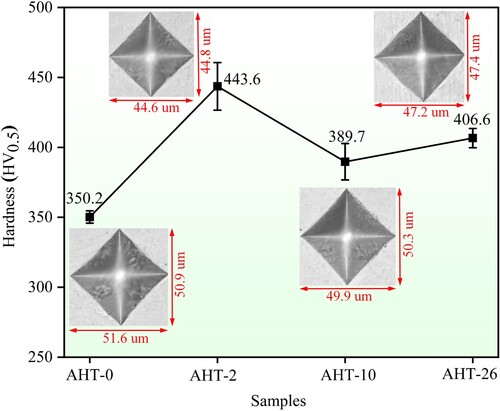
shows the Vickers hardness variations of AlMo0.25FeCoCrNi2.1 HEA with the increase of annealing time. The as-deposited microstructure of AHT-0 sample obtains an average hardness of 350.2 HV. Comparing to the hardness value 210 HV of AlFeCoCrNi2.1 HEA reported in previous work [Citation45], it is distinct that the adding of Mo could effectively improve the hardness of microstructure through entropy bringing in lattice distortion and enhancing the solid solution strengthening effect. After 2-hour annealing, the hardness of AHT-2 sample increases to 443.6 HV. The distinct increase of hardness mainly originates from the precipitation strengthening caused by the needle-like B2 phases within the incipient coarse FCC phases and the two-phase interface strengthening caused by σ phases. Subsequently, the hardness of AHT-10 sample decreases to 389.7 HV after 10-hour annealing heat treatment, which can be attributed to the further coarsening of these σ and needle-like B2 phases. The coarsening of the σ phases reduces the solid solution strengthening of Mo element within the incipient FCC phases. The AHT-26 sample obtains a 406.6 HV after 26-hour annealing. Consequently, the annealing heat treatment could improve the hardness of AlMo0.25FeCoCrNi2.1 HEA to some extent by the precipitation and coarsening of B2 and σ phases, and obtains the optimal value after 2-hour annealing.
Figure 14. The hardness variations of as-deposited and annealed AlMo0.25FeCoCrNi2.1 samples.
shows the tensile stress–strain
Figure 15. The tensile stress-strain curves of as-deposited and annealed AlMo0.25FeCoCrNi2.1 samples.
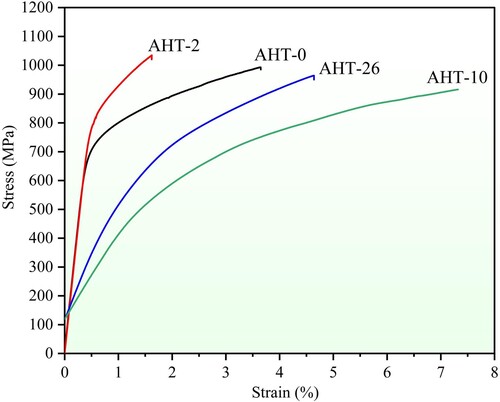
curves of AlMo0.25FeCoCrNi2.1 HEA. The detailed tensile data of all samples are shown in . The ultimate tensile stress (UTS) and elongation (E) of the AHT-0 sample are 993.0 MPa and 3.7%, respectively. After 2-hour annealing heat treatment, the UTS of AHT-2 sample increases to 1034.6 MPa, but the E decreases to 1.6%. The increase of UTS mainly results from precipitation strengthening of the needle-like B2 phases which can impede the dislocations motion. While, the hard and brittle σ phases at phase boundaries between FCC and BCC/B2 not only increase the brittleness of phase boundaries but also cause the accumulation of dislocations, resulting in the increasing of fracture susceptibility and risk of AlMo0.25FeCoCrNi2.1 HEA during tensile processes and leading to a decrease of its toughness. In particular, the UTS of AHT-10 sample is reduced to 915.8 MPa after 10-hour annealing, while the E increases to 7.3%. This is because the further coarsening of σ phases reduces the solid solution strengthening effect of Mo element, which finally contributes to the decrease of UTS and the increase of E. When the annealing time increases to 26 h, the UTS of AHT-26 sample increases to 963.9 MPa whereas the E decreases to 4.6%. This is because these continuously coarsened brittle σ phases at phase boundaries further increase the facture sensitivity of microstructure, and resultantly deteriorate the E with slight improvement of UTS during the tensile tests. Above all, the tensile properties of novel AlMo0.25FeCoCrNi2.1 HEA can be adjusted to some extent by proper annealing processing parameters. In this study, the optimised annealing parameters for strength-ductility trade-off are 900°C for 10 h.
Table 3. Tensile properties of AlMo0.25FeCoCrNi2.1 HEA at room temperature.
shows the tensile fracture surfaces of AlMo0.25FeCoCrNi2.1 HEA samples. It is distinct that the fracture surfaces of AHT-0 and AHT-2 samples shown in (a)-(d) exhibit a brittle fracture morphology with sparse dimples. Cleavage planes and some particles can be observed clearly on the fracture surfaces. According to the above microstructure analyses, these bare particles are granular σ phases. Meanwhile, as shown in (i) and (j), some residual Mo particles are exposed at the fracture surface. These Mo particles usually cause stress concentration and contribute to the deterioration of the toughness of AlMo0.25FeCoCrNi2.1 HEA. As shown in (e) and (g), with the further increase of annealing time, the fracture seems preferentially to happen at the phase boundaries. In other word, due to the precipitation and coarsening of numerous brittle σ phases at the phase boundaries between FCC and BCC/B2, the phase boundaries act as weak positions and are preferentially torn apart during the tensile test [Citation46,Citation47]. Above all, the hardness, UTS and E of AlMo0.25FeCoCrNi2.1 HEA are synthetically adjusted by residual stress release, precipitation and coarsening of the B2 and σ phases.
Figure 16. The tensile fracture morphologies of (a)-(b) AHT-0, (c)-(d) AHT-2, (e)-(f) AHT-10 and (g)-(h) AHT-26 samples. (i) and (j) are the high-magnification SEM map and associated EDS mapping results of bare Mo particles in (a). (k) and (l) are the high-magnification SEM maps of selected regions in (g) and (h), respectively.
3.5. Corrosion resistance
shows the electrochemical measurements of as-deposited and annealed AlMo0.25FeCoCrNi2.1 samples. According to the kinetic potential polarisation curves shown in (a), all the as-deposited and annealed samples exhibit a distinct passivation region. The corrosion potential (Ecorr) and corrosion current density (Icorr) of all samples are shown in . Usually, a smaller Icorr value relates to a more protective passive film and a better corrosion resistance. In this work, with the increase of annealing time from 0 h to 26 h, the Icorr firstly decreases from 0.65 μA to 0.20 μA with AHT-2 sample, and then increases to 1.20 μA with AHT-26 sample. The AHT-2 sample owns the smallest Icorr value and correspondingly obtains the best corrosion resistance among these samples, proving that suitable annealing could improve the corrosion resistance of the alloy. (b) shows the Bode plots of all samples. The AHT-2 sample owns the highest phase angle at the low-frequency region. The highest phase angle usually indicates that the densest and most stable passivation film is generated on the AHT-2 sample. Therefore, the corrosion resistance of AHT-2 sample is promoted.
Figure 17. (a) Kinetic potential polarisation curves, (b) Bode plots, (c) Nyquist plots and (d) Equivalent circuit of as-deposited and annealed AlMo0.25FeCoCrNi2.1 samples.
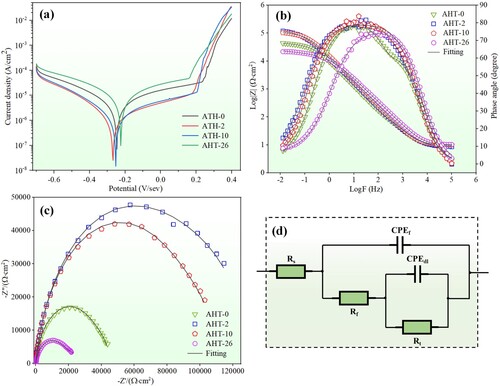
Table 4. Electrochemical corrosion parameters of as-deposited and annealed AlMo0.25FeCoCrNi2.1 samples.
(c) shows the Nyquist plots of the AlMo0.25FeCoCrNi2.1 samples. A larger radius of the capacitive loops usually means a better corrosion resistance. it is clear that AHT-26 and AHT-2 samples obtain the worst and best corrosion resistances, respectively. The results also confirm the optimal annealing time of the AlMo0.25FeCoCrNi2.1 HEA prepared in current work is 2 h. (d) shows the EIS fitting equivalent circuit diagrams of AlMo0.25FeCoCrNi2.1 samples, where Rt, Rf and Rs represents the charge transfer resistance, passivation film resistance and solution resistance, respectively. The constant phase element (CPE) is used to overcome inhomogeneity in circuit system [Citation48]. The fitting results of the EIS data are shown in . The AHT-2 sample owns the highest Rf value and correspondingly has the best corrosion resistance among all these samples, which agree well with the results in (a)–(c).
Table 5. Equivalent circuit parameters of impedance spectra of as-deposited and annealed AlMo0.25FeCoCrNi2.1 samples.
shows the surface morphologies and associated EDS mapping results of corrosion samples. As shown in (a), the corrosion mechanisms of AHT-0 sample mainly are intergranular corrosions with infrequent pit corrosions. The interdendritic regions and flower-like structures with BCC phases are corroded severely. The columnar dendrites or coarse grains with FCC phases maintain perfectly. This is because during the electrochemical corrosion in 3.5% NaCl solution, the Cr and Al are preferentially oxidised due to the relatively low Gibbs free energies for the formation of Cr2O3 and Al2O3 [Citation49], and form Cr-rich and Al-rich passive films on FCC phase and BCC/B2 phases, respectively [Citation50]. The Cr-rich passive films on the FCC phases are always more stable and compact than Al-rich passive films on BCC/B2 phases [Citation51]. Meanwhile, the Mo always forms MoO2, MoO3 or MoO42- and adheres to the Cr-rich passive films, further promoting the stability and compactness of Cr-rich passive films on FCC phases [Citation52]. Therefore, compared with FCC phases, the BCC/B2 phases are prone to dissolve. As shown in (b), numerous nanoscale corrosion pits form on the surface of remained FCC phases. This is because these precipitated needle-like B2 particles are corroded away. Comparing to the AHT-0 sample, the corrosion degree of AHT-2 sample is slightly mitigated. As shown in (c) and (d), the intergranular and pit corrosions of AlMo0.25FeCoCrNi2.1 HEA deteriorate gradually with the further increase of annealing time from 2 h to 26 h. The corrosion pits become large and distinct. This is because, on the one hand, the numerous coarsened B2 phases within FCC matrix further destroy the completeness of Cr-rich passive film on FCC phases, as shown in . On the other hand, the precipitation and coarsening of σ phases dramatically reduce the Cr and Mo concentration in the FCC phases and resultantly deteriorate the stability and compactness of Cr-rich passive films on FCC phases. Conclusively, the synergistic effects of precipitated B2 and σ phases deteriorate the corrosion resistance of microstructure with the further increase of annealing time from 2 h to 26 h.
Figure 18. Corrosion surface morphologies and associated EDS mapping results of high-magnification regions of (a) AHT-0, (b) AHT-2, (c) AHT-10 and (d) AHT-26 samples after kinetic potential polarisation test.
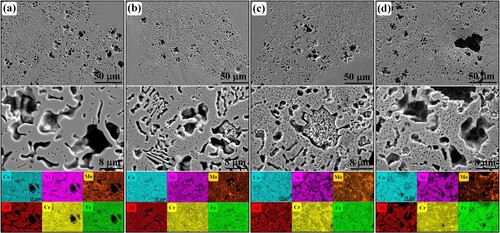
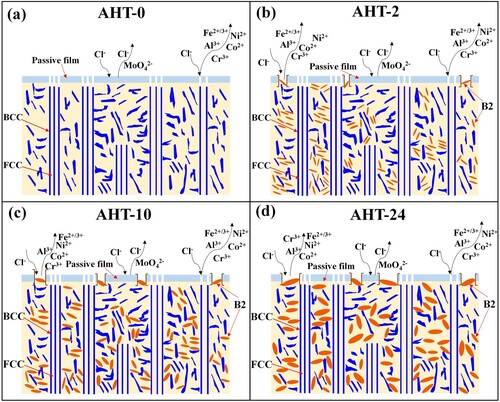
Figure 19. Schematic illustration of the destroy mechanism of passive film completeness on the FCC phase by precipitated needle-like B2 phases during the annealing heat treatment.
4. Conclusion
In this paper, a thin-wall structure of novel AlMo0.25FeCoCrNi2.1 HEA was fabricated using LDED process. The microstructure, mechanical properties and corrosion resistance of the alloy are investigated and adjusted by annealing heat treatment. The main findings of this study are as follows:
The inadequate melting and diffusion of Mo powders cause the nonuniform Mo concentration in the molten pool, and finally result in the microstructure diversity. With the increase of Mo concentration, the microstructure morphology transforms from FCC/BCC lamellar structures to flower-like BCC and coarse FCC structures, ultrafine σ/BCC eutectic lamellar and blocky FCC structures, and ultrafine σ/BCC eutectic structures around residual Mo particles. Nanoscale short rod-like and granular FCC and σ phases with relatively high Mo concentration precipitate within the flower-like BCC structures.
The annealing heat treatment promotes the precipitation and coarsening of numerous needle-like B2 phases in the coarse FCC phase and granular σ phases at phase boundaries between FCC and BCC/B2, synergistically adjusting the mechanical properties and corrosion resistance to some extent. The hardness of the microstructure is improved by at least 11.2% by annealing heat treatment. The ductility of the alloy deteriorates to 1.6% by 2-hour annealing with a minor increase of ultimate tensile strength to 1034.6 MPa, but is dramatically improved to 7.3% by 10-hour annealing with a slight loss of ultimate tensile strength to 915.8 MPa.
The corrosion resistance of the alloy is notably improved by 2-hour annealing heat treatment. With the further increase of annealing time, the corrosion resistance of the alloy decreases quickly with a degradation of passive films, due to the loss of Cr and Mo elements in FCC phases caused by the detrimental precipitation and coarsening of numerous σ phases.
CRediT authorship contribution statement
Zhaoyang Liu: Writing – original draft, Methodology, Investigation, Formal analysis, Supervision. Biyu Liang: Writing – review & editing, Data curation. Ruikun Wang: Writing – review & editing, Formal analysis. Zhongwei Liang: Writing – review & editing, Funding acquisition. Tao Zou: Writing – review & editing. Xiaochu Liu: Writing – review & editing.
Disclosure statement
No potential conflict of interest was reported by the author(s).
Data availability statement
The authors declare that all data supporting the findings of this study are available within the paper.
Additional information
Funding
References
- Cantor B, Chang ITH, et al. Microstructural development in equiatomic multicomponent alloys. Mater Sci Eng A. 2004;375:213–218. doi:10.1016/j.msea.2003.10.257
- Yeh J, Chen S, Lin S, et al. Nanostructured high-entropy alloys with multiple principal elements: novel alloy design concepts and outcomes. Adv Eng Mater. 2004;6(5):299–303. doi:10.1002/adem.200300567
- Wang H, He Q, Gao X, et al. Multifunctional high entropy alloys enabled by severe lattice distortion. Adv Mater. 2024;36(17):2305453. doi:10.1002/adma.202305453
- Krishna S, Noble N, Radhika N, et al. A comprehensive review on advances in high entropy alloys: fabrication and surface modification methods, properties, applications, and future prospects. J Manuf Process. 2024;109:583–606. doi:10.1016/j.jmapro.2023.12.039
- Zhang Y, Zhou Y, Lin J, et al. Solid-Solution phase formation rules for multi-component alloys. Adv Eng Mater. 2008;10(6):534–538. doi:10.1002/adem.200700240
- Shim SH, Pouraliakbar H, Minouei H, et al. Characterization of the microscale/nanoscale hierarchical microstructure of an as-cast CrMnFeNiCu high-entropy alloy with promising mechanical properties. J Alloys Compd. 2023;954:170091. doi:10.1016/j.jallcom.2023.170091
- Shim SH, Pouraliakbar H, Lee BJ, et al. Strengthening and deformation behavior of as-cast CoCrCu1.5MnNi high entropy alloy with micro-/nanoscale precipitation. Mater Sci Eng A. 2022;853:143729. doi:10.1016/j.msea.2022.143729
- Miracle D, Senkov O. A critical review of high entropy alloys and related concepts. Acta Mater. 2017;122:448–511. doi:10.1016/j.actamat.2016.08.081
- Qin Y, Wang Y, Guan S, et al. High-pressure preparation of high-hardness CoCrFeNiMo0.4 high-entropy alloy. Int J Refract Met Hard Mater. 2022;102:105718. doi:10.1016/j.ijrmhm.2021.105718
- Jin D, Wang Z, Yuan J, et al. High-strength and energetic Al2Ti6Zr2Nb3Ta3 high entropy alloy containing a cuboidal BCC/B2 coherent microstructure. J Alloys Compd. 2023;931:167546. doi:10.1016/j.jallcom.2022.167546
- Gorr B, Azim M, Christ H, et al. Phase equilibria, microstructure, and high temperature oxidation resistance of novel refractory high-entropy alloys. J Alloys Compd. 2015;624:270–278. doi:10.1016/j.jallcom.2014.11.012
- Samoilova O, Shaburova N, Ostovari Moghaddam A, et al. Al0.25CoCrFeNiSi0.6 high entropy alloy with high hardness and improved wear resistance. Mater Lett. 2022;328:133190. doi:10.1016/j.matlet.2022.133190
- Ren Y, Jia Q, Du Y, et al. A wear-resistant metastable CoCrNiCu high-entropy alloy with modulated surface and subsurface structures. Friction. 2022;10:1722–1738. doi:10.1016/j.jallcom.2020.154034
- Jiang D, Cui H, Zhao X, et al. Effect of potential difference in CoXCrNiMoCB high-entropy alloy coatings on corrosion resistance improvement. Mater Lett. 2023;330:133299. doi:10.1016/j.matlet.2022.133299
- Shuang S, Yu Q, Gao X, et al. Tuning the microstructure for superb corrosion resistance in eutectic high entropy alloy. J Mater Sci Technol. 2022;109:197–208. doi:10.1016/j.jmst.2021.08.069
- Zhang Y, Zuo T, Tang Z, et al. Microstructures and properties of high-entropy alloys. Prog Mater Sci. 2014;61:1–93. doi:10.1016/j.pmatsci.2013.10.001
- Lu Y, Dong Y, Guo S, et al. A promising New class of high-temperature alloys: eutectic high-entropy alloys. Rep. 2014;4:6200. doi:10.1038/srep06200
- Gao X, Lu Y, Zhang B, et al. Microstructural origins of high strength and high ductility in an AlCoCrFeNi2.1 eutectic high-entropy alloy. Acta Mater. 2017;141:59–66. doi:10.1016/j.actamat.2017.07.041
- He L, Wu S, Dong A, et al. Selective laser melting of dense and crack-free AlCoCrFeNi2.1 eutectic high entropy alloy: synergizing strength and ductility. J Mater Sci Technol. 2022;117:133–145. doi:10.1016/j.jmst.2021.11.049
- Vikram R, Murty B, Fabijanic D, et al. Insights into micro-mechanical response and texture of the additively manufactured eutectic high entropy alloy AlCoCrFeNi2.1. J Alloys Compd. 2020;827:154034. doi:10.1016/j.jallcom.2020.154034
- Duan X, Han T, Guan X, et al. Cooperative effect of Cr and Al elements on passivation enhancement of eutectic high-entropy alloy AlCoCrFeNi 2.1 with precipitates. J Mater Sci Technol. 2023;136:97–108. doi:10.1016/j.jmst.2022.07.023
- Shi H, Fetzer R, Jianu A, et al. Influence of alloying elements (Cu, Ti, Nb) on the microstructure and corrosion behaviour of AlCrFeNi-based high entropy alloys exposed to oxygen-containing molten Pb. Corros Sci. 2021;190:109659. doi:10.1016/j.corsci.2021.109659
- Matusiak K, Berent K, Marciszko M, et al. The experimental and theoretical study on influence of Al and Cu contents on phase abundance changes in AlxCuyFeCrNiCo HEA system. J Alloys Compd. 2019;790:837–846. doi:10.1016/j.jallcom.2019.03.162
- Nadutov V, Makarenko S, Volosevich P. Effect of aluminum on fine structure and distribution of chemical elements in high-entropy alloys AlxFeNiCoCuCr. Phys Met Metall. 2015;116(5):439–444. doi:10.1134/S0031918X15030096
- Raja Rao K, Sinha S. Strengthening of AlCoCrFeNi based high entropy alloy with nano- Y2O3 dispersion. Materials Science and Engineering: B. 2022;281:115720. doi:10.1016/j.mseb.2022.115720
- Rogal Ł, Kalita D, Litynska-Dobrzynska L. Cocrfemnni high entropy alloy matrix nanocomposite with addition of Al2O3. Intermetallics. 2017;86:104–109. doi:10.1016/j.intermet.2017.03.019
- Rogal L, Kalita D, Tarasek A, et al. Effect of SiC nano-particles on microstructure and mechanical properties of the CoCrFeMnNi high entropy alloy. J Alloys Compd. 2017;708:344–352. doi:10.1016/j.jallcom.2017.02.274
- Li Z, Xie D, liu Y, et al. Effect of WC on the microstructure and mechanical properties of laser-clad AlCoCrFeNi2.1 eutectic high-entropy alloy composite coatings. J Alloys Compd. 2024;976:173219. doi:10.2139/ssrn.4576412
- Zhang J, Li J, Jin T, et al. Effect of Mo concentration on creep properties of a single crystal nickel-base superalloy. Materials Science & Engineering A. 2010;527:3051–3056. doi:10.1007/BF02782418
- Cichocki K, Bała P, Kozieł T, et al. Effect of Mo on phase stability and properties in FeMnNiCo high-entropy alloys. Metallurgical and Materials Transactions A. 2022;53(5):1749–1760. doi:10.1007/s11661-022-06629-x
- Qin G, Chen R, Zheng H, et al. Strengthening FCC-CoCrFeMnNi high entropy alloys by Mo addition. J Mater Sci Technol. 2019;35(4):578–583. doi:10.1016/j.jmst.2018.10.009
- Li J, Yamanaka K, Chiba A. Significant lattice-distortion effect on compressive deformation in Mo-added CoCrFeNi-based high-entropy alloys. Mater Sci Eng A. 2022;830:142295. doi:10.1016/j.msea.2021.142295
- Shang X, Wang Z, Wu Q, et al. Effect of Mo addition on corrosion behavior of high-entropy alloys CoCrFeNiMox in aqueous environments. Acta Metallurgica Sinica (English Letters). 2019;32(1):41–51. doi:10.1007/s40195-018-0812-7
- Wu H, Zhang S, Wang Z, et al. New studies on wear and corrosion behavior of laser cladding FeNiCoCrMox high entropy alloy coating: The role of Mo. Int J Refract Met Hard Mater. 2022;102:105721. doi:10.1016/j.ijrmhm.2021.105721
- Ye Q, Yang G, Yang B. Effect of aging on microstructure and property of AlCoCrFeMo0.05Ni2 high entropy alloy. Mater Sci Eng A. 2019;760:1–6. doi:10.1016/j.msea.2019.05.058
- An J, Zhou Y, Yan M, et al. Effect of heat treatment on microstructure and mechanical properties of direct energy deposited AlCoCrFeNi2.1. J Therm Spray Technol. 2022;31(5):1634–1648. doi:10.1016/j.jallcom.2023.168843
- Shim, S. H., Pouraliakbar, H., Kim, Y. K., et al., Exploring the impact of heat treatment on the transformation of hierarchical microstructure and mechanical properties in a non-equiatomic CrMnFeNiCu high-entropy alloy with a reversible structure. J Alloys Compd. 2023, 969, 172514. doi:10.1016/j.jallcom.2023.172514
- Peng P, Feng X, Li S, et al. Effect of heat treatment on microstructure and mechanical properties of as-cast AlCoCrFeNi2.1 eutectic high entropy alloy. J Alloys Compd. 2023;939:168843. doi:10.3390/ma16227161
- Ye Q, Yang G, Yang B. Segregation engineering in a promising heat-resistant AlCoCrFeMo0.05Ni2 high entropy alloy. J Alloys Compd. 2021;869:159336. doi:10.1016/j.jallcom.2021.159336
- Liu W, Lu Z, He J, et al. Ductile CoCrFeNiMox high entropy alloys strengthened by hard intermetallic phases. Acta Mater. 2016;116:332–342. doi:10.1016/j.actamat.2016.06.063
- Hsu C, Wang W, Tang W, et al. Microstructure and mechanical properties of New AlCoxCrFeMo0.5Ni high-entropy alloys. Adv Eng Mater. 2010;12(1-2):44–49. doi:10.1002/adem.200900171
- Sui Q, Wang Z, Wang J, et al. Additive manufacturing of CoCrFeNiMo eutectic high entropy alloy: microstructure and mechanical properties. J Alloys Compd. 2022;913:165239. doi:10.1016/j.jallcom.2022.165239
- Shun T, Chang L, Shiu M. Microstructures and mechanical properties of multiprincipal component CoCrFeNiTix alloys. Mater Sci Eng A. 2012;556:170–174. doi:10.1016/j.msea.2012.06.075
- Wong S, Shun T, Chang C, et al. Microstructures and properties of Al0.3CoCrFeNiMnx high-entropy alloys. Mater Chem Phys. 2018;210:146–151. doi:10.1016/j.matchemphys.2017.07.085
- Guo W, Zhang Y, Ding N, et al. Understanding the microstructure evolution characteristics and mechanical properties of an AlCoCrFeNi2.1 high entropy alloy fabricated by laser energy deposition. Mater Sci Eng A. 2023;869:144795. doi:10.1016/j.msea.2023.144795
- Du B, Hu Z, Sheng L, et al. Microstructural characteristics and mechanical properties of the hot extruded Mg-Zn-Y-Nd alloys. J Mater Sci Technol. 2021;60:44–55. doi:10.1016/j.jmst.2020.05.021
- Du B, Hu Z, Sheng L, et al. Tensile, creep behavior and microstructure evolution of an as-cast Ni-based K417G polycrystalline superalloy. J Mater Sci Technol. 2018;34(10):1805–1816. doi:10.1016/j.jmst.2018.02.007
- Li M, Zeng C, Luo S, et al. Electrochemical corrosion characteristics of type 316 stainless steel in simulated anode environment for PEMFC. Electrochim Acta. 2003;48(12):1735–1741. doi:10.1016/S0013-4686(03)00113-0
- Gu X, Huang Q, Chen J, et al. Optimizing corrosion resistance of equiatomic AlCoCrFeNi high entropy alloys via heat treatment. J Alloys Compd. 2023;968:172091. doi:10.1016/j.jallcom.2023.172091
- Duan X, Han T, Guan X, et al. Cooperative effect of Cr and Al elements on passivation enhancement of eutectic high-entropy alloy AlCoCrFeNi2.1 with precipitates. J Mater Sci Technol. 2023;136:97–108. doi:10.1016/j.jmst.2022.07.023
- Huntz A, Schütze M. Stresses generated during oxidation sequences and high temperature fracture. Mater High Temp. 1994;12(2–3):151–161. doi:10.1080/09603409.1994.11689481
- Hayes J, Gray J, Szmodis A, et al. Influence of chromium and molybdenum on the corrosion of nickel-based alloys. Corrosion. 2006;62(6):491–500. doi:10.5006/1.3279907