
Abstract
Medical illustrations are an effective means of conveying complex information about cancer to patients and laypersons. However, there are no standard criteria for creating these illustrations. This study used online exploratory research focussed on laypersons to identify the aspects of an illustration that convey the optimal degree of detail and understand these findings. Six illustrations depicting pancreatic cancer and nine depicting cervical cancer, with high, medium, and low levels of detail, were created. A total of 420 participants (male = 210, female = 210, aged 20 years and above) answered an online questionnaire about these illustrations. The results indicated that female participants tended to prefer the same illustration level that they also found most comprehensible. Younger participants (under 40 years) tended to prefer illustrations with a medium level of detail for both cancers. Older participants (40 years and above) tended to prefer illustrations with a high level of detail for both cancers. This study was unable to determine the reasons behind these preferences. However, the researchers hypothesise that older people’s preference for higher levels of detail may be due to their greater concerns about cancer and because they find the illustrations to be more effective in conveying relevant information.
Introduction
Cancer was the second most common cause of death worldwide in 2018 (WHO, Citation2018). Thus, detailed cancer information is an important way to enhance health literacy (Koay, Schofield, & Jefford, Citation2012). In particular, illustrations that present complex medical information can help patients and laypersons to comprehend cancer information and are broadly recommended as a means of communication (Austin, Matlack, Dunn, Kesler, & Brown, Citation1995; Brotherstone, Miles, Robb, Atkin, & Wardle, Citation2006; Houts, Doak, Doak, & Loscalzo, Citation2006; Mansoor & Dowse, Citation2003; Scheltema, Reay, & Piper, Citation2018).
However, there are no standard criteria for creating these illustrations (Finan, Citation2002; Mcwhirter & Hoffman-Goetz, Citation2014; Scheltema et al., Citation2018). This may be because there has been insufficient research into which types of illustrations are best for conveying information and promoting patient education (Houts et al., Citation2006; Rose, Citation2016).
In this study, illustrations were classified according to their degree of detail. Previous studies have also categorised illustrations in this manner as high (HD, photorealistic), medium (MD, emphasising some parts), and low (LD, schematic) to establish a reproducible scientific method for assessing their efficacy (Pauwels, Citation2005; Strong & Erolin, Citation2013). However, the results of these prior studies have varied. Some indicated that simple and schematic illustrations are effective for patients (Houts, Witmer, Egeth, Loscalzo, & Zabora, Citation2001; Readence & Moore, Citation1981; Royak-Schaler et al., Citation2004; Weidenmann, Citation1989), while others indicated that laypeople prefer realistic and detailed illustrations when receiving health information (Strong & Erolin, Citation2013).
Some researchers have concluded that what patients consider a suitable degree of illustration detail might depend on demographics such as sex, age, familiarity with the information, and culture (Ancker, Senathirajah, Kukafka, & Starren, Citation2006; Austin et al., Citation1995; Dowse & Ehlers, Citation2001; Houts et al., Citation2006; Lee, Lee, & Kim, Citation2015; Schapira, Nattinger, & Mchorney, Citation2001). Additionally, some existing research suggests that proposing hypotheses related to these factors that can be tested in future research is more important than drawing conclusions (Houts et al., Citation2006).
Previous research suggests that determining which demographics influence patients’ preferences can help to ascertain how to tailor medical illustrations to specific situations. Therefore, this study aimed to explore the factors that affect the efficacy of an illustration and propose a hypothesis regarding what factors determine the optimal level of detail for an illustration. The research consisted of an online exploratory study focussed on laypersons.
Materials and methods
This study employed a quantitative design comprising an online questionnaire to evaluate the relevant factors and hypotheses. The survey questions asked laypersons which illustration they preferred – LD, MD, or HD – for both of the cancers. The survey then asked the participants to read some cancer information and indicate which illustration they thought was most suited to that information. The participants answered some preliminary questions on medical history and demographics before completing the questionnaire.
Participant sample
Participants (N = 420: male = 210, female = 210) were recruited through Macromill Inc, which is an internet research company in Japan. All participants were registered panellists of Macromill living in Japan. The surveys were conducted on 3 April 2020. Participants ranged in age from 20 to 70 years, and the mean age was 45.28 years (median = 45.00, SD = 15.24). Participants were divided into five age ranges (20s, 30s, 40s, 50s, and 60 or older), and each category was divided by gender. Each category contained an equal number of participants (20). Additionally, participants had to fulfil three requirements: 1) never diagnosed with any cancer; 2) never had a family member diagnosed with pancreatic and/or cervical cancer; and 3) not a health worker.
Cancers selected
Pancreatic and cervical cancers were selected for the illustrations. Pancreatic cancer is known as the ‘silent killer’ as it is difficult to detect in its early stages (Khokhar, Sher, & Schattner, Citation2017). This cancer type was chosen for the study because participants were unlikely to be familiar with its characteristics. Existing research suggests that medical illustrations are more effective in promoting knowledge of a subject when participants lack familiarity with the subject (Levin, Citation1981), and this study sought to test that assertion. Cervical cancer was chosen to help determine if there were any gender differences in the preference for the level of detail in the illustrations.
Informational text
The text used with the illustrations was taken from the National Cancer Centre Japan website, created by medical professionals to provide cancer information to patients and laypersons (https://ganjoho.jp/public/index.html). The pancreatic and cervical cancer information text was used – including details on the positional relationships between body organs and where the cancers originate – to create the illustrations and develop the survey (see sample text in Appendix).
Illustrations
This research categorised illustrations according to their degree of detail, referencing the surveys of Strong and Erolin (Citation2013) and Pauwels (Citation2005). Illustrations in HD, MD, and LD were used. The illustrations were created to illustrate the informational text.
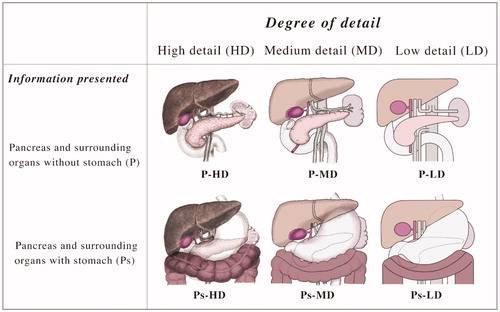
Illustrating the pancreas’s location in the body is especially complicated because the stomach is behind the pancreas in the frontal view. Thus, the text included with this illustration also explained the organ’s location, and the pancreas was shown in two views: with the surrounding organs excluding the stomach (P) and with the surrounding organs including the stomach (Ps). As shows, there were six illustrations in total for pancreatic cancer: HD, MD, and LD of P; and HD, MD, and LD of Ps.
Figure 1. Pancreatic cancer illustrations that vary in the degree of detail.
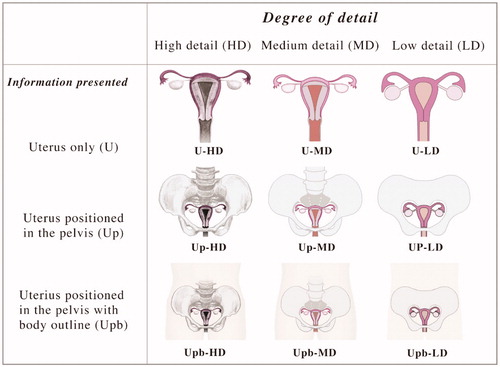
For cervical cancer, the illustrations needed to show the uterus and indicate its location. Illustrations with three configurations were created: uterus alone (U), uterus with the pelvis (Up), and uterus with the pelvis and body outline (Upb). As shows, there were nine illustrations in total for cervical cancer: HD, MD, and LD of U; HD, MD, and LD of Up; and HD, MD, and LD of Upb.
Figure 2. Uterine cervical cancer illustrations that vary in the degree of detail.
The illustrations were created in Adobe Illustrator by two medical illustrators with master’s degrees in fine art, specialising in artistic anatomy. One created the illustrations, and the other evaluated their accuracy.
Procedure and measures
The survey was approved by the Ethical Review Boards of Ritsumeikan University (No. Kinugasa-Human-2018-75), the National Cancer Centre (No. 2018-399), and Saitama Prefectural University (No. 20035), and informed consent was obtained from all participants through the online survey system. This study was conducted according to the principles of the Declaration of Helsinki.
The study measured participants’ demographic characteristics and self-perceived existing knowledge about each cancer. Previous research indicated that illustrations would not be effective for participants with high levels of existing knowledge about these diseases (Levin, Citation1981). Therefore, the survey asked what previous knowledge participants had of pancreatic and cervical function and shape in the human body with the following questions: ‘Do you know the function of the pancreas/uterus (including the cervix)?’; and ‘Do you know the shape of the pancreas/uterus (including the cervix)?’ Participants answered with ‘Yes’ or ‘No’.
Perceived effectiveness of the illustrations
For both cancers, each participant was asked the following:
Q1: Which illustration did you prefer? Which did you least prefer?
Next, participants read the informational text for each cancer and were asked the following:
Q2: Which illustration was the most comprehensible when accompanied by the text?
Analysis
Q1 and Q2 were employed to determine which illustrations were perceived as the best and worst. Chi-squared tests were used to analyse the answers to each question, along with cross-tabulation of the chi-squared analysis results with the demographic data and perceived previous knowledge of each cancer. For this analysis, age categories were divided into under 40 and over 40, as 40 was the median age. All the data were analysed using IBM SPSS (version 24.0; IBM Corp.), and the statistical significance was set at p ≤ 0.05.
Results
Sample characteristics and descriptive statistics
The total number of participants was N = 420 (male = 210, female = 210). The self-perceived existing knowledge of the cervix and pancreas are shown in for each age category.
Table 1. Participant details and perceived knowledge of the cancers (N = 420)
Preferred illustrations
First, each type of illustration was evaluated for each cancer, as shown in and .
Table 2. Pancreatic cancer: evaluated most preferable, least preferable, and comprehensible for all illustrations.
Table 3. Cervical cancer: evaluated most preferable, least preferable, and comprehensible for all illustrations.
Pancreatic cancer
The results of the chi-squared test of independence for the most preferred, least preferred, and most comprehensible among these six illustrations were as follows ().
Cervical cancer
The results of the chi-squared test of independence for the most preferred, least preferred, and most comprehensible among these nine illustrations were as follows ().
Second, each cancer illustration was evaluated in regard to its degree of detail.
Pancreatic cancer
As shown in , a statistically significant most preferable illustration type was found (χ2(2) = 15.700, p < .01): MD illustrations were deemed more preferable than HD and LD illustrations, as judged by the residuals. A statistically significant least preferable illustration type was also found (χ2(2) = 187.300, p < .01): HD illustrations were deemed less preferable than MD and LD, as judged by the residuals. In addition, a statistically significant most comprehensible illustration type was found (χ2(2) = 49.771, p < .01): HD and MD illustrations were considered more comprehensible than LD illustrations, as judged by the residuals.
Table 4. Pancreatic cancer: evaluated most preferable, least preferable, and comprehensible for all detail degrees.
Cervical cancer
As shows, a statistically significant most preferable illustration (type) was found (χ2(2) = 43.300, p < .01): MD illustrations were deemed more preferable than HD and LD illustrations, as judged by the residuals. A statistically significant least preferable illustration was also found (χ2(2) = 192.271, p < .01): HD and LD illustrations were deemed less preferable than MD, as judged by the residuals. Additionally, a statistically significant most comprehensible illustration was found (χ2(2) = 54.557, p < .01): MD and HD illustrations were more comprehensible than LD illustrations, as judged by the residuals.
Table 5. Cervical cancer: evaluated most preferable, least preferable, and comprehensible for all detail degrees.
Comparison of preferred illustrations’ degrees of detail by gender
Next, a cross-tabulation to compare the relationships between variables to compare gender (male or female) and age (under or over 40) with the results above was conducted. Chi-squared tests were also conducted to investigate the distribution of categorical variables, as shown in and .
Table 6. Pancreatic cancer: cross-tabulation comparing the relationships between gender and illustrations’ degrees of detail.
Table 7. Cervical cancer: cross-tabulation comparing the relationships between gender and illustrations’ degrees of detail.
Pancreatic cancer
A statistically significant preferable illustration was found (χ2(2) = 7.985, p < .05). Females deemed MD illustrations more preferable than males did, as judged by the adjusted residual (females: 2.8; males: −2.8, p < .01), and males deemed HD illustrations more preferable than females did, as judged by the adjusted residual (males: 2.0 and females: −2.0, p < .05). These results are shown in . Females deemed MD illustrations more comprehensible than males did, as judged by the adjusted residual (females: 3.2; males: −3.2, p < .01), and males deemed LD illustrations more preferable than females did, as judged by the adjusted residual (males: 2.1; females: −2.1, p < .05).
Cervical cancer
These results are shown in . First, a statistically significant preferable illustration was found (χ2(2) = 17.754, p < .01). Females deemed MD illustrations more preferable than males did, as judged by the adjusted residual (females: 4.2; males: −4.2, p < .01), and males deemed HD illustrations more preferable than females did, as judged by the adjusted residual (males: 2.9; females: −2.9, p < .01).
Finally, a statistically significant most comprehensible illustration was found (χ2(2) = 12.855, p < .01). Females deemed MD illustrations more comprehensible than males did, as judged by the adjusted residual (females: 3.5; males: −3.5, p < .01), and males deemed LD illustrations more preferable than females, as judged by the adjusted residual (males: 2.2; females: −2.2, p < .05).
Comparison of preferred illustrations’ degrees of detail by age
Pancreatic cancer
A statistically significant preferable illustration was found (χ2(2) = 8.658, p < .05). The younger group deemed MD illustrations more preferable than the older group did, as judged by the adjusted residual (younger: 2.6; older: −2.6, p < .01), and the older group deemed HD illustrations more preferable than the younger group, as judged by the adjusted residual (older: 2.6; younger: −2.6, p < .01). These results are shown in .
Table 8. Pancreatic cancer: cross-tabulation comparing the relationships between two age ranges and illustrations’ degrees of detail.
Cervical cancer
A statistically significant preferable illustration was found (χ2(2) = 10.419, p < .01). The younger group deemed MD illustrations more preferable than the older group did, as judged by the adjusted residual (younger: 3.1; older: −3.1, p < .01), and the older group deemed HD illustrations moFre preferable than the younger group did, as judged by the adjusted residual (older: 2.6; younger: −2.6, p < .01). These results are shown in .
Table 9. Cervical cancer: cross-tabulation comparing the relationships between two age ranges and illustrations’ degree of detail.
Discussion
Cancer was the second most common cause of death worldwide in 2018 (WHO, Citation2018). Therefore, detailed cancer information is crucial to enhance health literacy (Koay et al., Citation2012). Although some studies have recommended illustrations as an effective means of communicating information (Austin et al., Citation1995; Brotherstone et al., Citation2006; Houts et al., Citation2006; Mansoor & Dowse, Citation2003; Scheltema et al., Citation2018), there is little consensus about which types of illustration are most suitable for expressing information and educating patients. Additionally, several factors like age, gender, and existing knowledge may influence whether an illustration is effective for a particular person (Ancker et al., Citation2006; Austin et al., Citation1995; Dowse & Ehlers, Citation2001; Houts et al., Citation2006; Lee et al., Citation2015; Schapira et al., Citation2001). Thus, it is imperative to test various factors and create and evaluate hypotheses about the effective degrees of detail to include in illustrations.
This study demonstrated that the preferred degree of detail in illustrations seems to vary with gender and age. This is especially true of gender, with females much more likely than males to choose the same degrees of detail for an illustration as both preferable and comprehensible. However, the study was unable to determine the reason for the same. As this study was conducted in Japan, where traditional gender roles are still prevalent, future research could focus on whether this finding emerged due to those conventional gender roles (Arber & Ginn, Citation1995; Stimpson, Jensen, & Neff, Citation1992; Won & Pascall, Citation2004). The female preference for more detailed and intelligible illustrations may reflect the expectation that a woman’s role in the household is to secure timely and accurate health information for her family.
Interestingly, in Korea, where there are similar gender expectations, research has reported that adult Korean women (aged 19–59) have higher health literacy levels than Korean men of the same age (Lee et al., Citation2015). The same pattern has also been reported in British adults (von Wagner, Knight, Steptoe, & Wardle, Citation2007), elderly Koreans (Park & June, Citation2011), and adults in the United States (Sudore et al., Citation2006). This suggests a broad tendency for females to have higher health literacy levels. Thus, it could be said that the female preference for detailed and comprehensible illustrations is related to women’s health literacy level. Although this study did not measure health literacy levels, this observation could help frame future research questions and improve health communication.
Additionally, after participants were divided into two age groups (under and over 40), the younger group exhibited a statistically significant stronger preference for MD illustrations of both cancers than the older group, who showed a statistically significant preference for HD illustrations of cervical cancer for comprehensibility. This tendency was also apparent for pancreatic cancer illustrations, although it was not statistically significant. The researchers hypothesise that the older a person is, the more concerned with cancer information they become and that, therefore, older participants might consider HD illustrations more preferable and comprehensible. To confirm this hypothesis, additional interviews or questionnaire surveys should be conducted. Unfortunately, the research could not determine why 40 years is the age at which preferences bifurcate. The researchers also looked at a different age bifurcation (under and over 45 years), but this was not significantly different. More research is needed into the reasons why preferences change in the 40s.
Further, this study did not show any statistically significant association between previous cancer knowledge and the patient’s preferred degree of illustration detail. This is in line with previous findings (Levin, Citation1981). However, this finding might also have been influenced by the fact that less than 50% of participants knew about the pancreas’s shape and function; conversely, more than 50% of participants knew about the shape and function of the uterus (including the cervix). In the descriptive statistics regarding the cervical cancer illustrations, the most preferred illustration was MD (n = 201(%)), which was also the most comprehensible one (n = 198(%)). However, for pancreatic cancer illustrations, the most preferred illustration was MD (n = 178(%)), and the most comprehensible one was HD (n = 178(%)). This may indicate that laypersons tend to choose HD illustrations if they have no previous knowledge of the subject, although this was not verified by cross-tabulation or chi-squared tests. Therefore, future research should evaluate this hypothesis further by analysing illustrations for more cancer types and determining participants’ previous level of knowledge of not only organ shape but also cancer symptoms.
A limitation of this study was that it was conducted only in Japan, and Japanese cultural norms might have influenced the results; the effect of including more nearby organs in the illustrations could not be determined. Future research should build upon the findings and hypotheses of this study to further determine the best way to illustrate not only cancer information but also other health information.
Conclusion
This study explored the factors that might affect an illustration’s optimal degree of detail through online exploratory research focussed on laypersons and hypothesised reasons for the results. It revealed that females tended to regard more comprehensible illustrations as more preferable than males did; older participants tended to regard HD illustrations as the most comprehensible. Several hypotheses arise from these results, such as that the preference for HD illustrations in older people is due to how concerned they are to learn about cancer and that HD illustrations are more effective for participants unfamiliar with the subject. To verify these factors and test these hypotheses, future research should utilise further interviews and questionnaire surveys, as well as team up with other research areas such as cognitive science. The results of this future research could have broad implications for solving several health information problems.
Acknowledgements
The authors thank all participants and the technical support at Macromill, Inc. The authors especially appreciate the support of the DNP Foundation.
Disclosure statement
The authors report no conflict of interest.
Data availability statement
The datasets generated and/or analysed during this study are not publicly available, as they include personal data; however, they are available from the corresponding author on reasonable request.
Additional information
Funding
References
- Ancker, J.S., Senathirajah, Y., Kukafka, R., & Starren, J.B. (2006). Design features of graphs in health risk communication: A systematic review. Journal of the American Medical Informatics Association : JAMIA, 13, 608–618. doi:10.1197/jamia.M2115
- Arber, S., & Ginn, J. (1995). Gender differences in informal caring. Health & Social Care in the Community, 3, 19–31. doi:10.1111/j.1365-2524.1995.tb00003.x
- Austin, P.E., Matlack, R., Dunn, K.A., Kesler, C., & Brown, C.K. (1995). Discharge instructions: Do illustrations help our patients understand them? Annals of Emergency Medicine, 25, 317–320. doi:10.1016/s0196-0644(95)70286-5
- Brotherstone, H., Miles, A., Robb, K.A., Atkin, W., & Wardle, J. (2006). The impact of illustrations on public understanding of the aim of cancer screening. Patient Education and Counseling, 63, 328–335. doi:10.1016/j.pec.2006.03.016
- Dowse, R., & Ehlers, M.S. (2001). The evaluation of pharmaceutical pictograms in a low-literate South African population. Patient Education and Counseling, 45, 87–99. doi:10.1016/S0738-3991(00)00197-X
- Finan, N. (2002). Visual literacy in images used for medical education and health promotion. The Journal of Audiovisual Media in Medicine, 25, 16–23. doi:10.1080/0140511022011837X
- Houts, P.S., Doak, C.C., Doak, L.G., & Loscalzo, M.J. (2006). The role of pictures in improving health communication: A review of research on attention, comprehension, recall, and adherence. Patient Education and Counseling, 61, 173–190. doi:10.1016/j.pec.2005.05.004
- Houts, P.S., Witmer, J.T., Egeth, H.E., Loscalzo, M.J., & Zabora, J.R. (2001). Using pictographs to enhance recall of spoken medical instructions II. Patient Education and Counseling, 43, 231–242. doi:10.1016/s0738-3991(00)00171-3
- Khokhar, A.S., Sher, A.F., & Schattner, M. (2017). Interventional endoscopy in the diagnosis and management of pancreatic adenocarcinoma. Chinese Clinical Oncology, 6, 63. doi:10.21037/cco.2017.12.02
- Koay, K., Schofield, P., & Jefford, M. (2012). Importance of health literacy in oncology. Asia-Pacific Journal of Clinical Oncology, 8, 14–23. doi:10.1111/j.1743-7563.2012.01522.x
- Lee, H.Y., Lee, J., & Kim, N.K. (2015). Gender differences in health literacy among Korean adults: Do women have a higher level of health literacy than men? American Journal of Men's Health, 9, 370–379. doi:10.1177/1557988314545485
- Levin, J.R. (1981). On functions of pictures in prose. In F. J. Pirozzolo and M. C. Wittrock (Eds.), Neuropsychological and cognitive processes in reading (pp. 203–228). New York: Academic Press.
- Mansoor, L.E., & Dowse, R. (2003). Effect of pictograms on readability of patient information materials. The Annals of Pharmacotherapy, 37, 1003–1009. doi:10.1345/aph.1C449
- Mcwhirter, J.E., & Hoffman-Goetz, L. (2014). A systematic review of visual image theory, assessment, and use in skin cancer and tanning research. J Health Commun, 19, 738–757. doi:10.1080/10810730.2013.837562
- Park, J., & June, K. (2011). Influencing factors on functional health literacy among the rural elderly. Journal of Korean Academy of Community Health Nursing, 22, 75. doi:10.12799/jkachn.2011.22.1.75
- Pauwels, L. (2005). A theoretical framework for assessing visual representational practices in knowledge building and science communications. In: Pauwels, L. (Ed.), Visual culture of science: Rethinking representational practices in knowledge building and science communications (pp. 1–25). Hanover, NH: University Press of New England.
- Readence, J.E., & Moore, D.W. (1981). A meta-analytic review of the effect of adjunct pictures on reading comprehension. Psychology in the Schools, 18, 218–224. doi:10.1002/1520-6807(198104)18:2<218::AID-PITS2310180219>3.0.CO;2-1
- Rose, G. (2016). Visual methodologies: an introduction to researching with visual materials. Newbury Park, CA: Sage.
- Royak-Schaler, R., Blocker, D.E., Yali, A.M., Bynoe, M., Briant, K.J., & Smith, S. (2004). Breast and colorectal cancer risk communication approaches with low-income African-American and Hispanic women: Implications for healthcare providers. Journal of the National Medical Association, 96, 598–608.
- Schapira, M.M., Nattinger, A.B., & Mchorney, C.A. (2001). Frequency or probability? A qualitative study of risk communication formats used in health care. Medical Decision Making : An International Journal of the Society for Medical Decision Making, 21, 459–467. doi:10.1177/0272989X0102100604
- Scheltema, E., Reay, S., & Piper, G. (2018). Visual representation of medical information: the importance of considering the end-user in the design of medical illustrations. Journal of Visual Communication in Medicine, 41, 9–17. doi:10.1080/17453054.2018.1405724
- Stimpson, D., Jensen, L., & Neff, W. (1992). Cross-cultural gender differences in preference for a caring morality. The Journal of Social Psychology, 132, 317–322. doi:10.1080/00224545.1992.9924706
- Strong, J., & Erolin, C. (2013). Preference for detail in medical illustrations amongst professionals and laypersons. Journal of Visual Communication in Medicine, 36, 38–43. doi:10.3109/17453054.2013.790793
- Sudore, R.L., Yaffe, K., Satterfield, S., Harris, T.B., Mehta, K.M., Simonsick, E.M., … Schillinger, D. (2006). Limited literacy and mortality in the elderly: The health, aging, and body composition study. Journal of General Internal Medicine, 21, 806–812. doi:10.1111/j.1525-1497.2006.00539.x
- von Wagner, C., Knight, K., Steptoe, A., & Wardle, J. (2007). Functional health literacy and health-promoting behaviour in a national sample of British adults. Journal of Epidemiology and Community Health, 61, 1086–1090. doi:10.1136/jech.2006.053967
- Weidenmann, B. (1989). When good pictures fail: An information-processing approach to the effect of illustrations. In: Mandl, H., and Levin, J. R. (Eds.), Knowledge acquisition from text and pictures (pp. 157–171), Amsterdam: Elsevier.
- WHO. 2018. Cancer [Online]. Retrieved August 18, 2020, from www.who.int/news-room/fact-sheets/detail/cancer
- Won, S.-Y., & Pascall, G. (2004). A Confucian war over childcare? Practice and policy in childcare and their implications for understanding the Korean gender regime. Social Policy Administration, 38, 270–289. doi:10.1111/j.1467-9515.2004.00390.x
Appendix
Pancreatic cancer (text sample)
About the pancreas
The pancreas is a long, slender organ about 20 cm long, located behind the stomach. The right side of the pancreas is called the pancreatic head, and it is surrounded by the duodenum. The narrower part on the left is called the caudal (tail), and it touches the spleen. The middle part of the pancreas is called the body. A long, thin tube called the pancreatic duct runs through the pancreas.
The pancreas performs two functions: the production of pancreatic enzyme to help digest food (exocrine function) and that of hormones (such as insulin) to regulate blood sugar levels (endocrine function). Pancreatic enzyme flows through the pancreatic ducts and collects in a single, main duct called the main pancreatic duct. The enzyme then meets with bile from the liver in the common bile duct at the papillae of the duodenum and flows into the duodenum.
What is pancreatic cancer?
More than 90% of all cancers in the pancreas occur in the cells of the pancreatic ducts. This is called pancreatic duct cancer, and ‘pancreatic cancer’ usually refers to this type of cancer. Other types of cancer of the pancreas include neuroendocrine tumours and papillary mucous tumours in the pancreatic ducts.
Symptoms of pancreatic cancer
As the pancreas is located deep inside the body cavity behind the stomach, it is not easy to detect pancreatic cancer in the early stages, as the symptoms are not perceived.
Cervical cancer (text sample)
About the uterus, including the cervix
The uterus is an organ located in a woman’s pelvis and is about the size of a hen’s egg by adulthood. The uterus comprises the cylindrical cervix, situated at the bottom, and the pouch-shaped body at the top. The cervix is connected to the vagina, and the fallopian tubes extend from the body of the uterus on either side. The basal ligament is a tissue around the cervix (paracervical tissue) and supports the uterus.
The foetus is nurtured in the uterus during pregnancy. The uterus is composed of muscle, and the inside is lined with a mucous membrane called the endometrium. When the endometrium is exposed to the hormone oestrogen secreted by the ovaries, it thickens in preparation for implantation of a fertilised egg, and if there is no pregnancy, the endometrium sloughs off. This is called menstruation, and the cycle usually repeats every four weeks until menopause.
What is cervical cancer?
Uterine cancer is classified into two types: cancer of the body of the uterus and cervical cancer. Cervical cancer occurs near the entrance of the uterus, called the cervix, which makes it easy to detect, observe, and examine in the course of a gynaecological examination. It is relatively easy to treat and has a good prognosis if it is detected at an early stage; however, it is difficult to treat once it has progressed, so early detection is extremely important.
As cervical cancer progresses, it can spread to the lymph nodes in the pelvis, spreading through the ligaments that support the uterus to other organs such as the lungs through blood and lymphatic vessels.
Symptoms of cervical cancer
Cervical cancer does not develop quickly but rather over several years of pre-cancerous development known as dysplasia. There are no symptoms, discharge, bleeding, or pain during dysplasia. As it progresses, there may be blood outside of menstruation or during intercourse, dark brown or pus-like discharge, or watery discharge or mucus. Further, there may be lower abdominal or back pain or blood or urine in the stool. Any woman experiencing worrying symptoms should not hesitate to consult a gynaecologist at the earliest.