Abstract
Background Periacetabular osteotomy improves radiographic predictors of osteoarthrosis and diminishes pain and functional impairment. No changes in function quantified by gait analysis have yet been documented. We evaluated the functional outcome of periacetabular osteotomy in relation to gait.
Methods The gait pattern of 9 women (median age 39 years) with hip dysplasia who were treated with unilateral periacetabular osteotomy was analyzed before periacetabular osteotomy and an average of 1.5 years afterwards. Data were collected using 5 video cameras and 2 force plates. An inverse dynamics approach was used to calculate sagittal joint angles and moments in the stance phase.
Results Postoperatively, all subjects walked with an increased extension of the knee joint during the entire stance phase compared to the preoperative movement pattern.
Interpretation The subjects achieved a more upright walking pattern but continued to relieve the hip joint by maintaining a reduced flexor moment.
If diagnosed and treated early, the prognosis of developmental dysplasia of the hip is good. If diagnosed late or left untreated, however, it will lead to early osteoarthrosis (Trousdale et al. Citation1995). Reduced covering of the femoral head mainly anteriorly and laterally results in an insufficient load-bearing surface of the femoral head (Hadley et al. Citation1990, Murphy et al. Citation1990). Adults with hip dysplasia may be treated with periacetabular osteotomy if there is absence of or only mild signs of osteoarthrosis. Developed by Ganz, the periacetabular osteotomy used in our study is a three-dimensional reorientation of the acetabulum which improves the coverage of the femoral head (Ganz et al. Citation1988, Crockarell, Jr. et al. Citation1999, Matta et al. Citation1999, Siebenrock et al. Citation1999, Trumble et al. Citation1999, Leunig et al. Citation2001, Soeballe Citation2003).
Periacetabular osteotomy improves the pathological CE-angle and other radiographic predictors of outcomes (Crockarell, Jr. et al. Citation1999, Dutoit and Zambelli Citation1999). Additionally, it has been shown that pain and functional impairment can be reduced (Crockarell, Jr. et al. Citation1999, Hickman and Peters, Citation2001, Hsieh et al. Citation2003, Siebenrock et al. Citation2003, Yasunaga et al. Citation2003). Recently, van Bergayk and Garbuz (Citation2002) have shown a significant improvement in quality of life and sports-specific outcomes. In general, functional improvements after periacetabular osteotomy have been measured with different kinds of scores such as the Merle d’Aubigné and Harris Hip Score (Trousdale et al. Citation1995, Crockarell, Jr. et al. Citation1999, Siebenrock et al. Citation1999, Trumble et al. Citation1999). No changes in function quantified by means of gait analysis have yet been documented.
Pain and the pathological deformity in the hip joint lead to changes in joint moments and power generated around the ankle, knee and hip joint. Recent studies have revealed that subjects with hip dysplasia walk with a gait pattern—characterized by increased flexion and reduced hip flexor joint moment—which is different to that of control subjects (Romano et al. Citation1996, Pedersen et al. Citation2004).
We evaluated the functional outcome of periacetabular osteotomy in relation to gait. Joint angles and inverse dynamics calculations of joint moments about the ankle, knee and hip joints in the sagittal plane were used to quantify the walking patterns of 9 women with hip dysplasia both before and after periacetabular osteotomy.
Patients and methods
The gait pattern of 9 women treated with unilateral periacetabular osteotomy was analyzed before and after the surgical intervention. The median age at surgery was 39 (24–50) years. Median weight at the preoperative gait analysis was 68 (52–83) kg, while at the postoperative gait analysis the median weight was 78 (55–99) kg. 14 women had originally participated in the preoperative gait analysis (Pedersen et al. Citation2004). Of these 14 patients, 3 declined participation in the follow-up and 2 were excluded because of development of osteoarthrosis (and were thus referred to total hip replacement). All subjects were patients at the Department of Orthopedics, Aarhus Amtssygehus, Aarhus University Hospital and were treated by the same surgeon (KS). The ilioinguinal approach without intertrochanteric osteotomy was used.
The severity of the subjects’deformities was classified by the CE-angle, which quantifies the lateral coverage of the femoral head. The hip classification developed by Tönnis (Citation1984) was used to measure the degeneration of the hip joint before the intervention. Pain was measured with the Visual Analog Scale (VAS). The postoperative VAS score was measured at follow-up 3–18 months after the surgical intervention. Among the participating subjects, the median preoperative CE-angle was 6 (-13–18) degrees. The median postoperative CE-angle was 32 (27–35) degrees. 2 hips had osteoarthrosis of grade 0 (no signs of osteoarthrosis), 5 of grade I (mild osteoarthrosis) and 2 of grade II (moderate osteoarthrosis). The preoperative VAS score measured at the last consultation before surgery ranged from 5.5 to 9. Postoperatively, 1 subject had a VAS score of 1 while all other subjects reported a VAS score of zero. The median follow-up time from periacetabular osteotomy to gait analysis was 18 (13–24) months. All subjects gave their informed consent to participate in the study, which was approved by the local ethics committee.
Gait analysis
The experimental set-up has been described previously (Pedersen et al. Citation2004). The subjects were asked to walk across 2 force platforms (AMTI, OR6-5-1) at a speed of 4.5 km/h. 15 small reflective spherical markers (12 mm diameter) were placed on the subjects according to the marker set-up described by Vaughan et al. (Citation1992). 5 video cameras (Panasonic WV-GL350) operating at 50 Hz were used to record the movements. The subjects triggered the data sampling and synchronization when they passed a photocell. Three-dimensional coordinates were then reconstructed by direct linear transformation using the Arial Performance Analysis System (APAS).
Calculations
All calculations and mathematical models were identical to those of the initial gait analysis (Pedersen et al. Citation2004). Joint angles of the ankle, knee and hip were calculated to describe the movements in the sagittal plane. Internal flexor and extensor joint moments about the ankle, knee and hip were calculated using the three-dimensional inverse dynamics approach described by Vaughan et al. (Citation1992). Internal net joint moments provided information on whether flexor or extensor muscles dominated the joints. Additionally, the angular impulse was calculated to quantify the total contribution of a joint moment to produce movement.
Normalization and data reduction
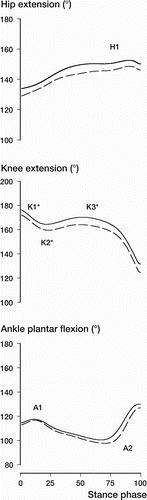
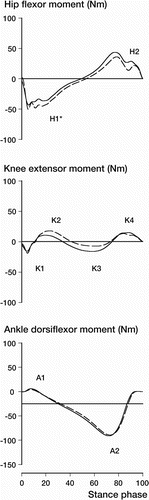
6 gait cycles were normalized and averaged for each subject. The gait cycles were normalized to 500 sample points by interpolation. Only the stance phase was analyzed. To identify any changes between the preoperative and the postoperative gait patterns, peak values of joint angles and joint moments were tested statistically. Joint angle peak values for the ankle joint were maximal plantar flexion in the first half of the stance phase (A1) and maximal dorsiflexion in the second half of the stance phase (A2). For the knee, the peak values were extension at heel strike (K1), maximal flexion in the first half of the stance phase (K2) and maximal extension in the second half of the stance phase (K3). For the hip, the maximal extension (H1) was used. Regarding the joint moments, peak values for the ankle joint were maximal dorsiflexor dominance in the first half of the stance phase (A1) and maximal plantar flexor dominance in the second half of the stance phase (A2). For the knee, 4 peak values were used. These were maximal flexor (K1) and extensor (K2) dominance in the first half of the stance phase and maximal flexor (K3) and extensor (K4) dominance in the second half of the stance phase. For the hip, maximal extensor dominance in the first half of the stance phase (H1) and maximal flexor dominance in the second half of the stance phase (H2) were used.
Statistics
Changes between the preoperative and the postoperative gait pattern were tested statistically using the Wilcoxon signed rank test. The results are presented as mean (95% CI of the mean). The level of significance was set at 5%.
Results
Joint angles ()
The Table shows the peak values A1 and A2 for the ankle, K1 to K3 for the knee and H1 for the hip. Statistically significant differences were seen for all three peak values for the knee joint. Maximal extension at heel strike (K1) was 172 (3) preoperatively and 176 (2) postoperatively (p = 0.04). Maximal knee flexion in the first half of the stance phase (K2) was 159 (3) preoperatively and 164 (3) postoperatively (p = 0.02). Maximal extension (K3) was 165 (4) preoperatively and 171 (3) postoperatively (p = 0.004).
Figure 1. Averaged joint angles of the ankle, knee and hip in the postoperative gait analysis (solid line) and preoperative gait analysis (dashed line). Zero on the x-axis indicates heel strike and 100 toe-off. Increases in joint angle values indicate plantar flexion and knee and hip extension. The points A1, A2 and K1 etc. represent the various peak values used in the statistical analyses. Asterisks indicate statistically significant difference in peak joint angles before and after surgical intervention.
Joint moments
The averaged joint moment curves are shown in . The only statistically significant difference was seen for the hip joint (Table). The peak hip extensor moment (H1) decreased after surgery. Preoperatively, the maximal extensor dominance was –58 Nm ± 13, and it was –47 Nm (11) postoperatively (p = 0.04). The shift from extensor dominance to flexor dominance in the hip joint occurred after 51% of the stance phase preoperatively. Postoperatively, the shift occurred after 48% of the stance phase (p = 0.8).
Figure 2. Averaged ankle, knee and hip joint moments for the postoperative gait analysis (solid line) and preoperative gait analysis (dashed line). Zero on the x-axis indicates heel strike and 100 toe-off. Positive joint moment values indicate dorsiflexor dominance for the ankle joint, extensor dominance for the knee joint and flexor dominance for the hip joint. The points A1, A2 and K1 etc. represent the various peak values used in the statistical analyses. Asterisk indicates statistically significant difference in peak joint angles before and after surgical intervention.
Peak values of joint angles and joint moments in the pre- and postoperative gait analysis
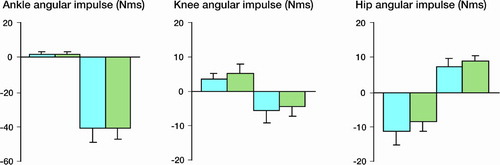
The angular impulses of the joint moments are shown in . There were no differences in total flexor and extensor moments for all 3 joints.
Figure 3. Angular impulse values for the preoperative gait analysis (blue bars) and postoperative gait analysis (green bars).Values are means ± CI.Positive values indicate the total amount of dorsiflexor dominance in the ankle, extensor dominance in the knee and flexor dominance in the hip.Negative values indicate the total amount of plantar flexor dominance in the ankle, flexor dominance in the knee and extensor dominance in the hip.
Discussion
We found significant postoperative kinematic changes in the walking pattern in subjects with hip dysplasia. The subjects walked with a more extended knee joint after surgery.
Patients with hip pathology may adapt to a certain gait pattern, consisting of reduced dynamic range of motion and joint moments (Romano et al. Citation1996, Hurwitz et al. Citation1997, Lai et al. Citation1997, Pedersen et al. Citation2004). Our earlier preoperative study showed that the subjects walked with an increased flexion in the knee joint during the entire stance phase compared to a control group (Pedersen et al. Citation2004). Similar findings were described by Romano et al. (Citation1996), who concluded that subjects with residua of congenital dysplasia of the hip walked with a precocious and progressive reduction of extension during the stance phase. Lai et al. (Citation1997) showed that subjects with congenital dislocation of the hip walked with a smaller maximum flexion angle of the hip joint. These gait adaptations are seen as pain-avoidance mechanisms to reduce forces on the pathological hip joint. We found that postoperatively, the subjects walked with an increased extension in the knee joint during the entire stance phase, indicating a more upright walking pattern. When an increase in extension is seen, a decrease in joint moments might be expected because of the reduced external lever arm. However, this was not the case in our study. In the earlier preoperative study, we found both a delayed and reduced hip flexor moment in the second half of the stance phase (Pedersen et al. Citation2004). In the present study, we did not find any changes in the second half of the stance phase compared to the preoperative findings. This means that the subjects maintain a reduction in the flexor moment and that the gait is not completely normalized 1 year after the operation.
In conclusion, we found that subjects treated for hip dysplasia achieved a more upright walking pattern. This may indicate a reduction in the pain that the subjects experienced before surgery. However, the subjects still relieved their hip joint by maintaining a reduction in the flexor moment, as before surgery. It is possible that a longer period of intensive rehabilitation is required in order to change the hip joint moment pattern.
This study was supported by the Danish Rheumatism Association.
Author contributions
All authors have contributed to the planning, interpretation and revision of the manuscript. ENGP has collected data.
Related Research Data
- Crockarell J, Jr., Trousdale R T, Cabanela M E, Berry D J. Early experience and results with the periacetabular osteotomy. The Mayo Clinic experience. Clin Orthop 1999, 363: 45–53
- Dutoit M, Zambelli P Y. Simplified 3D-evaluation of periacetabular osteotomy. Acta Orthop Belg 1999; 65(3)288–94
- Ganz R, Klaue K, Vinh T S, Mast J W. A new periacetabular osteotomy for the treatment of hip dysplasias. Technique and preliminary results. Clin Orthop 1988, 418: 26–36
- Hadley N A, Brown T D, Weinstein S L. The effects of contact pressure elevations and aseptic necrosis on the longterm outcome of congenital hip dislocation. J Orthop Res 1990; 8: 504–13
- Hickman J M, Peters C L. Hip pain in the young adult: diagnosis and treatment of disorders of the acetabular labrum and acetabular dysplasia. Am J Orthop 2001; 30: 459–67
- Hsieh P H, Shih C H, Lee P C, Yang W E, Lee Z L. A modified periacetabular osteotomy with use of the transtrochanteric exposure. J Bone Joint Surg (Am) 2003; 85: 244–50
- Hurwitz D E, Hulet C H, Andriacchi T P, Rosenberg A G, Galante J O. Gait compensations in patients with osteoarthritis of the hip and their relationship to pain and passive hip motion. J Orthop Res 1997; 15: 29–635
- Lai K A, Lin C J, Su F C. Gait analysis of adult patients with complete congenital dislocation of the hip. J Formos Med Assoc 1997; 96: 740–4
- Leunig M, Siebenrock K A, Ganz R. Rationale of periacetabular osteotomy and background work. Instr Course Lect 2001; 50: 229–38
- Matta J M, Stover M D, Siebenrock K. Periacetabular osteotomy through the Smith-Petersen approach. Clin Orthop 1999, 363: 21–32
- Murphy S B, Kijewski P K, Millis M B, Harless A. Acetabular dysplasia in the adolescent and young adult. Clin Orthop 1990, 261: 214–23
- Pedersen E N, Simonsen E B, Alkjaer T, Soballe K. Walking pattern in adults with congenital hip dysplasia: 14 women examined by inverse dynamics. Acta Orthop Scand 2004; 75: 2–9
- Romano C L, Frigo C, Randelli G, Pedotti A. Analysis of the gait of adults who had residua of congenital dysplasia of the hip. J Bone Joint Surg (Am) 1996; 78: 1468–79
- Siebenrock K A, Scholl E, Lottenbach M, Ganz R. Bernese periacetabular osteotomy. Clin Orthop 1999, 363: 9–20
- Siebenrock K A, Schoeniger R, Ganz R. Anterior femoroacetabular impingement due to acetabular retroversion. Treatment with periacetabular osteotomy. J Bone Joint Surg (Am) 2003; 85: 278–86
- Soeballe K. Pelvic osteotomy for acetabular dysplasia. Acta Orthop Scand 2003; 74: 117–8
- Trousdale R T, Ekkernkamp A, Ganz R, Wallrichs S L. Periacetabular and intertrochanteric osteotomy for the treatment of osteoarthrosis in dysplastic hips. J Bone Joint Surg (Am) 1995; 77: 73–85
- Trumble S J, Mayo K A, Mast J W. The periacetabular osteotomy. Minimum 2 year followup in more than 100 hips. Clin Orthop 1999, 363: 54–63
- Tönnis D. Clinical and radiographic schemes for evaluating therapeutic results. Congenital dysplasia and dislocation of the hip. Springer-Verlag, Berlin Heidelberg 1984; 165–71
- van Bergayk A B, Garbuz D S. Quality of life and sportsspecific outcomes after Bernese periacetabular osteotomy. J Bone Joint Surg (Br) 2002; 84: 339–43
- Vaughan C L, Davis B L, O'Connor J C. Dynamics of human gait. Human Kinetics Publishers, Champaign, Illinois 1992
- Yasunaga Y, Takahashi K, Ochi M, Ikuta Y, Hisatome T, Nakashiro J, Yamamoto S. Rotational acetabular osteotomy in patients forty-six years of age or older: comparison with younger patients. J Bone Joint Surg (Am) 2003; 85: 266–72