Abstract
Background Angiogenesis, the process of new vessel formation from a pre-existing vascular network, is essential for bone development and repair. New vessel formation and microvascular functions are crucial during bone repair, not only for sufficient nutrient supply, transport of macromolecules and invading cells, but also because they govern the metabolic microenvironment. Despite its central role, very little is known about the initial processes of vessel formation and microvascular function during bone repair.
Methods To visualize and quantify the process of vessel formation and microvascular function during bone repair, we transplanted neonatal femora with a substantial defect into dorsal skin-fold chambers in severe combined immunodeficient (SCID) mice for continuous noninvasive in-vivo evaluation. We employed intravital microscopic techniques to monitor effective microvascular permeability, functional vascular density, blood flow rate and leukocyte flux repeatedly over 16 days. Oxytetracyclin and v. Kossa/v. Giesson staining was performed to quantify the calcification process in vivo and in vitro.
Results Development of a hematoma surrounding the defect area was the initial event, which was accompanied by a significant increase in microvascular permeability and blood flow rate. With absorption of the hematoma and vessel maturation, permeability decreased continuously, while vascular density and tissue perfusion increased. Histological evaluation revealed that the remodeling of the substantial defect prolonged the in-vivo monitored calcification process.
Interpretation The size of the initial substantial defect correlated positively with increased permeability, suggesting improved release of permeability-inducing cytokines. The unchanged permeability in the control group with boiled bones and a substantial defect corroborated these findings. The adaptation to increasing metabolic demands was initially mediated by increased blood flow rate, later with increasing vascular density through increased tissue perfusion rate. These insights into the sequence of microvascular alterations may assist in the development of targeted drug delivery therapies and caution against the use of permeability-altering drugs during bone healing.
The process of osteogenesis is determined by the sequential interaction of osteoclasts, osteoblasts and angiogenesis (Probst and Spiegel Citation1997, Glowacki Citation1998, Gerber et al. Citation1999). The recruitment process, and also the activation of osteoclasts, osteoblasts and their precursor cells, depends on properties of the microcirculation, which are also involved in the regulation of the metabolic microenvironment (Helmlinger et al. Citation1997, Algenstaedt et al. Citation2003). This involves the expression and activation of various genes involved in the regulation of bone repair. Thus, microcirculatory properties may play an essential role during osteogenesis (Leunig et al. Citation1994).
Damaged bone integrity leads to interruption of the microcirculation, which can lead to necrosis and hypoxia of the surrounding areas of bone (Wang Citation1996, Glowacki, Citation1998). Reconstruction of the circulation is one of the earliest events during bone repair (Wang Citation1996, Glowacki, Citation1998). The establishment of a functionally intact vascular network appears not only to precede the event of bone formation, but also to have a substantial influence on the result (Wallace et al. Citation1991, Citation1995).
Angiogenesis, the process of new vessel formation, is characterized by a specific sequence of events. Increased vascular permeability leads to higher exudation of plasma, one of the initial and essential parts of angiogenesis, and the subsequent formation of osteogenic matrix (Probst and Spiegel Citation1997, Glowacki Citation1998, Carmeliet and Jain Citation2000). Proliferation and migration of endothelial cells is followed by tube formation and perfusion of newly formed vessels. Further vessel maturation with adjacent pericytes and smooth muscle cells alters microcirculatory properties such as permeability (Allt and Lawrenson Citation2001). After vascularization, osteoblastic cells proliferate and with the production of an osteogenic matrix, new bone formation can begin (Probst and Spiegel Citation1997, Gerber et al. Citation1999). The morphological vascular changes during bone formation must be accompanied, or preceded, by physiological adjustments of the microcirculation (Rhinelander Citation1968).
Increased metabolic demands during bone repair require an increased blood flow rate (BFR) and an increase in functional vascular density (VD) (Rhee et al. Citation1996). After the systemic delivery process via blood flow, cells and substrates must extravasate to reach their address, the interstitial matrix/cells. Extravasation of cells is governed by mechanical and functional properties such as shear rate, microvascular permeability and cell-cell interactions (e.g. leukocyte-endothelial interactions) mediated by adhesion molecules (Fukumura et al. Citation1997b, Algenstaedt et al. Citation2003). These functional parameters must be adapted to local requirements, not only temporally but also spatially, and might therefore differ between each single step of bone repair. At the same time, vascular conditions may be useful for targeted drug delivery (Arap et al. Citation1998, Ruoslahti Citation2002), e.g. increased permeability due to increased vascular pore size might be useful for adjuvant therapies using macromolecules or liposomes (Monsky et al. Citation1999).
Despite the importance of angiogenesis and the structural and functional properties of the microcirculation during osteogenesis, very little is known about their sequential alterations during bone repair. The dorsal skin-fold chamber is a technique, initially used in hamsters (Endrich et al. Citation1980), that allows a long-term observation of these parameters in vivo at high spatial resolution. It has been used routinely, for example, to monitor the microcirculation in bone transplantation studies (Leunig et al. Citation1999), during tumor growth (Hansen-Algenstaedt et al. Citation2000) and under pathological metabolic conditions (Algenstaedt et al. Citation2003). The aim of this study was to monitor adjustments of microcirculation following damage to bone integrity. We hypothesized that functional alterations would have to occur immediately after the bone damage to maintain the survival of bone tissue, while morphological adjustments of the microcirculation are necessary to ensure tissue regeneration. While functional properties also govern drug delivery, an improved understanding of their sequential alterations during bone repair would not only help us to understand failure in repair mechanisms, but might also help in the development and evaluation of new therapies that exploit such functional characteristics as therapeutic targets.
Material and methods
We implanted dorsal skin-fold chambers in 3-month-old male severe combined immunodeficient (SCID) mice (n = 37, untreated n = 20, inactivated control n = 17) with an average weight of 29 ± 3 g, as described in greater detail elsewhere (Leunig et al. Citation1994, Hansen-Algenstaedt et al. Citation2000). Briefly, prior to surgical procedures mice were anesthetized (7.5 mg ketamine hydrochloride and 2.5 mg xylazine per 100 g of body weight) and the skin was shaved and depilated. Dorsal skin-fold chambers (weight 3.2 g) (Machine Shop, Boston, MA) were implanted, exposing subcutaneous tissue and striated skin muscle. All surgical procedures were performed under aseptic conditions while maintaining body temperature at physiological levels using a heating pad. SCID mice from our gnotobiotic colony were used to avoid lymphocyte and natural killer cell mediated rejection of the transplant. Leukocyte flux was measured throughout the observation period to ensure the absence of inflammatory processes. Following a recovery period of 48 h, all chambers met the criteria of intact microcirculation (Sewell Citation1966) and were utilized as sites for bone implantation. The periost of allogenic neonatal SCID mouse femora were mechanically stripped prior to implantation into the dorsal skin-fold chamber. Immediately before implantation, a cortical and medullary defect in the diaphysis was created with a scalpel. As a control, we boiled the femora for 3.5 min prior to implantation in order to inactivate cytokines released via the bone defect, as described in detail elsewere (Leunig et al. Citation1996). All animal procedures were performed according to the directions of the German Animal Welfare Committee.
We employed epifluorescence techniques to monitor effective microvascular permeability, vascular density, blood flow velocity, leukocyte flux, blood flow rate and calcification of the bone defect repeatedly on days 4, 8, 12 and 16 after implantation of femora. To obtain parameters relating to microcirculation, selected areas (2–3 locations next to the bone defect) were investigated using an intravital fluorescence microscope (Axioplan; Zeiss, Oberkochen, Germany). The microscope was equipped with fluorescence filter sets for fluorescein isothiocyanate (FITC) and tetramethyl rhodamine (TRITC), for oxytetracyclin (OTC), a 20× objective lens (LD Achroplan 20×/0.40; Zeiss), an intensified charge-coupled device (CCD) video camera (C2400-97; Hamamatsu Photonics GmbH, Germany), a Photomultiplier Tube (R4632; Hamamatsu Photonics) and a computer for digital signal recording and offline analysis. During measurements, body temperature was maintained at physiological levels using an electric heating pad.
Functional vascular density (VD), blood flow velocity (VRBC), and blood flow rate (BFR)
100 μL of FITC-labeled dextran (MW 2,000,000; 50 mg/mL in 0.9% saline; Sigma, St. Louis, MO) was injected through the tail vein to visualize functional blood vessels. During each observation period, FITC images were recorded for 30 sec and analysed offline. The red blood cell velocity (VRBC) was measured opto-electronically using a two-slit method and an image processing system (Exbem 3.0; Pixlock e.K., Münster, Germany) as described elsewhere (Lipowsky and Zweifach Citation1978). The mean BFR of individual vessels (Q) was calculated using diameter (D) and the mean VRBC (Vmean). Q = π / 4 × V× D2, where mean V= VRBC / a (and a = 1.3 for blood vessels < mean 10 μm; linear extrapolation 1.3 < a < 1.6 for blood vessels < 10 μm and < 15 μm; and a = 1.6 for blood vessels < 15 μm) (Lipowsky and Zweifach Citation1978). The vessel density ( I–L), defined as the total length of vessels per unit area (cm/cm2) was analyzed using an image-processing system (NIH Image 1.62), as described in greater detail elsewhere (Algenstaedt et al. 2000, Citation2003).
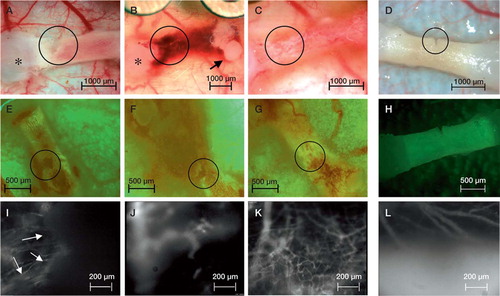
Figure 1. A–D: Epi-illumination showing the sequence of the femoral implant initially after implantation (A) with the diaphyseal medullary and cortical defect, and four days after implantation (B) with the characteristic hematoma. From day 12 (not shown) to day 16 (C) the hematoma was entirely reabsorbed, the femora became completely vascularized and the defect was completely filled up. Circles mark the area with the defect and the region of interest where microcirculatory parameters were measured. Condyles (*) and femoral head (arrow) are marked. Note that not only did the defect area become vascularized, but also the entire femur. The control inactivated femoral implant neither developed a hematoma nor became vascularized until day 16 (D). E–H: Epifluorescence sequence after injection of oxytetracyclin for intravital evaluation of calcified structures. Even with the massive hematoma at day 4 (F), quantification of the calcification process was achievable. Longitudinal follow-up from day 0 (E) and day 16 (G) not only demonstrate the bone repair with continuous calcification, but also the elongation of the femora. In contrast, the control group with inactivated femora showed no calcification of the defect until day 16 (H). I–L: Functional vascular density, VRBC, BFR and architecture of microvessels were analyzed after i.v. injection of FITC-dextran, marking vessels white. The vascular density in the defect area, marked with arrows on day 0 (I), increased significantly from day 4 (J) to day 16 (K), covering the former defect area with an intense vascular network. On day 4, a new vessel invading the defect area can be identified (J). In contrast, the control group with inactivated femora showed no increase in VD until day 16 (L).
Tissue perfusion rate (TPR)
Blood volume (mL) perfusing the area (cm2) during a defined period (sec) was determined as tissue perfusion rate (mL/cm2sec) (Algenstaedt et al. Citation2003). To calculate tissue perfusion rate (TPR), we measured vascular density, blood flow rate and surface area. The equation for calculation of TPR is as follows:
where G is the count of observation the observed surface area, the number of vessels counted in the observed area, and α is a parameter for calculation of the ratio between RBC and plasma.
Leukocyte-endothelial interaction (LEI)
Leukocyte-endothelial cell interactions in vessels were monitored as described previously (Fukumura et al. Citation1995). Briefly, mice were injected with a bolus (20 μL) of 0.1% rhodamine-6G in 0.9% saline through the tail vein and leukocytes were visualized via an intensified CCD camera and recorded uncompressed digitally on a computer (Apple Power MacIntosh G4, Dual 500 MHz Power PC, 1GB SDRAM). The numbers of rolling (Nr) and adherent (Na) leukocytes were counted for 30 sec along a 100-μm segment of a vessel. The total flux of cells was also measured for 30 sec (Nt). The equations for calculation of the ratio of rolling cells to total flux (rolling count), the density of adhering leukocytes (adhesion density), and the shear rate for each vessel are as follows: rolling count (%) = 100 × Nr / Nt, adhesion density (cells/mm2) = 106× Na / (π × D × 100 μm), and shear rate = 8 × Vmean/ D (Zhao et al. Citation1995).
Vascular permeability (P)
Effective microvascular permeability (P) was measured as described previously (Yuan et al. Citation1993, 1994, Fukumura et al. Citation1997a). Briefly, after the injection of TRITC-labeled bovine serum albumin (TRITC-BSA), MW 67,000, excitation wavelength 525–555 nm, emission wavelength 580–635 nm (Molecular Probes, Eugene, OR) (10 mg/mL, 0.1 mL/25 g body weight), the fluorescence intensity was measured intermittently for 25 min and recorded digitally (PowerLab 200; ADInstruments Pty Ltd., NSW, Australia). The value of P was calculated as P = (1 – HT) V/S {1/(I0 – Ib) * dI/dt + 1/K}, where I is the average fluorescence intensity of the whole image, I0 is the value of I immediately after the filling of all vessels by TRITC-BSA, and Ib is the background fluorescence intensity. The average hematocrit (HT) of vessels is assumed to be equal to 19% (Brizel et al. Citation1993). V and S are the total volume and surface area of vessels within the tissue volume covered by the surface image, respectively. The time constant of BSA plasma clearance (K) is 1.1 x 10⁴sec (Yuan et al. Citation1993).
Quantification of bone formation
To differentiate between the contribution of cartilage and bone in the defect area, oxytetracyclin (OTC) was injected intraperitoneally for in-vivo labeling of calcified tissue 6 h prior to investigation (100 mg per kg body weight). Additionally, we performed v. Kossa / v. Giesson staining to quantify the calcification process in the area of the defect after explantation of the femora. OTC is known to localize and persist specifically in calcified structures (Milch et al. Citation1958, Finerman and Milch Citation1963). Fluorescence excitation was by epiillumination using an excitation filter (356–418 nm), a dichroic mirror (450 nm) and a barrier filter (495 nm), and recorded digitally by a color digital camera (Axiocam; Zeiss, Germany). The area of the defect was correlated to the maximum defect zone on day 0 of implantation. Analysis was performed offline using a public image processing system (NIH Image version 1.62).
Histology
After termination of the in-vivo experiments, the femora were explanted. The grafts were excised, fixed in formaldehyde, dehydrated in alcohol, embedded in paraffin wax and cut serially at 5 μm thickness. The sections were stained with hematoxylin and eosin (H & E) as well as with v. Giesson and v. Kossa. H & E staining was performed to stain chondrocytes blue and (in contrast) calcified structures red and collagen pink. V. Giesson and v. Kossa staining was specifically used to visualize calcified structures (black) and collagen structures (red), as well as chondrocytes (pink) (Weiss Citation1983).
Statistics
Results are presented as mean (SEM). Statistical analysis for pairwise comparisons was performed with StatView (Abacus, Berkely, CA) using Wilcoxon signed rank test for paired non-parametric samples and Mann-Whitney U test for unpaired non-parametric samples. Statistical significance was based on p-values < 0.05. Correlation analysis was performed with Statistica version 6 (StatSoft Inc. (2001)) using a linear regression model. Correlations were considered significant for r < 0.5.
Results
Implantation of the femora was accompanied by hematoma, surrounding the area of the newly created cortical and medullary defect (). The hematoma peaked 4 days after implantation, and was continuously reabsorbed thereafter and not detectable 12 days after implantation. Fluorescence microscopy revealed a significant increase in permeability simultaneous with the development of the hematoma 4 days after implantation. Microvascular permeability (P) decreased continuously from day 4 to day 12 with an almost normal value at day 16 compared to the controls ( and Table). Note that the initial increase in P after femur implantation correlated positively with the initial size of the defect area (R = 0.89) (). Implantation of the inactivated control femora neither produced a hematoma () nor affected permeability significantly throughout the entire observation period ().
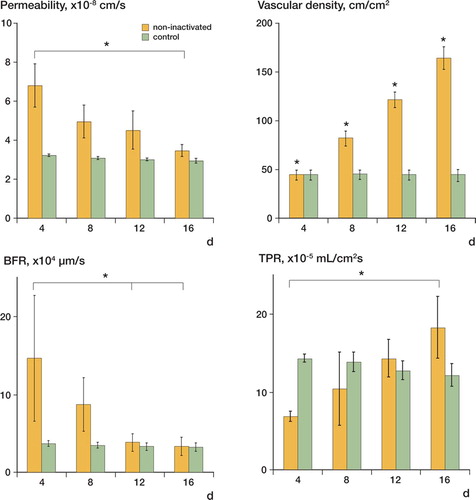
Figure 2. While permeability (A) decreased significantly from day 4 to day 16, vascular density (B) increased. Note the constantly low permeability and constant vascular density of the control. Although the decrease in blood flow rate (BFR) (C) was not significant between individual observation days, it decreased significantly from day 4 to day 16. The tissue perfusion rate (TPR) (D) increased significantly from day 4 to day 16. The control group was characterized by a constant TPR with higher values during the initial observation period. Since the control group developed no hematoma covering the vessels in the subcutaneous tissue, the microcirculatory parameters of the control group represent the characteristics of the established vasculature.
Functional vascular density (VD) increased significantly in the region of interest in the area of the defect from day 4 to day 16 (, and Table). Note that the complete femora became vascularized, not only the defect area. In contrast, in the control group VD remained constant at its initial level (Table).
Using high molecular weight FITC-dextran as plasma marker, we found a trend (p = 0.1) toward decreased VRBCfrom day 4 to day 16, while VRBCof the control group was characterized by constant values (Table).
Blood flow rate (BFR) decreased almost significantly (p = 0.06) from day 4 to day 16 ( and Table), while BFR in the control group was characterized by constant values ( and Table). BFR in the group with the non-inactivated bony defect was significantly elevated on days 4 and 8, whereas there was no statistically significant difference in BFR between the two groups on days 12 and 16.
Although the increase in tissue perfusion rate (TPR) in the non-inactivated bony defect ( and Table) was not statistically significant, we found a trend (p = 0.1) toward increasing values from day 4 to day 16, while TPR in the control group remained at a constant level ( and Table). TPR on day 4 was significantly higher in the control group than in the non-inactivated group.
Functional and morphological results for the microvasculature, mean (SEM)
By leukocyte labeling with Rhodamine-6-G, we could not identify any significant increase in the bony defect group—either in leukocyte flux or in rolling count during the entire observation period ( and Table). Rolling count in the control group also remained at a constant level, with values that were comparable to those of the bony defect group ( and Table).
Figure 3. The dynamic process of recalcification after the substantial defect was monitored in vivo using epifluorescence techniques with oxytetracyclin. The initial defect is defined as 100%, and recalcification is plotted relative to the initial defect. While the control group showed no recalcification, the substantial defect in the non-inactivated group was almost completely filled on day 16 (A). The size of the defect correlated positively with the induced permeability (r = 0.89) (B). In contrast to the control group, we observed a significant elongation of the non-inactivated femora from day 4 to day 16 (C). Rolling count of leukocytes as parameter of inflammation-related activation of the endothelial surface remained constant in both the control group and the non-inactivated femoral implant (D).
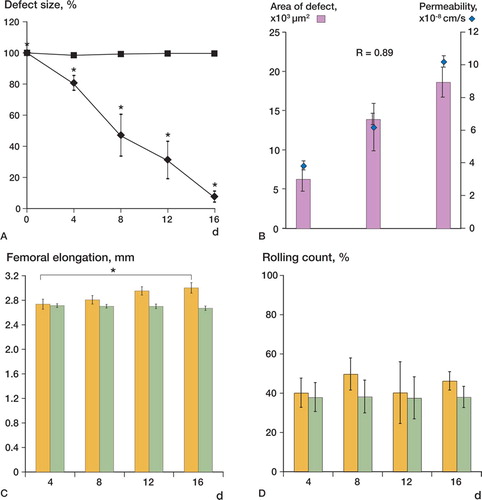
In-vivo labeling of calcified structures with OTC revealed an almost complete recalcification of the initial defect area 16 days after implantation (). The recalcification process was characterized by a significant reduction of the defect area to 81% (5%) compared to the initial 100% defect area on day 4, followed by reduction to 44% (12%) on day 8, and 31% (13%) on day 12, and after 16 days the remaining defect area was reduced to 7.3% (3.8%) (). During the observation period, we also found a femoral elongation. Relative to day 4 (the first observation day using OTC), calcified femoral length increased significantly ( and Table). We did not observe a significant increase in in-vivo calcification of the substantial defect nor a significant femoral elongation in the control group (, and , and Table).
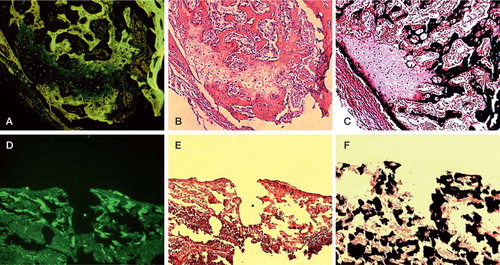
Although the labeling of calcified structures with OTC revealed almost complete recalcification (), histological examination indicated that the former substantial defect area was still under a repair process—in such a way that chondral ossification processes could be observed. In the former substantial defect zone, v. Kossa and v. Giesson stained columns of formed chondrocytes pink, indicating an ongoing chondral ossification. Chondrocytes were covered with a subtle layer of black-stained calcified structures (). H & E staining confirmed bone-remodeling areas of cartilage (blue), chondral ossification (pink) and calcified structures (red) next to each other (). However, the bone appeared to be viable with both stains, with normal cellularity in the myeloid cavity. The control group was characterized by the absence of any repair mechanism. Consequently, the defect area was defined by a gap without any cellular reaction ().
Figure 4. Evaluation of the calcification status was performed using oxytetracyclin staining (A, D), and v. Kossa/v. Giesson staining (C, F). Calcified structures appear green using oxytetracyclin and black using v. Kossa/v. Giesson staining, respectively. Note that the former substantial defect is covered with a subtle calcified layer in the non-inactivated group (A, C), whereas the control group shows no calcification process (D, F). H & E staining (B, E) was performed to evaluate bone-remodeling areas with cartilage (blue), chondrol ossification (pink) and calcified structures (red). While the control group was characterized by the absence of any repair mechanisms (E), the non-inactivated group showed viable bone with normal cellularity in the myeloid cavity and chondrol ossification in the former substantial defect area (B). Bar represents 300 μm.
Discussion
We report here the functional and morphological dynamics of the multifaceted process of angiogenesis, and microcirculatory parameters during the bone repair process involving transplanted femora. The fluorescence microscopy technique, using a dorsal skin-fold chamber preparation, allows repetitive noninvasive monitoring of morphological and functional alterations. It therefore permits insights into the dynamics of functional vascular properties and their morphological correlate of microcirculation in vivo. Simultaneously with the development of a hematoma, increased permeability was the first detectable functional alteration, while structural adaptations such as increased vascular density lagged behind. Consequently, the demands on increased blood supply were initially fulfilled via an increased blood flow rate, mediated by velocity and diameter adaptations. With increasing vascular density, tissue perfusion rate improved and the acutely stimulated BFR in the single vessels decreased. A control group with inactivated femora was used to exclude the possibility of a purely mechanically altered microcirculation. In the control group, we found neither functional nor structural vascular adaptations. Also, the recalcification of the defect and a femoral elongation, as observed in the non-inactivated group, did not occur in the control group.
Microcirculatory properties govern not only the efficacy of substrate delivery but also the metabolic microenvironment, which is in turn essential for regulation of gene expression (Shweiki et al. Citation1992, Mukhopadhyay et al. Citation1995, Mazure et al. Citation1996, Xu et al. Citation2002). The dynamics of alteration of the microcirculation after destruction of bone integrity are essential for angiogenesis and osteogenesis (Rhinelander Citation1968, Glowacki Citation1998, Gerber et al. Citation1999). Here, we could demonstrate the sequential alteration in microcirculatory properties after producing a bone defect. Increased microvascular permeability (P) is the initial and essential step in angiogenesis (Carmeliet and Jain Citation2000). The expression of permeability-inducing cytokines such as Vascular Endothelial Growth Factor (VEGF) is elevated not only in the bone, but also in the surrounding soft tissues during bone repair (Hansen- Algenstaedt et al. Citation2003). Consequently, the microvascular parameter to be altered first after destruction of bone integrity was a significant increase in P. Because the increase in vascular density (VD) lags behind the initial increase in P, the latter represents the alteration of the established pre-existing vasculature. Since VD increased significantly thereafter, and the newly formed vessels dominated the region of bone repair, the permeability from day 8 to day 16 represented the permeability of newly formed vessels. The decrease in P might be the result of reduced concentrations of angiogenic cytokines through absorption of the hematoma, but it also mirrors of newly formed vessels of the maturation processes of newly formed vessels. The possibility of a mechanical stress-induced plasma leakage is unlikely, since former experiments with metal implants (data not shown) and the control group neither caused increased permeability nor created hemorrhage. The increased permeability (causing plasma leakage) is the result of increased pore size, which can also be used for targeted drug delivery (Monsky et al. Citation1999). Adjuvant therapies relying on the delivery of macromolecules or liposomes might be designed in such a way that they extravasate predominantly at vascular locations with increased pore size (Arap et al. Citation1998).
Newly formed vessels were characterized by having smaller diameters with higher VRBC, an effect that is in accordance with Hagen-Poiseuille's law. However, to compare the possible effect of increased metabolic demands during bone repair on VRBC, vessels with comparable diameters were evaluated. VRBC in such comparable vessels was not changed significantly, yet we recognized a trend toward reduced VRBC between day 4 and day 16. Although BFR takes the diameter of the vessel into account, it does not consider alterations in vessel density and therefore does not reflect morphological adjustments as they have been reported as a response to bone defects (Rhinelander Citation1968). The initial increase in BFR at day 4 might represent the acute stimulation of the established vasculature, while the trend toward decreased BFR from day 4 to day 16 might be the result of the morphological adjustment via increased VD, and consequently increased TPR. The lower TPR on day 4 than in the control group was the result of smaller vessels that started to invade the hematoma. Since in the control group no hemorrhage occurs the vessels of the subcutaneous tissue, TPR appears unchanged.
Predictably, there was a positive correlation between the size of the initial defect and the extent of the remaining uncalcified defect on day 16 (r = 0.9). Although the dimension of the initial defect correlated positively with the effective permeability of the microvasculature, it did not correlate with the increase in VD, nor with alterations in other microvascular parameters. A significant effect of microcirculatory parameters on femoral elongation was not observed, and the elongation itself is a known phenomenon (Leunig et al. Citation1994). In our study, there was no correlation between femoral elongation and increase in VD, yet it must be taken into account that our vascular analysis focused on the defect area.
Although in-vivo analysis of the calcification process during bone repair suggested a complete calcification around day 16, histology revealed that enchondral ossification was still taking place and that a complete regeneration was not reached until day 16. The lack of complete regeneration might be due to a prolonged ossification process, but also because of the missing mechanical loading (Simpson et al. Citation1996, Sato et al. Citation1999, Weiss et al. Citation2002).
The sequential alterations, first of the pre-existing established vasculature, and later of the newly formed vessels, identify properties of the microcirculation as being a dynamic target. Thus, the efficiency of adjuvant therapies modulating bone repair mechanisms will depend not only on their intrinsic efficiency but also on the time such therapies are initiated. Therapies dependent on the delivery of macromolecules will be more efficient at the beginning when vessel pore size is increased, while therapies that depend on high tissue perfusion rates would be more effective at later stages. To thoroughly evaluate which cytokines are involved in mediating permeability during bone repair, studies concentrating on mechanisms rather than structural and functional analysis of the microcirculation during bone repair will have to be performed.
This work was supported by a research grant from the Werner Otto Foundation to NH-A, PA, NH-A, CJ, LW and CS were members of the DFG Graduate College [GRK476], as were P.A. and A.B. [GRK336]. We thank M. Ammelt for help with the movie analysis, B. Schwarzloh for outstanding technical support, and Nancy Morkel for help with the manuscript.
No competing interests declared.
Contributions of authors
NH-G study design and overall control, manuscript. CJ and LW equally performed the skinfold chamber and femur implantation as well as documentation of microvascular parameters. CS developed the algorithm for the analysis of the microvascular parameters. IM and AB histological examination and second control group. GD and LW statistical analysis and analysis of microvascular parameters. ML femur growth analysis and evaluation of histological and microvascular functional and structural parameters. PA manuscript, histological preparation and mice preparation. WR scientific evaluation, manuscript and structural support.
Related Research Data
- Algenstaedt P, Schaefer C, Biermann T, Hamann A, Schwarzloh B, Greten H, Ruther W, Hansen-Algenstaedt N. Microvascular alterations in diabetic mice Correlate With Level of Hyperglycemia. Diabetes 2003; 52: 542–9
- Allt G, Lawrenson J G. Pericytes: cell biology and pathology. Cells Tissues Organs 2001; 169: 1–11
- Arap W, Pasqualini R, Ruoslahti E. Cancer treatment by targeted drug delivery to tumor vasculature in a mouse model. Science 1998; 279: 377–80
- Brizel D M, Klitzman B, Cook J M, Edwards J, Rosner G, Dewhirst M W. Acomparison of tumor and normal tissue microvascular hematocrits and red cell fluxes in a rat window chamber model. Int J Radiat Oncol Biol Phys 1993; 25: 269–76
- Carmeliet P, Jain R K. Angiogenesis in cancer and other diseases. Nature 2000; 407: 249–57
- Endrich B, Asaishi K, Gotz A, et al. Technical report-a new chamber technique for microvascular studies in unanesthetized hamsters. Res Exp Med (Berl) 1980; 177(2)125–34
- Finerman G A. M, Milch R A. In vitro binding of tetracyclines to calcium. Nature (London) 1963; 198: 486–7
- Fukumura D, Salehi H A, Witwer B, Tuma R F, Melder R J, Jain R K. Tumor necrosis factor alpha-induced leukocyte adhesion in normal and tumor vessels: effect of tumor type, transplantation site, and host strain. Cancer Res 1995; 55: 4824–9
- Fukumura D, Yuan F, Endo M, Jain R K. Role of nitric oxide in tumor microcirculation. Blood flow, vascular permeability, and leukocyte-endothelial interactions. Am J Pathol 1997a; 150: 713–25
- Fukumura D, Yuan F, Monsky W L, Chen Y, Jain R K. Effect of host microenvironment on the microcirculation of human colon adenocarcinoma. Am J Pathol 1997b; 151: 679–88
- Gerber H P, Vu T H, Ryan A M, Kowalski J, Werb Z, Ferrara N. VEGFcouples hypertrophic cartilage remodeling, ossification and angiogenesis during endochondral bone formation. Nat Med 1999; 5: 623–8
- Glowacki J. Angiogenesis in fracture repair. Clin Orthop 1998; S82–9
- Hansen-Algenstaedt N, Stoll B R, Padera T P, Dolmans D E, Hicklin D J, Fukumura D, Jain R K. Tumor oxygenation in hormone-dependent tumors during vascular endothelial growth factor receptor-2 blockade, hormone ablation, and chemotherapy. Cancer Res 2000; 60: 4556–60
- Hansen-Algenstaedt N, Algenstaedt P, Bottcher A, Joscheck C, Schwarzloh B, Schaefer C, Muller I, Koike C, Ruther W, Fink B. Bilaterally increased VEGF-levels in muscles during experimental unilateral callus distraction. J Orthop Res 2003; 21: 805–12
- Helmlinger G, Yuan F, Dellian M, Jain R K. Interstitial pH and pO2 gradients in solid tumors in vivo: high-resolution measurements reveal a lack of correlation. Nature Medicine 1997; 3: 177–82
- Jain R K. The Eugene M. Landis Award Lecture 1996. Microcirculation 1997; 4: 1–23, Delivery of molecular and cellular
- Leunig M, Yuan F, Berk D A, Gerweck L E, Jain R K. Angiogenesis and growth of isografted bone: quantitative in vivo assay in nude mice. Lab Invest 1994; 71: 300–7
- Leunig M, Yuan F, Berk D A, Gerweck L E, Jain R K. Heating or freezing bone. Effects on angiogenesis induction and growth potential in mice. Acta Orthop Scand 1996; 67: 383–8
- Leunig M, Demhartner T J, Sckell A, et al. Quantitative assessment of angiogenesis and osteogenesis after transplantation of bone: comparison of isograft and allograft bone in mice. Acta Orthop Scand 1999; 70(4)374–80
- Lipowsky H H, Zweifach B W. Applications of the “two-slit” photometric technique to the measurement of microvascular volumetric flow rates. Microvasc Res 1978; 15: 93–101
- Mazure N M, Chen E Y, Yeh P, Laderoute K R, Giaccia A J. Oncogenic transformation and hypoxia synergistically act to modulate vascular endothelial growth factor expression. Cancer Res 1996; 56: 3436–40
- Milch R A, Rall D P, Tobie J E. Fluorescence of tetracycline antibiotics in bone. J Bone Joint Surg (Am) 1958; 40: 879–910
- Monsky W L, Fukumura D, Gohongi T, Ancukiewcz M, Weich H A, Torchilin V P, Yuan F, Jain R K. Augmentation of Transvascular Transport of Macromolecules and Nanoparticles in Tumors Using Vascular Endothelial Growth Factor. Cancer Res 1999; 59: 4129–35
- Mukhopadhyay D, Tsiokas L, Zhou X M, Foster D, Brugge J S, Sukhatme V P. Hypoxic induction of human vascular endothelial growth factor expression through c-Src activation. Nature 1995; 375: 577–81
- Probst A, Spiegel H U. Cellular mechanisms of bone repair. J Invest Surg 1997; 10: 77–86
- Rhee J G, Eddy H A, Hong J J, Suntharalingam M, Vaupel P W. Divergent changes of flow through individual blood vessels upon localized heating. Int J Hyperthermia 1996; 12: 757–69
- Rhinelander F W. The normal microcirculation of diaphyseal cortex and its response to fracture. J Bone Joint Surg (Am) 1968; 50: 784–800
- Ruoslahti E. Drug targeting to specific vascular sites. Drug Discov Today 2002; 7: 1138–43
- Sato M, Ochi T, Nakase T, Hirota S, Kitamura Y, Nomura S, Yasui N. Mechanical tension-stress induces expression of bone morphogenetic protein (BMP)-2 and BMP-4, but not BMP-6, BMP-7, and GDF-5 mRNA, during distraction osteogenesis. J Bone Miner Res 1999; 14: 1084–95
- Sewell I A. Studies of the microcirculation using transparent tissue observation chambers inserted in the hamster cheek pouch. J Anat 1966; 100: 839–56
- Shweiki D, Itin A, Soffer D, Keshet E. Vascular endothelial growth factor induced by hypoxia may mediate hypoxia-initiated angiogenesis. Nature 1992; 359: 843–5
- Simpson A H, Cunningham J L, Kenwright J. The forces which develop in the tissues during leg lengthening. A clinical study. J Bone Joint Surg (Br) 1996; 78: 979–83
- Wallace A L, McLaughlin B, Weiss J B, Hughes S P. Increased endothelial cell stimulating angiogenesis factor in patients with tibial fractures. Injury 1991; 22: 375–6
- Wallace A L, Makki R, Weiss J B, Hughes S P. Measurement of serum angiogenic factor in devascularized experimental tibial fractures. J Orthop Trauma 1995; 9: 324–32
- Wang J S. Basic fibroblast growth factor for stimulation of bone formation in osteoinductive or conductive implants. Acta Orthop Scand (Suppl 269) 1996; 1–33
- Weiss L. Histology fifth ed. Elsevier Science Publishing Co., Inc, New York 1983
- Weiss S, Baumgart R, Jochum M, Strasburger C J, Bidlingmaier M. Systemic regulation of distraction osteogenesis: a cascade of biochemical factors. J Bone Miner Res 2002; 17: 1280–9
- Xu L, Fukumura D, Jain R K. Acidic extracellular pH induces vascular endothelial growth factor (VEGF) in human glioblastoma cells via ERK1/2 MAPK signaling pathway. J Biol Chem 2002; 277: 11368–74, MECHANISM OF LOW pH-INDUCED VEGF
- Yuan F, Leunig M, Berk D A, Jain R K. Microvascular permeability of albumin, vascular surface area, and vascular volume measured in human adenocarcinoma LS174T using dorsal chamber in SCID mice. Microvasc Res 1993; 45: 269–89
- Zhao Y, Chien S, Skalak R. Astochastic model of leukocyte rolling. Biophys J 1995; 69: 1309–20