Abstract
Background Talonavicular arthrodesis is a differential indication for triple arthrodesis. Differences regarding intraarticular pressure loads on the adjacent joints have not been investigated to date, but they are of clinical relevance when considering long-term joint degeneration.
Methods We used a dynamic foot model to measure intraarticular peak pressures with electronic sensors in 8 anatomical specimens in different areas of the ankle joint and in the naviculocuneiform joint. Force was applied to extrinsic tendons via cables attached to computer- regulated hydraulic cylinders. A ground reaction force was simulated in a tilting angle- and force-controlled translation stage.
Results We measured significantly higher peak pressures in the ankle joint after triple arthrodesis (5.7 Mpa) than after talonavicular arthrodesis (5.2 Mpa), with differences especially in the anterior section (5.2 Mpa as compared to 4.6 Mpa). Centrally, the peak pressure was similar, at 4.6 MPa and 4.5 Mpa, respectively. In the posterior area, the peak pressure after triple arthrodesis was lower (4.1 MPa as opposed to 4.4 Mpa). After triple arthrodeses, we measured higher values laterally/medially in the ankle joint (5.5 MPa/4.6 Mpa) than after talonavicular arthrodesis (5.1 MPa/4.4 Mpa). In the naviculocuneiform joint, we again saw higher peak pressures after triple arthrodesis than after talonavicular arthrodesis.
Interpretation Our findings from this cadaver study indicate a lower and more evenly distributed peak pressure load in the ankle joint after talonavicular arthrodesis than after triple arthrodesis; thus, mechanically, a selective arthrodesis appears to be more favorable. In contrast, triple arthrodesis leads to an increase in peak pressure in the ankle joint, which may in turn lead to joint degeneration.
For the surgical treatment of hindfoot pathologies in the triple joint complex, in the form of posttraumatic and inflammatory damage, and also neurological problems or congenital and acquired instabilities and defective positions, arthrodesis is one option. The triple joint complex includes the subtalar joint and the Chopart joint, with its two anatomically separate parts, namely the talonavicular (TN) joint and the calcaneocuboid (CC) joint. Selective arthrodeses of single parts of the joint are alternative treatments to the accepted triple arthrodesis, and are gaining increasing attention.
The stress on the adjacent joints and possible long-term arthrotic joint degeneration resulting from the intervention should be considered in the differential therapy planning. Fortin and Walling (Citation1999) referred to frequently observed degenerative changes in the long term following triple arthrodesis in the ankle joint and in the midfoot joints. Astion et al. (Citation1997) and Savory et al. (Citation1998) performed thorough mechanical investigations of the degree of residual function after talonavicular arthrodesis in the triple joint complex, but the resulting stress in the ankle joint and in the naviculocuneiform joint following the 2 arthrodeses remains unknown. We investigated any differences in the peak pressure load in the two connecting joints following simulated talonavicular arthrodesis and triple arthrodesis in a dynamic cadaver model.
Material and methods
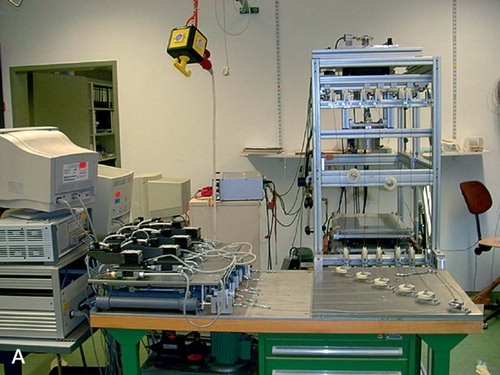
Our tests were performed on a prototype of a dynamic apparatus (). In the model, the foot, firmly fixed to the prepared tibia, walks on a moving platform. The rotation of the tibia is controlled by a slow servo motor. 9 extrinsic tendons of the foot are controlled by 6 servohydraulic cylinders according to individually determined force profiles, in order to allow a physiologically realistic simulation of the roll cycle. These roll cycles were initially tested for each foot set to the correct rotation. This method has been validated by Hurschler et al. (Citation2003). The intraarticular pressure was measured using resistive pressure films of 0.3 mm thickness (Tekscan), which were fastened in the sparingly opened joint using stitches around the capsule.
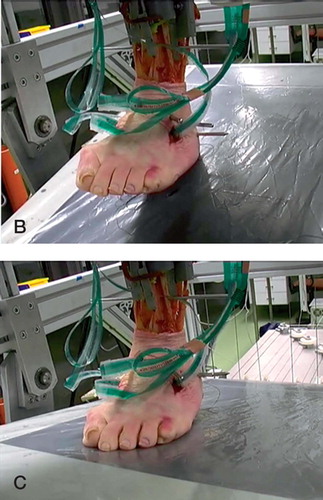
Figure 1. A. Testing apparatus. Frame structure with walking platform and tool for clamping of the foot on the right. In front, cable pulleys with servohydraulic cylinders simulating muscle force, with computers on the left. B and C shows the rolling motion of the foot specimen with heel on and push off. Extrinsic tendons of the foot are dissected from soft tissue and connected to cables using tendon clamps, pressure layers in situ, talonavicular arthrodesis but fixateur extern from subtalar arthrodesis already removed.
First, the feet were prepared. For this, the ankle joint and the naviculocuneiform joint were opened from the anterior side and pressure sensors reinforced with retention stitches were inserted into the joints. In the next step, the Os cuboideum and the Os naviculare were prepared and the proximal joint connections to the calcaneus and talus exposed. The talonavicular arthrodesis was applied using 2 cannulated 3.5 mm lag screws inserted under image converter control. The calcaneocuboid arthrodesis was fixed with a strong retrograde cannulated 5.5-mm screw, and the subtalar arthrodesis with an external fixator assembly of 2 pins in each of the tibia and calcaneus in a frame construction. The fixation in the joints was done in a visually- and radiographicallycontrolled neutral position. In order to carry out the measurements under identical conditions, all arthrodeses were first applied and checked for stability clinically and with an image converter. After fixing the preparations, 5 measurement runs for the triple arthrodesis were performed on each preparation. Then, the subtalar arthrodesis was undone by removing the fixator rods, and the calcaneocuboid arthrodesis was undone by removing the screw, and another 5 measurement runs were performed on the talonavicular arthrodesis without having changed the position of the foot in the apparatus. After extensive preliminary tests, 8 macroscopically and radiographically normal foot preparations were included in the test. For the naviculocuneiform joint, there were 6 preparations available since 1 preparation had to be excluded due to calibration problems and another due to an incorrect placement of the pressure film in the joint.
Physiological gait was simulated over a standardized time of 60 s from heel strike (0%) to toeoff (100%). As for the ground reaction force of 350 N, maximum muscle force was reduced to 50% of the estimated physiological values in order not to damage the specimens and to allow simulations to be repeated.
Intraarticular pressure was measured with resistive pressure sensors (K-scan sensor, map 4201; Tekscan Inc., Boston, MA). The sensor sheets with a thickness of 0.3 mm consist of 264 different sensors arranged in an 11 × 24 matrix, with a local resolution of 1.8 mm and a maximum pressure range of 13.8 MPa. The pressure values were recorded with the manufacturer's software (Iscan); with a recording rate of 2 Hz for a time span of 60 s, one obtains 120 pressure frames. Raw data were then exported as ASCII files and further analyzed in MatLab (TheMathwork Inc., Natik, MA).
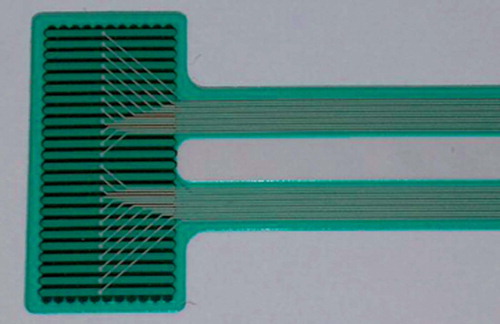
The sheet was cut along its electronic pathways to obtain a sensor area of 11 × 24 mm that would allow a secure placing below the distal tibial joint surface in the tibio-talar contact area and in the naviculocuneiforme joint (). Cutting of the sheet was necessary because the whole sheet was too wide to be placed in the joint space. The 24-mm-long side covered the frontal side and the 11-mm-long side of the pressure layer covered the sagittal edge of the joint. The cut sheets were sealed carefully to exclude moisture, and were fixed to the capsular tissue inside the joint with sutures. Each sensor part was calibrated separately in a materialtesting machine (ZwickRoell, Ulm, Germany) with a piece of rubber, in three steps (100 N, 200 N, and 300 N). During the experiments, the position of the sheet was closely observed by the investigators in order to rule out displacement during movement of the foot. Each experiment was performed 5 times. The standard deviation between all runs was calculated to assess repeatability of the measurements. Maximum peak pressure (MPP) in the successive pressure frame were determined.
Figure 2. Tekscan pressure layer for recording of intraarticular pressure.
Different regions of the joint as for medial and lateral or anterior, central, and posterior could be evaluated using appropriate submasks of the sensor matrix.
To illustrate our measurement methods, we present a summarized diagram for all feet. To obtain this diagram, we first averaged the time course of the MPP values for each foot (i.e. 5 runs per foot). Each avaraged time course was then normalized to 100% by the respective maximum value of MPP. The time course for all feet thus represents the averaged time course for all the normalized MPP values.
Statistics
The data were analyzed using JMP IN 5.1 software (SAS Institute Inc., Cary, NC). For each of the feet and each of the 5 replications, the measurements consisted of the values of peak pressure for 120 points in time. As dependent variable, we took the maximum of the 120 peak pressures. Since these were not normally distributed, we used Box-Cox transformations of the data to obtain normally distributed residuals with equal variances. For analysis of the maximum peak pressures in the naviculocuneiform joint and in the ankle, analyses of variance were performed for each joint separately, with the state (talonavicular vs. triple arthrodesis) as fixed factor and the foot as random factor. For examination of possible shifts of the peak pressures between different zones of the ankle, analyses of variance were performed with the state, the zone, and their interaction as fixed factors and (again) the foot as random factor.
Results
Ankle joint
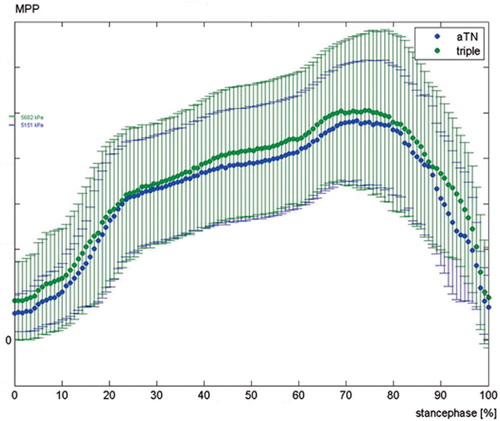
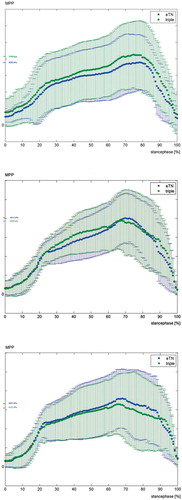
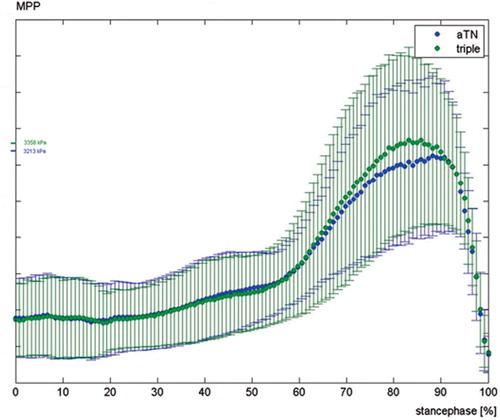
We observed a higher peak pressure in the ankle joint after triple arthrodesis than after talonavicular arthrodesis (p < 0.001). The difference between the two arthrodeses is shown in , in the stance phase of the walk cycle under temporal resolution. The pressure in isolated segments was also analyzed, as detailed in the Table.
Figure 3. Time course of maximum peak pressure (MPP) during stance phase in the ankle joint; triple arthrodesis in green (triple), talonavicular arthrodesis in blue (aTN); mean overall feet, with 95% CI. Mean value of all feet, 95% CI.
The nature of the peak pressure change is an important issue. We observed the highest pressure values in the frontal area of the ankle joint, compared to a central or posterior position, and we measured higher values laterally than medially for both types of arthrodesis. After talonavicular arthrodesis, we saw only slight peak pressure differences in the three areas measured in the sagittal direction, compared with the triple arthrodesis— which showed considerable differences. The differences in pressure at the anterior, central, and posterior zones of the ankle are shown graphically in . The peak pressure differed signifi- cantly (p-value for interaction = 0.02) between the zones after applying a triple arthrodesis compared to after a talonavicular arthrodesis, the result being greater stress on the anterior joint sections after triple arthrodesis and lower pressure values in the posterior joint areas. In contrast, there was no statistically significant difference in pressure between the two frontal zones (p-value for interaction = 0.3), but the peak pressure after triple arthrodesis was still found to be greater than the value for talonavicular arthrodesis.
Figure 4. Time course of maximum peak pressure (MPP) during stance phase in the anterior part of the ankle joint (panel A), the central part (panel B), and in the posterior part (panel C); triple arthrodesis in green (triple), talonavicular arthrodesis in blue (aTN); mean overall feet with 95% CI. Mean value of all feet, 95% CI.
Peak pressure in the ankle. Median (95% CI), in MPa
Naviculocuneiform joint
In the naviculocuneiform joint, we measured 3.4 MPa (95% CI: 2.5–4.4) medially after triple arthrodesis, as compared to 3.2 MPa (95% CI: 2.4– 4.2) after talonavicular arthrodesis. The difference in peak pressure was not statistically significant (p = 0.08). shows the pressure curve in the talonavicular joint for the two types of arthrodesis.
Figure 5. Time course of maximum peak pressure (MPP) during stance phase in navicularcuneiform joint; triple arthrodesis in green (triple), talonavicular arthrodesis in blue (aTN); mean overall feet with 95% CI. Mean value of all feet, 95% CI.
Discussion
Our findings are of relevance to the clinical practice of foot surgeons and should contribute to a better understanding of the mechanics of hindfoot arthrodesis. Graves et al. (Citation1993) found an unsatisfactorily high rate of joint degeneration in the 4 years following triple arthrodeses, with symptomatic cases in 7 of 18 feet operated in the ankle joint. The authors also reported radiographic abnormalities in 14 of 18 feet with degenerative changes although some were already observed before the operation. With such a high rate of asymptomatic radiographic changes in adjacent joints, there is no apparent benefit of a selective arthrodesis over a triple arthrodesis. In another study by deHeus et al. (Citation1997)—a 10-year follow-up of 37 triple arthrodeses— radiographic changes in the ankle joint were found in about three-quarters of the patients. Smith et al. (Citation2004) observed severe clinically abnormal changes in the ankle joint in 7 of 26 feet after 14 years. In that study, further cases of joint degenera- tion in 7 naviculocuneiform joints and in 6 tarsometatarsal joints were described.
Prior mechanical tests have shown that the mobility of the calcaneocuboid joint and of the subtalar joint is highly restricted after a talonavicular arthrodesis. Savory et al. (Citation1998), for example, stressed the key position of the talonavicular joint in the hindfoot complex after static measurements on cadaver preparations. Mobility in the calcaneocuboid joint is largely abolished after a selective talonavicular arthrodesis, with a resulting mobility of less than 5° for dorsiflexion/plantar flexion and a restriction of pronation/supination ability to onethird of the normal mobility of 19°. In the subtalar joint, the degree of movement is also restricted to one-third. This observation allows inferences about the functional advantage of a selective talonavicular arthrodesis over a triple arthrodesis. The results of these authors can be considered to be valid, since they have been confirmed by other investigators. In a similarly designed cadaver experiment, Astion et al. (Citation1997) also demonstrated the important position of the talonavicular joint in the triple joint complex. They saw restriction of subtalar mobility to as little as 9% of normal after a talonavicular arthrodesis. In both of these studies, however, the authors point out the minor effect of calcaneocuboid arthrodeses on the resulting mobility of the talonavicular joint and the subtalar joint.
With our foot model, we were able to measure the peak pressure distribution in the ankle joint under dynamic conditions. We observed a characteristic course of pressure in the tibiotalar joint, with a rapid increase in pressure upon setting the heel down. After 20% of the stance phase, the pressure reached a first plateau. After that, the increase in pressure proceeded more gradually to reach maximum pressure after 70% of the stance phase, during the forceful push-off phase. The main stress in the ankle joint lies anterolaterally. We measured a mean peak pressure of 4.8 MPa anteriorly, 4.2 MPa centrally, 3.7 MPa posteriorly, 4.8 MPa laterally, and 3.9 MPa medially. In comparison to the measurements after talonavicular arthrodesis, this signifies higher peak pressures centrally in the ankle joint—and above all posteriorly. In contrast, there is less pressure load anteriorly after talonavicular arthrodesis. Medially and laterally, the load increases after talonavicular arthrodesis. Lundberg et al. (Citation1989) found the percentage of dorsiflexion and plantar flexion of the foot relative to the lower leg to be about 20% in the Chopart joint, besides the main mobility in the ankle joint. Our measurements can be explained by a relative subluxation movement of the talus in the dorsal direction after talonavicular arthrodesis, which must be due to the functional loss of mobility in the Chopart joint during the rolling motion.
After triple arthrodesis, we saw up to 0.5 MPa higher values in all areas of the ankle joint, equaling an average peak pressure increase of more than 10%, with the greater increases tending to be in the posterior area. This increase in load may explain the degenerative changes in the ankle joint in the clinical long term. In particular, the increase in pressure anterolaterally—in the area that is already highly stressed under native conditions—must be problematic. According to our clinical observations, arthrosis in the ankle joint usually starts from this area, with radiographically conspicuous joint gap reduction and anterior osteophyte formation on the front edge of the tibia.
In the frontal plane, we measured a peak pressure increase in both arthrodesis techniques. The anatomical position of the arthrodesis has a special part to play here. A slight valgus deformity of 5–10° in the subtalar joint makes sense, and corresponds to the physiological position. Valgus angles above that lead to greater stress on the outer side of the ankle joint and were described by Fortin and Walling (Citation1999), following clinical observation, as being a cause of accelerated degeneration. This is easily understood mechanically, since a hindfoot valgus deformity of more than 10° must lead to an increased pressure load on the lateral parts of the ankle joint, as we found in this zone, which is subject to greater loads anyway. The present work was a laboratory study, however, and the definitive conclusion that a talonavicular arthrodesis gives a lower likelihood of developing ankle arthritis than does a triple arthrodesis should be examined in a clinical study.
Contributions of authors
AS: conceived and headed the study, and wrote most parts of the article; corresponding author. OM: interpretation of the complex electronical data, wrote the MatLab programs, and created the figures. TH: performed statistics. PL: performed the experiments. PR: wrote parts of the discussion and reviewed the article. NW: constructed the foot model.
- Astion D J, Deland J T, Otis J C, Kenneally S. Motion of the hindfoot after simulated arthrodesis. J Bone Joint Surg (Am) 1997; 79: 241–6
- deHeus J A, Marti R K, Besselaar P P, Albers G H. The influence of subtalar and triple arthrodesis on the tibiotalar joint. A long-term follow-up study. J Bone Joint Surg (Br) 1997; 79: 644–7
- Fortin T F, Walling A K. Triple arthrodesis. Clin Orthop 1999, 365: 91–9
- Graves S C, Mann R A, Graves K O. Triple arthrodesis in older adults. J Bone Joint Surg (Am) 1993; 75: 355–62
- Hurschler C, Emmerich J, Wulker N. In vitro simulation of stance phase gait. Part I: Model verification. Foot Ankle Int 2003; 24: 614–22
- Lundberg A, Goldie I, Kalin B, Selvik G. Kinematics of the ankle/foot complex: plantarflexion and dorsiflexion. Foot Ankle 1989; 9: 194–200
- Savory K M, Wulker N, Stukenborg C, Alfke D. Biomechanics of the hindfoot joints in response to degenerative hindfoot arthrodeses. Clin Biomech 1998; 13: 62–70
- Smith R W, Shen W, DeWitt S, Reischl S. Triple Arthrodesis in Adults with Non-paralytic Disease. J Bone Joint Surg (Am) 2004; 86: 2707–13