
Abstract
Background and purpose — Arthroscopic estimation of articular cartilage thickness is important for scoring of lesion severity, and measurement of cartilage speed of sound (SOS)—a sensitive index of changes in cartilage composition. We investigated the accuracy of optical coherence tomography (OCT) in measurements of cartilage thickness and determined SOS by combining OCT thickness and ultrasound (US) time-of-flight (TOF) measurements.
Material and methods — Cartilage thickness measurements from OCT and microscopy images of 94 equine osteochondral samples were compared. Then, SOS in cartilage was determined using simultaneous OCT thickness and US TOF measurements. SOS was then compared with the compositional, structural, and mechanical properties of cartilage.
Results — Measurements of non-calcified cartilage thickness using OCT and microscopy were significantly correlated (ρ = 0.92; p < 0.001). With calcified cartilage included, the correlation was ρ = 0.85 (p < 0.001). The mean cartilage SOS (1,636 m/s) was in agreement with the literature. However, SOS and the other properties of cartilage lacked any statistically significant correlation.
Interpretation — OCT can give an accurate measurement of articular cartilage thickness. Although SOS measurements lacked accuracy in thin equine cartilage, the concept of SOS measurement using OCT appears promising.
Optical coherence tomography (OCT) is a high-resolution, non-destructive imaging method. The resolution can be less than 5 μm (Drexler et al. Citation1999). OCT helps, for example, in measurement of the thickness of structures in the eyes (van Velthoven et al. Citation2007), blood vessels (Jang et al. Citation2005), and teeth (Wilder-Smith et al. Citation2009). The potential of OCT in osteoarthritis research and clinical diagnostics is also noteworthy (Drexler et al. Citation2001, Li et al. Citation2005, Viren et al. Citation2012).
Arthroscopy is a common diagnostic technique in both human and equine medicine. Arthroscopic measurement of articular cartilage thickness using OCT could help in detecting cartilage thinning (Cernohorsky et al. Citation2012) or scoring of cartilage lesion severity (te Moller et al. Citation2013, Niemelä et al. Citation2014). Studies in rabbits and goats showed high correlations between OCT and microscopy measurements of articular cartilage thickness (Han et al. Citation2003, Rogowska et al. Citation2003, Cernohorsky et al. Citation2015). However, no similar study has been conducted with thicker cartilage, such as in humans or horses.
The speed of ultrasound (US) is lower in osteoarthritic cartilage than in healthy cartilage (Myers et al. Citation1995). This may be due to changes in water and proteoglycan content in the tissue and to collagen degeneration (Joiner et al. Citation2001, Suh et al. Citation2001, Töyräs et al. Citation2003). Consequently, reduced speed of sound (SOS) in articular cartilage could serve as an indicator of early and local cartilage degeneration. A technique that enables accurate arthroscopic measurement of local variations in SOS could have high diagnostic value.
We investigated the accuracy of OCT in the measurement of equine cartilage thickness, and used a novel arthroscopic technique utilizing OCT thickness measurement and US time-of-flight (TOF) measurement to determine the SOS in cartilage. We hypothesized that combining OCT and US would help to give accurate SOS determination. We assessed the applicability and accuracy of the technique with experimental measurements using phantoms and equine cartilage, and by numerically estimating the measurement uncertainty. We further compared SOS in equine cartilage with the structural, compositional, and biomechanical properties of the tissue.
Material and methods
Sample preparation
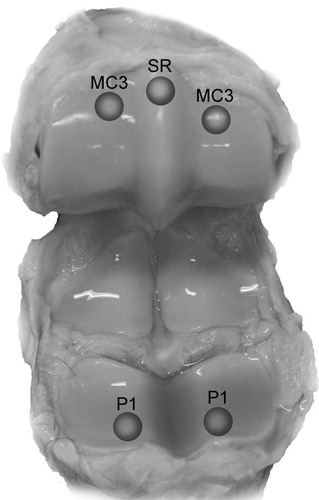
18 metacarpophalangeal joints of 13 horses (age >2 years) were obtained from a slaughterhouse and frozen until sample preparation. 4–7 osteochondral blocks including healthy cartilage and a variety of lesions were prepared from each joint (94 blocks in total; 34 from the proximal phalanx (P1), 34 from the dorsoproximal area of the condyles of the third metacarpal bone (MC3), 21 from the sagittal ridge of MC3 (SR), and 5 from other locations ()). Each block included 1 measurement site, marked with ink to ensure location matching between histological evaluation, spectroscopic analysis, thickness measurements, SOS measurements, and mechanical measurements.
Figure 1. Osteochondral samples were prepared from equine metacarpophalangeal joints at 5 anatomical locations: medial and lateral proximal phalanx (P1), medial and lateral dorsoproximal areas of the condyles of the third metacarpal bone (MC3), and the sagittal ridge of the third metacarpal bone (SR).
5 phantoms (2% and 4% agarose hydrogels, glass, silicone rubber, and acrylonitrile butadiene styrene) were first used for evaluation of SOS measurement based on simultaneous OCT and US recordings (described later). The thicknesses of the phantoms varied from 0.5 mm to 2.2 mm. The refractive indices of the phantom materials were determined with OCT using the modified optical length shifting method (Wang et al. Citation2010).
Cartilage thickness measurement using OCT
We used an OCT device (wavelength 1,305 ± 55 nm; Ilumien PCI Optimization System; St. Jude Medical, St. Paul, MN) with a thin catheter (0.9 mm diameter; C7 Dragonfly; St. Jude Medical), providing cross-sectional images (axial resolution <20 μm). The sample and the catheter were placed in phosphate-buffered saline (PBS) during the imaging process, with the catheter held manually above the ink marking or lesion, which were both visible in the OCT image. The thin low-scattering layer observed in OCT images just above the subchondral bone is assumed to correspond to calcified cartilage (Cernohorsky et al. Citation2012). The thickness of the non-calcified cartilage used in mechanical measurements was measured from the site of interest using the OCT system software. After matching the measurement points in the OCT and microscopy images, the thicknesses of non-calcified cartilage, calcified cartilage, and full cartilage were measured again from the raw images, taking into account the refractive index of cartilage (1.358; Wang et al. Citation2010). Pixel size was determined based on the known diameter of the OCT catheter and considering the refractive index of the water inside the catheter (1.322).
Speed of sound (SOS) measurements
First, the SOS in each phantom material was determined using a reference method; a custom-made acoustic microscope (Fc =50 MHz, −6 dB bandwidth =30–73 MHz, focal length =25 mm, Fs =550 MHz) was used to measure the TOF in the phantom and a caliper (resolution =10 μm; DIGI-MET 1226 417; Helios-Preisser GmbH, Gammertingen, Germany) to measure the thickness.
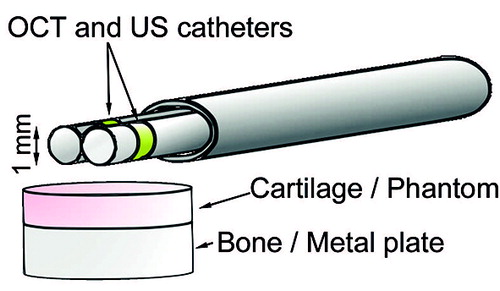
The SOS in each phantom was subsequently measured using the new technique based on simultaneous OCT and US imaging. We used the OCT system and a clinically applicable US system (Clear View Ultra; Boston Scientific Corporation, Marlborough, MA) providing cross-sectional images. Both the thin US catheter (diameter =1.0 mm, Fc =40 MHz, Fs =250 MHz; Atlantis SR Pro; Boston Scientific Corporation) and the OCT catheter were inserted through an oval-shaped, custom-made instrument channel to enable imaging of the same location simultaneously with both modalities (). Considering the largest diameter of the instrument channel (3.33 mm), it is possible to insert the instrument into a joint through normal arthroscopy portals. The phantoms on the metal plate and the instrument were immersed in degassed distilled water during the measurements. The instrument was aligned to direct the US beam perpendicular to the phantom surface. Each phantom SOS measurement set consisted of 10 consecutive US scans at the same location recorded simultaneously with 10 adjacent OCT cross sections. 5 of these sets of measurements were subsequently performed without repositioning the catheters. The reproducibility of the technique was evaluated by performing the set of 5 measurements 3 times and repositioning the catheters between each set.
Figure 2. The measurement setup. Adjacent optical coherence tomography (OCT) and ultrasound (US) catheters were inserted through an instrument channel. The phantom measurements were performed in distilled water and the cartilage measurements in a bath of phosphate-buffered saline.
Our technique was tested further by measuring SOS in equine cartilage in the laboratory. In these measurements, degassed PBS containing disodium EDTA and benzamidine HCl was used instead of water. To mimic arthroscopic conditions, the instrument was manually held over the cartilage surface and—to ensure a perpendicular US incidence angle—aligned so that the US reflection from the tidemark was maximal. The measurement was performed 5 times for each osteochondral sample. After the measurements, the samples were stored at −20 °C until they were prepared for histology.
Determination of time of flight (TOF) and sample thickness
TOF and sample thickness were measured from the exact raw US and OCT data, respectively. In osteochondral samples, US reflects from the cartilage surface and tidemark (Modest et al. Citation1989). The surface of the phantom or cartilage was defined automatically, and the bottom of the phantom or cartilage tidemark was defined manually for each of the 10 OCT cross sections. A 1-mm-wide analysis window was placed under the US catheter to match the thickness and TOF measurement sites in the lateral direction (). The average thickness within the window was calculated.
Figure 3. US TOF was determined from the US image as the time distance between the phantom or cartilage surface and the phantom-metal interface or the tidemark. Thickness of phantom and non-calcified cartilage was determined from the OCT image as the mean thickness inside a 1-mm-wide window (dashed line) under the US catheter.
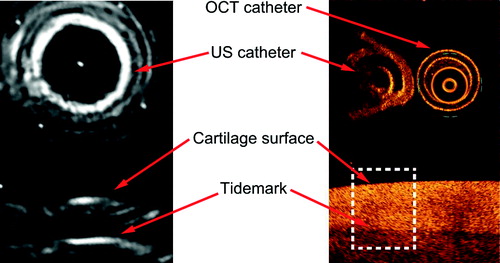
Hilbert envelopes of bandpass filtered (tenth-order Butterworth filter with upper and lower cutoff frequencies of 80 MHz and 15 MHz, respectively) ultrasound A-scan lines were determined. Phantom or cartilage surface and phantom bottom or cartilage tidemark were manually determined from as wide an area of the cross-sectional image reconstructed from the envelope signals as was feasible (). TOF in cartilage was measured from the average time distance between the interfaces. An average TOF was determined from 10 consecutively recorded cross sections and was used with the OCT-measured thickness for SOS determination:
(1)
Mechanical measurements
The mechanical properties of the osteochondral samples were determined using a custom-made material testing system (resolution for deformation and force: 0.1 μm and 5 mN, respectively) (Töyräs et al. Citation1999) equipped with a cylindrical plane-ended indenter (530 μm diameter). The indenter was driven into contact with the sample surface; this was seen from the reading of the load cell. Thereafter, the stress-relaxation test consisting of two 5% strain steps with a strain rate of 100% per second relative to the pre-strain thickness was performed. A relaxation slope of less than 10 Pa/min was used as the equilibrium criterion.
Using Abaqus (v6.10-1; Dassault Systèmes Simulia Corp., Waltham, MA) and Matlab (2012a, The MathWorks Inc., Natick, MA), an axisymmetric fibril-reinforced poroelastic finite element model was fitted to the experimental stress-relaxation data (Julkunen et al. Citation2007, Mäkelä et al. Citation2012). Cartilage was modeled using axisymmetric 4-node continuum pore pressure elements (CAX4P). Elastic fibrillar and biphasic porohyperelastic non-fibrillar matrices represented the collagen network and the PGs with a porous structure filled with fluid, respectively. The behavior of the collagen network was expressed with the fibril network modulus (Ef) and that of the non-fibrillar matrix with the non-fibrillar matrix modulus (Em), permeability (k), and Poisson’s ratio. The Poisson’s ratio (0.42) and fluid fraction (80%) were fixed (Li et al. Citation1999, Korhonen et al. Citation2003), while the other aforementioned material parameters were obtained through optimization, minimizing the mean square error between the experimental and simulated reaction forces. The first 5% achieved a perfect contact between the indenter and cartilage, and the optimization was conducted in the second step (5–10% strain). A more detailed description of the model is available in earlier studies (Li et al. Citation1999, Korhonen et al. Citation2003, Wilson et al. Citation2004, Julkunen et al. Citation2007, Kulmala et al. Citation2012).
Histological and spectroscopic analysis
Osteochondral blocks with the marked site of interest exactly in the middle were immersed in formalin for at least 48 h and then processed for histological evaluation (Kulmala et al. Citation2012). Three safranin-O-stained, 3-μm-thick sections from each sample were prepared and imaged with a light microscope. Cartilage thickness was measured manually after careful comparison of measurement location with OCT image. Three investigators graded the 3 stained sections of each sample using the Mankin score (Mankin et al. Citation1971). Final grades were obtained by averaging the scores and rounding up the average to the nearest integer. Optical density (OD) measurement of safranin-O distribution was conducted by means of digital densitometry (computer-controlled CCD camera; SenSys; Photometrics Inc., Tucson, AZ) to evaluate the fixed charge distribution in tissue (Panula et al. Citation1998). Collagen and PG contents were determined by measuring the areas under the absorption spectra at 1,585–1,720 cm-1 and 984–1,140 cm-1 measured from 3 unstained 5-μm-thick sections using a Fourier transform infrared spectroscope (FTIR; Spotlight 300 FTIRI; Perkin Elmer, Waltham, MA) (Boskey and Pleshko Camacho Citation2007). Polarized light microscopic analysis of 3 unstained 5-μm-thick sections was conducted (PLM; Leitz Orholux II POL, Leitz Wetzlar, Germany) to provide information on the orientation of the collagen fibrils (Rieppo et al. Citation2008). We determined the average collagen fibril orientation in relation to the cartilage surface, and the parallelism index (PI) describing the anisotropy of the collagen matrix.
Numerical assessment of SOS measurement error
The theoretical performance of the SOS measurement technique was numerically assessed by calculating the propagation of uncertainty. First, the effect of varying sample thickness and resolution of TOF measurement on SOS determination was studied. Perfect accuracy in thickness measurement was assumed while the thickness was varied from 0.3 mm to 3 mm, and TOF resolution corresponding to the measurement error was varied between 0 μs and 0.05 μs. Then we examined the effects of varying sample thickness and the resolution of thickness measurement on SOS determination. Perfect accuracy in TOF was assumed while the sample thickness and resolution of thickness measurement were varied from 0.3 mm to 3 mm and from 0 μm to 50 μm, respectively. In the analyses, true SOS was assumed to be 1,600 m/s.
Statistics
All 94 osteochondral samples were included in the analysis of OCT thickness measurement. 36 samples were excluded from the analysis of SOS measurement because the US reflection from either the cartilage surface or the tidemark was too weak for TOF measurement; 9 other samples were excluded because the cartilage was too damaged for mechanical measurement.
Spearman’s rank correlation coefficient was calculated to investigate the correlation between cartilage thickness measured from OCT and microscopic images of the samples. The same method was used to study the correlation between the SOS values in phantoms, measured using the reference and the novel techniques. Possible bias in the measurements was investigated using Bland-Altman analysis. The reproducibility of the SOS measurements was verified by calculating the root mean square coefficient of variation (CVrms(%)) for the phantom and cartilage measurements. The statistical significance of differences in cartilage thickness and SOS values between the anatomical locations was tested using the Kruskal-Wallis test. Linear dependencies between the SOS and the cartilage properties determined were evaluated using linear mixed-model analysis, which accounts for the correlations or clusters in the data set. The present study used the joint from which the sample was prepared as a random variable. The models assume that the residuals and the random effect are normally distributed and that the residuals are homoscedastic. The normality was assessed from quantile-quantile plots and homoscedasticity by investigating the variation of residuals as a function of predicted values. The results of these analyses supported the initial assumptions. The significance level in all the analyses was set to p < 0.05. The analyses were performed using SPSS and Matlab.
Results
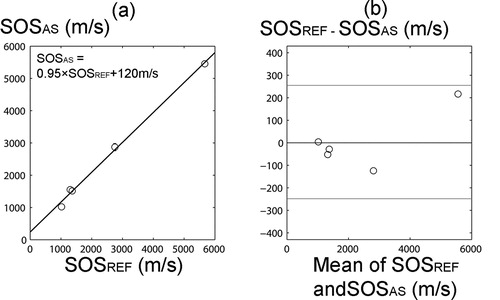
The SOS values in the phantoms measured using the combination of US and OCT were consistent with the values measured using the reference technique (ρ > 0.99, p < 0.001) and no systematic error was found based on Bland-Altman analysis (). CVrms(%) in SOS measured for the phantoms was 3.4%.
Figure 4. a. There was a high correlation between SOS in phantoms measured with the novel arthroscopic technique (SOSAS) and with the reference technique (SOSREF) (ρ > 0.99, p < 0.001). b. Bland-Altman plot of SOSAS and SOSREF. The 95% limits of agreement are shown with red lines.
In OCT images, calcified cartilage was discernible from non-calcified cartilage and bone in all but 3 samples (). The mean full cartilage thickness and the mean non-calcified cartilage thickness measured using OCT were 1.00 mm (SD 0.26) and 0.83 mm (SD 0.25), respectively. Samples from P1 (mean 1.03 mm (SD 0.27)) had significantly thicker non-calcified cartilage than samples from SR (0.74 mm (SD 0.16), p = 0.001) or MC3 (0.71 mm (SD 0.13), p < 0.001). The maximum full cartilage thickness and the maximum non-calcified cartilage thickness measurable with OCT were 1.80 mm and 1.44 mm, respectively. For the thinnest cartilage, the thicknesses were 0.53 mm and 0.37 mm, respectively.
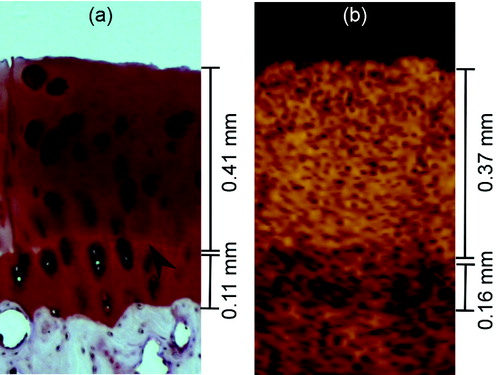
Figure 5. Non-calcified articular cartilage thickness was measured as the distance between the cartilage surface and the tidemark (arrowhead), seen here by light microscopy (panel a) and OCT (panel b). The full cartilage thickness also included the thickness of calcified cartilage. Calcified cartilage can be seen in OCT images as a low-scattering layer.
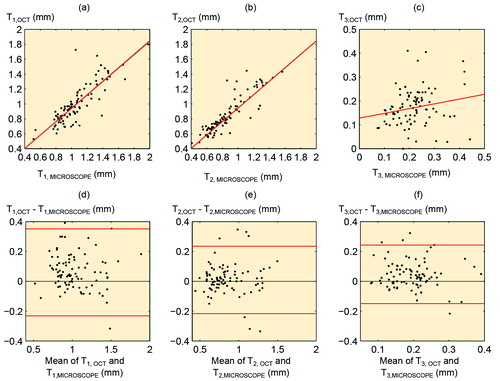
There was a significant correlation between full cartilage thickness measured from OCT images and that measured from microscopic images (ρ = 0.85; p < 0.001), while the corresponding correlations for non-calcified and calcified cartilage thicknesses were ρ = 0.92 (p < 0.001) and ρ = 0.22 (p = 0.04), respectively ().
Figure 6. a. Correlation between full cartilage thickness measured from OCT image (T1,OCT) and light microscopic image (T1,MICROSCOPE) (ρ = 0.85; p < 0.001). b. Correlation between non-calcified cartilage thickness measured from OCT image (T2,OCT) and light microscopic image (T2,MICROSCOPE) (ρ = 0.92; p < 0.001). c. Correlation between calcified cartilage thickness measured from OCT image (T3,OCT) and light microscopic image (T3,MICROSCOPY) (ρ = 0.22; p = 0.04). d–f. Bland-Altman plots representing the differences between OCT measurements and microscopic measurements. The 95% limits of agreement are shown with red lines.
The CVrms(%) for the repeated measurements of thickness, TOF, and SOS, of the equine cartilage was 7.3%, 7.6%, and 7.8%, respectively. The mean SOS in the cartilage samples was 1,636 m/s. The median Mankin scores of all the samples and of those included in the SOS measurement were 4 and 3, respectively (). SOS was not significantly dependent on anatomical location (p = 0.3). No statistically significant linear dependence was detected between SOS and the cartilage properties determined ().
Table 1. Mean speed of sound (SOS), mean non-calcified cartilage thickness, and median Mankin score of the samples included in the speed of sound measurements, grouped by anatomical location
Table 2. p-values for linear association between speed of sound (SOS) and the fixed effects (structural, compositional, and biomechanical properties) using the linear mixed model
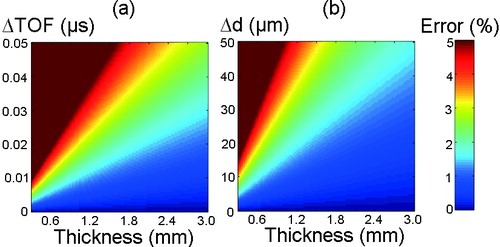
The numerical assessment of error in SOS measurements revealed that especially in thin equine cartilage, the resolutions of US and OCT systems have a prominent effect on the accuracy of SOS measurement ().
Figure 7. Numerically evaluated effect of resolutions of US (ΔTOF) measurements (panel a) and OCT (Δd) measurements (panel b) on error in SOS values determined for cartilage of varying thickness.
Discussion
In most OCT images of the osteochondral samples, the calcified cartilage could be well discriminated from both non-calcified cartilage and subchondral bone. OCT measurements of non-calcified cartilage thickness agreed well with the microscopic measurements. Rough cartilage-bone interface and secondly light attenuation reduce the accuracy of the measurement of calcified cartilage thickness, and consequently that of the measurement of full cartilage thickness. According to our Bland-Altman analysis, the absolute difference between the 2 modalities increased with thicker cartilage. The relative difference between OCT and microscopic measurements was similar to that in previous studies that investigated rabbit and goat cartilage with thicknesses less than 1 mm (Han et al. Citation2003, Rogowska et al. Citation2003, Cernohorsky et al. Citation2015). A cartilage thickness of 1.1 mm in the first carpometacarpal joint in humans has been measured with OCT (Cernohorsky et al. Citation2012). In our study, the highest measurable thickness was 1.8 mm, which agrees with the OCT light penetration limit of about 1.0–2.0 mm common for soft tissues (Fujimoto et al. Citation1995).
We compared light microscopic images and OCT images before selecting the thickness measurement points. Although the mismatch between the measurement locations was small in all samples, it could still be the main reason for the difference in thickness values between OCT and microscopy. Additionally, fixation and processing of the samples for microscopy may have a small shrinking effect on sample dimensions. Some inaccuracy in OCT measurements may be due to the use of the same value in the literature for the refractive index of both non-calcified and calcified cartilage.
We hypothesized that by using OCT thickness measurement with simultaneous US TOF measurement, arthroscopic determination of cartilage SOS would be possible. The technique that we introduced enabled simultaneous measurement of US TOF in articular cartilage and cartilage thickness at the same location. Our technique may be used in conventional arthroscopy, as the instrument fits through normal arthroscopic portals.
Based on the phantom measurements, the combination of OCT and US would enable SOS measurement in layered materials. The mean SOS in the equine cartilage samples agreed with the values given in the literature (1,696 m/s) (Brommer et al. Citation2005). The structure and composition of articular cartilage control its mechanical and acoustic properties (Buckwalter and Mankin Citation1997, Joiner et al. Citation2001, Suh et al. Citation2001, Töyräs et al. Citation2003). However, no statistically significant dependence was found between SOS and the structural or mechanical properties determined.
Repeatability in SOS measurement is reduced if the surface is fibrillated, as fibrillation impairs the accuracy of locating the cartilage surface, particularly from US images. However, SOS measurements may be unnecessary when there is visible fibrillation, as osteoarthritis that has advanced as far as this can be diagnosed with conventional techniques.
We estimated the error in SOS measurement caused by inaccuracy in the thickness and TOF measurements with different cartilage thicknesses. Theoretically, the resolutions of the current OCT and US systems are sufficient for SOS measurement. However, the accuracy of the present measurement is partially limited by the less than optimal optical and acoustic contrasts between non-calcified and calcified layers. Attenuation of light and US in cartilage further limits the contrast in the tidemark, and therefore the highest cartilage thickness and TOF measurable with this technique. Thus, the technique requires further development before it would be suitable for clinical use in equine or human medicine. Advanced signal and image processing could enhance the contrast, and the use of point measurement or linear scanning instead of rotational scanning could improve measurement accuracy. Furthermore, the US frequency and intensity could be optimized to increase the penetration of US into the tissue. The accuracy of the US and light incidence angle, which should be perpendicular to the cartilage surface, could also be improved through improved probe design.
In conclusion, articular cartilage thicknesses below 1.8 mm were successfully measured with OCT. OCT-based thickness measurements were more accurate when calcified cartilage was excluded. The measurement could be used for arthroscopic detection of cartilage thinning during arthroscopy and estimation of lesion depth. Before becoming suitable for clinical use, the measurement accuracy of the SOS measurement technique presented must be improved. However, the concept of simultaneous OCT and US imaging for SOS measurement appears to be both feasible and promising.
This work was supported in part by the Jenny and Antti Wihuri Foundation, Academy of Finland (132367, 140730, 267551 and 268378), Kuopio University Hospital (EVO 5041723 and 5041738, and VTR 15654156), strategic funding of the University of Eastern Finland (931053), the University of Oulu (24001200), the Department of Equine Sciences of Utrecht University, and the CSC – IT Center for Science, Finland. We also thank Simo Ojanen and Eija Rahunen for technical assistance and Tuomas Selander for assistance with statistics.
All authors contributed to the study design, interpretation of results, and critical review of the manuscript. In addition, PP performed experimental work, data analysis, and writing of the manuscript, NtM performed experimental work and data analysis, and PT performed experimental work.
No competing interests declared.
- Boskey A, Pleshko Camacho N. FT-IR imaging of native and tissue-engineered bone and cartilage. Biomaterials 2007; 28 (15): 2465–78.
- Brommer H, Laasanen M S, Brama P A, van Weeren P R, Barneveld A, Helminen H J, Jurvelin J S. Influence of age, site, and degenerative state on the speed of sound in equine articular cartilage. Am J Vet Res 2005; 66 (7): 1175–80.
- Buckwalter J A, Mankin H J. Articular cartilage. Part I: Tissue design and chondrocyte-matrix interactions. J Bone Joint Surg Am 1997; 79A (4): 600–11.
- Cernohorsky P, de Bruin D M, van Herk M, Bras J, Faber D J, Strackee S D, van Leeuwen T G. In-situ imaging of articular cartilage of the first carpometacarpal joint using co-registered optical coherence tomography and computed tomography. J Biomed Opt 2012; 17 (6): 060501.
- Cernohorsky P, Kok A C, Bruin D M, Brandt M J, Faber D J, Tuijthof G J, Kerkhoffs G M, Strackee S D, van Leeuwen T G. Comparison of optical coherence tomography and histopathology in quantitative assessment of goat talus articular cartilage. Acta Orthop 2015; 86(2): 257–63.
- Drexler W, Morgner U, Kartner F X, Pitris C, Boppart S A, Li X D, Ippen E P, Fujimoto J G. In vivo ultrahigh-resolution optical coherence tomography. Opt Lett 1999; 24 (17): 1221–3.
- Drexler W, Stamper D, Jesser C, Li X, Pitris C, Saunders K, Martin S, Lodge M B, Fujimoto J G, Brezinski M E. Correlation of collagen organization with polarization sensitive imaging of in vitro cartilage: implications for osteoarthritis. J Rheumatol 2001; 28 (6): 1311–8.
- Fujimoto J G, Brezinski M E, Tearney G J, Boppart S A, Bouma B, Hee M R, Southern J F, Swanson E A. Optical biopsy and imaging using optical coherence tomography. Nat Med 1995; 1 (9): 970–2.
- Han C W, Chu C R, Adachi N, Usas A, Fu F H, Huard J, Pan Y. Analysis of rabbit articular cartilage repair after chondrocyte implantation using optical coherence tomography. Osteoarthritis Cartilage 2003; 11 (2): 111–21.
- Jang I K, Tearney G J, MacNeill B, Takano M, Moselewski F, Iftima N, Shishkov M, Houser S, Aretz H T, Bouma M E. In vivo characterization of coronary atherosclerotic plaque by use of optical coherence tomography. Circulation 2005; 111 (12): 1551–5.
- Joiner G A, Bogoch E R, Pritzker K P, Buschmann M D, Chevrier A, Foster F S. High frequency acoustic parameters of human and bovine articular cartilage following experimentally-induced matrix degradation. Ultrason Imaging 2001; 23 (2): 106–16.
- Julkunen P, Kiviranta P, Wilson W, Jurvelin J S, Korhonen R K. Characterization of articular cartilage by combining microscopic analysis with a fibril-reinforced finite-element model. J Biomech 2007; 40 (8): 1862–70.
- Korhonen R K, Laasanen M S, Töyräs J, Lappalainen R, Helminen H J, Jurvelin J S. Fibril reinforced poroelastic model predicts specifically mechanical behavior of normal, proteoglycan depleted and collagen degraded articular cartilage. J Biomech 2003; 36 (9): 1373–9.
- Kulmala K A M, Pulkkinen H J, Rieppo L, Tiitu V, Kiviranta I, Brünott A, Brommer H, van Weeren R, Brama P A, Mikkola M T, Korhonen R K, Jurvelin J S, Töyräs J. Contrast-enhanced micro-computed tomography in evaluation of spontaneous repair of equine cartilage. Cartilage 2012; 3 (3): 235–44.
- Li L P, Soulhat J, Buschmann M D, Shirazi-Adl A. Nonlinear analysis of cartilage in unconfined ramp compression using a fibril reinforced poroelastic model. Clin Biomech 1999; 14 (9): 673–82.
- Li X D, Martin S, Pitris C, Ghanta R, Stamper D L, Harman M, Fujimoto J G, Brezinski M E. High-resolution optical coherence tomographic imaging of osteoarthritic cartilage during open knee surgery. Arthritis Res Ther 2005; 7 (2): R318–R23.
- Mankin H J, Dorfman H, Lippiello L, Zarins A. Biochemical and metabolic abnormalities in articular cartilage from osteo-arthritic human hips. II. Correlation of morphology with biochemical and metabolic data. J Bone Joint Surg Am 1971; 53 (3): 523–37.
- Modest V E, Murphy M C, Mann R W. Optical verification of a technique for in situ ultrasonic measurement of articular cartilage thickness. J Biomech 1989; 22 (2): 171–6.
- Myers S L, Dines K, Brandt D A, Brandt K D, Albrecht M E. Experimental assessment by high-frequency ultrasound of articular-cartilage thickness and osteoarthritic changes. J Rheumatol 1995; 22 (1): 109–16.
- Mäkelä J T A, Huttu M R J, Korhonen R K. Structure-function relationships in osteoarthritic human hip joint articular cartilage. Osteoarthritis Cartilage 2012; 20 (11): 1268–77.
- Niemelä T, Virén T, Liukkonen J, Argüelles D, te Moller N C, Puhakka P H, Jurvelin J S, Tulamo R M, Töyräs J. Application of optical coherence tomography enhances reproducibility of arthroscopic evaluation of equine joints. Acta Vet Scand 2014; 56: 3.
- Panula H E, Hyttinen M M, Arokoski J P A, Långsjö T K, Pelttari A, Kiviranta I, Helminen H J. Articular cartilage superficial zone collagen birefringence reduced and cartilage thickness increased before surface fibrillation in experimental osteoarthritis. Ann Rheum Dis 1998; 57 (4): 237–45.
- Rieppo J, Hallikainen J, Jurvelin J S, Kiviranta I, Helminen H J, Hyttinen M M. Practical considerations in the use of polarized light microscopy in the analysis of the collagen network in articular cartilage. Microsc Res Techniq 2008; 71 (4): 279–87.
- Rogowska J, Bryant C M, Brezinski M E. Cartilage thickness measurements from optical coherence tomography. J Opt Soc Am A Opt Image Sci Vis 2003; 20 (2): 357–67.
- Suh J K F, Youn I, Fu F H. An in situ calibration of an ultrasound transducer: a potential application for an ultrasonic indentation test of articular cartilage. J Biomech 2001; 34 (10): 1347–53.
- te Moller N C, Brommer H, Liukkonen J, Virén T, Timonen M, Puhakka P H, Jurvelin J S, van Weeren P R, Töyräs J. Arthroscopic optical coherence tomography provides detailed information on articular cartilage lesions in horses. Vet J 2013; 197(3): 589–95.
- Töyräs J, Rieppo J, Nieminen M T, Helminen H J, Jurvelin J S. Characterization of enzymatically induced degradation of articular cartilage using high frequency ultrasound. Phys Med Biol 1999; 44 (11): 2723–33.
- Töyräs J, Laasanen M S, Saarakkala S, Lammi M J, Rieppo J, Kurkijärvi J, Lappalainen R, Jurvelin J S. Speed of sound in normal and degenerated bovine articular cartilage. Ultrasound Med Biol 2003; 29 (3): 447–54.
- van Velthoven M E J, Faber D J, Verbraak F D, van Leeuwen T G, de Smet M D. Recent developments in optical coherence tomography for imaging the retina. Prog Retin Eye Res 2007; 26 (1): 57–77.
- Wang S Z, Huang Y P, Wang Q, Zheng Y P, He Y H. Assessment of depth and degeneration dependences of articular cartilage refractive index using optical coherence tomography in vitro. Connect Tissue Res 2010; 51 (1): 36–47.
- Wilder-Smith C H, Wilder-Smith P, Kawakami-Wong H, Voronets J, Osann K, Lussi A. Quantification of dental erosions in patients with GERD using optical coherence tomography before and after double-blind, randomized treatment with esomeprazole or placebo. Am J Gastroenterol 2009; 104 (11): 2788–95.
- Wilson W, van Donkelaar C C, van Rietbergen B, Ito K, Huiskes R. Stresses in the local collagen network of articular cartilage: a poroviscoelastic fibril-reinforced finite element study. J Biomech 2004; 37 (3): 357–66.
- Viren T, Huang Y P, Saarakkala S, Pulkkinen H, Tiitu V, Linjama A, Kiviranta I, Lammi M J, Brünott A, Brommer H, van Weeren R, Brama P A, Zheng Y P, Jurvelin J S, Töyräs J. Comparison of ultrasound and optical coherence tomography techniques for evaluation of integrity of spontaneously repaired horse cartilage. J Med Eng Technol 2012; 36 (3): 185–92.