
Abstract
Background and purpose — The natural history of focal cartilage defects (FCDs) is still unresolved, as is the long-term cartilage quality after cartilage surgery. It has been suggested that delayed gadolinium-enhanced magnetic resonance imaging of cartilage (dGEMRIC) is a biomarker of early OA. We aimed to quantitatively evaluate the articular cartilage in knees with FCDs, 12 years after arthroscopic diagnosis.
Patients and methods — We included 21 patients from a cohort of patients with knee pain who underwent arthroscopy in 1999. Patients with a full-thickness cartilage defect, stable knees, and at least 50% of both their menisci intact at baseline were eligible. 10 patients had cartilage repair performed at baseline (microfracture or autologous chondrocyte implantation), whereas 11 patients had either no additional surgery or simple debridement performed. Mean follow-up time was 12 (10–13) years. The morphology and biochemical features were evaluated with dGEMRIC and T2 mapping. Standing radiographs for Kellgren and Lawrence (K&L) classification of osteoarthritis (OA) were obtained. Knee function was assessed with VAS, Tegner, Lysholm, and KOOS.
Results — The dGEMRIC showed varying results but, overall, no increased degeneration of the injured knees. Degenerative changes (K&L above 0) were, however, evident in 13 of the 21 knees.
Interpretation — The natural history of untreated FCDs shows large dGEMRIC variations, as does the knee articular cartilage of surgically treated patients. In this study, radiographic OA changes did not correlate with cartilage quality, as assessed with dGEMRIC.
The best treatment for focal acute or chronic cartilage defects (FCDs) is not yet resolved. A non-invasive technique of visualizing defects, and of evaluating the status following treatment of such defects, would be of value. The sensitivity of conventional MRI in detecting FCDs varies from 18% to 100% (Spiers et al. Citation1993, Yoshioka et al. Citation2004), whereas the specificity is more than 90% (Friemert et al. Citation2004, Bredella et al. Citation1999). The sensitivity and accuracy of MRI increased throughout the late 1990s, and after 2000 with the development of newer modalities and more powerful field strengths, but small superficial changes and small defects are still generally invisible using MRI. The idea of detecting each of the components of the cartilage led to the development of several quantitative techniques. One of these techniques is based on the loss of glycosaminoglycans (GAGs) seen in early osteoarthritis (OA), and is called delayed gadolinium-enhanced magnetic resonance imaging of cartilage (dGEMRIC). It detects degenerative changes earlier than standard modalities. The technique seems promising for assessment of the natural progression of the disease, for timing of therapeutic intervention, and in defining the functional status of the tissue after repair.
FCDs induce OA in animal models (Lefkoe et al. Citation1993). We know from animal studies that small defects might heal spontaneously, but when the diameter approaches 6 mm that tendency disappears. The natural development of isolated cartilage defects in humans remains unknown. There is general agreement that full-thickness defects larger than 2 cm2 in an otherwise stable and healthy knee can be treated surgically with cartilage repair. However, we are not aware of any original research to support this assumption.
Debridement is a common and effective technique for smaller cartilage lesions in the knee, as a first-line treatment (Hubbard Citation1996). Cartilage repair leads to clinical improvement after 2 years followed by a further stable clinical situation or a slight deterioration 5 to 10 years after autologous chondrocyte implantation (ACI) (Niemeyer et al. Citation2014). 3 long-term follow-up randomized controlled trials (RCTs) on cartilage surgery have been published. Radiological OA after cartilage surgery occur in 17% (10 years) to 57% (14–15 years) of patients treated with osteochondral autologous transplantation (OAT) (Ulstein et al. Citation2014, Knutsen et al. Citation2016).
The efficacy of cartilage repair surgery has never been tested against non-operative treatment in an RCT. Some cohort studies have demonstrated a potential benefit of non-operative treatment. Wondrasch et al. (Citation2013) included a preoperative training program in an RCT for surgical treatment of an FCD. Following “prehabilitation”, two-thirds of the patients had improved functional scores, so that surgery was cancelled or delayed for at least 2 years.
The purpose of this study was to evaluate the biochemical status of knee articular cartilage 12 years after the diagnosis of full-thickness FCDs. We hypothesized that these patients would have a low dGEMRIC index, indicating degenerative changes. Our null hypothesis was that the cartilage quality is normal for more than 10 years after a diagnosed FCD. We included T2 mapping and assessed radiographs of both knees and information on patient-related outcome measures (PROMs).
Patients and methods
Data on 993 patients undergoing knee arthroscopy during a 6-month period in 1999 were collected from 3 hospitals (Aroen et al. Citation2004). All these knee arthroscopies were performed because of knee pain. Patients with an International Cartilage Repair Society (ICRS) classification grade 3–4 focal cartilage lesion, classified as not having OA and less than 50 years of age at baseline, were re-examined after 6 years (Loken et al. Citation2010). Of these, 98 patients fulfilled the inclusion criteria and 84 were included. In the present 12-year follow-up, we invited patients with full-thickness cartilage lesions who were less than 50 years of age at baseline, who had no total knee ligament injury, and who had more than 50% of their lateral and/or medial meniscus intact (). A cohort of patients previously included in an RCT on cartilage repair (Knutsen et al. Citation2004) was also invited to participate in the study. 42 patients from these 2 original studies were eligible for inclusion, and 21 agreed to participate and signed a written consent document. 10 patients were treated with either microfracture (MF) or ACI at baseline. 11 patients had not undergone cartilage repair, either at baseline nor later. 3 patients from the latter group had debridement performed at baseline. Median time from baseline to follow-up was 12 (11–12) years.
Figure 1. The flow of patients. *As a double dose of Magnevist was given, the protocol was allowed only for a limited amount of time at our hospital. We were therefore unable to examine all of the subjects included. We excluded them, as dGEMRIC was the main outcome.

MRI protocol
The dGEMRIC was performed as a T1 mapping based on 3-dimensional gradient-echo (3D-GRE) sequence with different flip angle combinations compared to standard IR sequence at 1.5T. We used a Siemens Avanto MRI machine (Siemens Healthcare GmbH, Erlangen, Germany) with similar methods to those used by Årøen et al. (2016). Protocols have been established by Burstein et al. (Citation2001) and Tiderius et al. (Citation2001). Our local protocol at Oslo University Hospital was modified based on the post-contrast imaging protocol of Burstein et al. (Citation2001). The patients exercised on stairs for 15 min after contrast injection, then rested in 75 min, after which the post-contrast images were taken. The patients were in supine position until completion. The dGEMRIC value was read as T1(Gd). A T2 mapping for the index knee was also performed. The measurements were taken at 6 regions of interest (ROIs)—anteriorly, centrally, and posteriorly on the medial and lateral femoral condyles. An experienced MRI radiologist (HB), who was blinded regarding all other information related to the patients, evaluated the images. The dGEMRIC index could not be calculated for 8 regions in the injured knee in 5 patients and for 1 region in the uninjured knee in 1 patient, due to marked cartilage thinning.
Kellgren and Lawrence grading
The standing radiographs were obtained with bilateral weight bearing in a posteroanterior direction using a SynaFlexer 64 frame (Synarc Inc., Newark, CA) to standardize knee position in 20° flexion and 5° external rotation of the feet. The images were evaluated (LE) according to the Kellgren and Lawrence (K&L) protocol for assessment of knee OA .
Statistics
The ROI values of the index condyle in injured knees were compared to the values of the corresponding ROIs in knees that had the baseline defect located on the opposite and presumably normal condyle. Both the single measurements from each ROI and the average dGEMRIC index (values from several ROIs pooled together) were used for analyses. The data file was arranged to contain the mean value of the injured condyle and compartment, that of the uninjured condyle in the injured knee, that of the corresponding compartment (to the injured compartment) in the uninjured knee, the mean value of the medial and lateral condyles in both the injured knee and the uninjured knee, and the mean of the entire injured and uninjured knee.
The primary outcome was dGEMRIC. The uninjured knee was used as control. Analyses were done using IBM Statistics SPSS 22. As we aimed to recruit all the eligible patients from a previous cohort, power analyses were not crucial for the inclusion process. We still examined the power, and with a 1-sided test with 1 − β = 0.80, α = 0.05, mean value in population 410 ms, mean value in study group 460 ms, and SD =80, the sample size needed would be 20.
The dGEMRIC measurements were normally distributed. We initially performed t-tests. The result from a Wilcoxon signed rank test did not differ from the parametric test. The same tests were used for the T2 mapping, except for independent t-test instead of paired t-test when comparing the injured condyle with its corresponding condyle. Pearson correlation was used to test associations between the injured condyle and the corresponding condyle. A Wilcoxon (Mann Whitney U) test was done for comparison of subgroups based on whether there had been cartilage surgery at baseline, meniscal resection of more than one-third or less, or defects larger than 2 and 4 cm2. Associations between baseline factors (patient and defect demographics) and primary or secondary outcomes were assessed with scatter plots. For cases with a possible line plot, correlation was tested with Spearman tests. There were too few patients included to compare subgroups with patient-related outcome measures (PROMs) as outcome, but the descriptive results from the 12-year follow-up are reported, expressed as median with interquartile range (IQR) to account for possible bias from outliers.
Ethics
The study was approved by the regional ethics committee (reference numbers S-09234a 2009/5791 and 2011/1141).
Results
Study group
Pertinent baseline data were similar between patients with defects left untreated or treated with debridement and patients treated with cartilage repair (). The long-term results from PROMs were as follows: Lysholm 69 (52–81), Tegner 4 (3–5), VAS 30 (10–50), KOOS sports 45 (30–66), and KOOS quality of life 56 (38–71).
Table 1. Baseline data
dGEMRIC and T2
The mean dGEMRIC index in injured knees was statistically significantly higher than in uninjured knees (). There was a statistically insignificant lower value for the injured compartment relative to the corresponding compartment of the uninjured knee. For 8 knees, we knew the exact location of the original defect in the sagittal plane, and we found a trend of a lower value for the injured area than for the matching area of the uninjured knee. Analyses regarding the location of defects medially or laterally revealed no statistically significant differences in the injured knee, for either medial or lateral localization. There was a strong correlation (r = 0.68) between the scores of the injured medial femoral condyle (MFC) and the uninjured MFC for all medial ROIs when an FCD was present medially (). No correlation was found laterally. We also explored the relationship between medial and lateral defects based on the localization in the sagittal plane (). The mean dGEMRIC of all ROIs is given in the same table.
Figure 2. The association between dGEMRIC values on the injured and uninjured medial femoral condyles (MFCs).
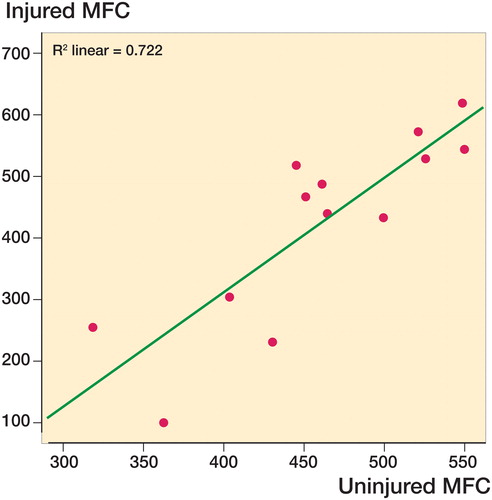
Table 2. Mean dGEMRIC values based on localization within the index knee, compartment/condyle, and even in the sagittal plane (the latter only in 8 patients)
Table 3. Mean dGEMRIC index in all 6 ROIs of both the injured and the uninjured knee. The delta (dGEMRICuninjured knee − dGEMRICinjured knee) is also given, which was tested by t-test against the value zero
There were no statistically significant differences in dGEMRIC between groups based on cartilage surgery or degree of meniscal resection. Age at operation did not appear to influence the later dGEMRIC values in either the injured knee or condyle. There were no statistically significant differences in T2 values between injured and non-injured ROIs ().
Table 4. The mean T2 values for the injured knee. The lower part of the table illustrates the results from the t-test as explained in text
Discussion
The principal finding in this study was that there were no more degenerative changes in the injured knees than in the uninjured knees, as evaluated by dGEMRIC.
dGEMRIC and T2
There have been some long-term studies on clinical outcome in humans. A study following young and athletic patients after arthroscopic diagnosis of an isolated FCD found that 92% of patients had returned to pre-injury activity levels by 12–15 years (Messner and Maletius Citation1996). Another study performed T1-weighted fat-saturated MRI at baseline and after 2 years and found that one-third of the knees deteriorated whereas 37% improved in cartilage defect score (Ding et al. Citation2006). Widuchowski et al. (Citation2009) found outcomes comparable to those following cartilage repair in patients with isolated untreated severe cartilage lesions (size 2–4 cm2) in the knee after 15 years. Furthermore, 39% had OA and there was no difference when injured and uninjured knees were compared.
Previous studies with dGEMRIC have found T1 values in healthy subjects to be 440–570 ms (Burstein et al. Citation2001) and 480–560 ms (Tiderius et al. Citation2001). Lower values and later joint space narrowing (JSN) have been found in meniscectomized patients (Owman et al. Citation2014). Results from previously explored populations are given in Table 5 (see Supplementary data). 9 patients in our study group underwent meniscal resection at baseline, and there were no statistically significantly lower dGEMRIC in those patients.
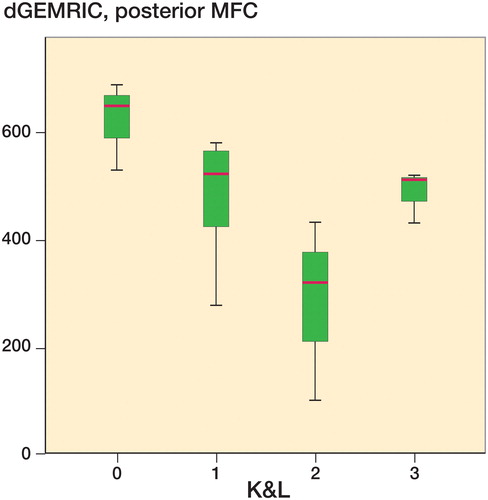
The numbers in our study are within this lower range of reference values from healthy populations, and indicate that no degenerative changes were evident in our study group. The lack of differences between the injured knee and the uninjured knee support this. However, the degenerative changes present with the K&L grading suggest the opposite: that degeneration had occurred within the injured knees. We found established radiological OA in 6 injured knees and in 4 uninjured knees, and degenerative changes (K&L 1) in 7 injured and 2 uninjured knees. To our surprise, it was not possible to demonstrate this clearly with dGEMRIC in this population, and there was no overall correlation between dGEMRIC and K&L grading. There were, however, some indications of a relationship between these 2 variables based on box plots (). Especially in the posterior part of the medial condyle, decreased values of dGEMRIC were associated with increased K&L grade. A possible explanation might be that severe OA produces a biochemical environment where dGEMRIC is no longer sensitive.
Figure 3. Box plot with dGEMRIC values for the posterior aspect of the MFC in the injured knee and K&L grade in the injured knee. The horizontal line within the box represents the median, whereas the distance between the top and bottom of the box is the interquartile range, between the 25th percentile and the 75th percentile. The whiskers show the smallest and largest values of the sample.
The dGEMRIC index gives a numeric value on a scale from around 300–700 ms. A difference of >100 has been considered to be clinically/radiographically significant (Cunningham et al. Citation2006). Unmeasurable T1 results were assigned the value of 100 ms for the purposes of statistical analysis. This number is lower than what have been previously demonstrated from studies with dGEMRIC. If these absent values were defined as “missing”, it would lead to major bias—since most areas with thin cartilage are in the areas of the original defects.
The use of the uninjured knee as a control is controversial. An experimental study of the patellofemoral joint in rabbits evaluated the degeneration of cartilage 12 months after blunt impacts (Newberry et al. Citation1998). The cartilage in the index knee was significantly thinner and the subchondral plate thicker than in controls, but changes were also seen in the unimpacted side. The low values in uninjured knees may be the result of a general degenerative joint disease, changed body habitus, or loading pattern of the joints. An alternative would be to compare absolute values to a reference standard. However, standardized reference values do not yet exist.
We are not aware of any published studies that have evaluated knees after isolated FCDs not undergoing cartilage repair. However, Årøen et al. (2016) studied cartilage defects in knees with dGEMRIC after initial arthroscopy, and before cartilage surgery. The patients had an average duration of symptoms of 4 years, and 8 of 26 had previously had cartilage repair. The authors found no substantial degeneration of the impacted condyle compared to the opposite knee, which is in line with the results of our study. We also found an almost statistically significant difference for the posterior ROI when the defect was located on the MFC.
When all T2 values were pooled together, the histogram had a near bell-shaped curve. The mean value was 50 ms (SD 10, range 28–82). The overall T2 values were higher than the reference values from Joseph et al. (Citation2015). They seem, however, to overlap with the results of an asymptomatic cohort study (Joseph et al. Citation2011). We performed a simple t-test with 40 as the test value (Table 6, see Suplementary data). All locations, except from the anterior LFC, had statistically significantly higher values. No T2 results were obtained from the uninjured knee. We therefore compared the injured condyle with the corresponding condyle in patients with defects located on the opposite condyle, and found no significant differences. The T2 values in our study appear to be associated with OA.
The T2 values must, however, be interpreted with caution. Reproducibility of T2 value measurements between centers and time points has still not been established. The values may be influenced by different factors such as MRI scanners (within and across manufacturers), coils (Chang et al. Citation2012), diverse magnetic field strength, and by joint or cartilage loading status at the time of T2 measurement. Like Wei et al. (Citation2015), we found no correlation between dGEMRIC and T2 values. This inconsistency might be due to magic angle effect, as demonstrated previously by Mosher et al. (Citation2001).
Outliers
3 patients had clinically relevant lower dGEMRIC scores in their contralateral knee. This does not correspond to previous findings where low dGEMRIC in knees was associated with an increased risk of OA. We have assessed these patients individually. 1 of them had an earlier meniscal resection, while the other 2 had no known injury to the contralateral knee. When we removed these 3 patients from the analyses, there were still no group differences when comparing injured and uninjured knees.
Strengths and weaknesses
The long-term follow-up of the patients is a strength with MRI examination performed at an average of 12 years from baseline. An obvious weakness was the small number of patients. Previous studies have shown a low variability in T1(Gd) and the number of patients needed to detect statistically and clinically significant differences may be as low as 15–20 subjects (Neuman et al. Citation2011). These analyses have great variance, both between subjects and within the knee joint (Neuman et al. Citation2011). Repeated measures reduce the variance and are helpful, but are expensive. Using the contralateral knee as a control also reduces the number of patients required. Our radiological protocol takes 3 hours per patient. This, in addition to the financial costs, makes studies on larger patient groups difficult to perform.
Another weakness was the heterogeneity of the patients, and that they were recruited from 2 different clinical studies. We did not have all the clinical scores at all time points. However, the main purpose of the study was the extended MRI investigations, with clinical scores serving as supplementary information. The 2 sub-cohorts of patients were of almost equal size, with 11 subjects in the group with untreated or debrided defects and 10 in the group with defects treated with cartilage repair. We did not find any significant differences in age, sex distribution, or depth of the lesion between unoperated/debrided and operated patients. Symptoms may have differed between patients, although there was no statistically significant difference in VAS at baseline (p = 0.5). The median baseline size for the unoperated/debrided group was 3.5 cm2, and it was 5.0 cm2 for the operated group. There were more lesions with size over 2 cm2 in the operated group, and similar numbers of lesions with size over 4 cm2. There is a common distinction at 2 cm2, as a cutoff for surgical treatment. The difference concerning size might still be of clinical significance, as some clinical guidelines operate with a cutoff of 4 cm2.
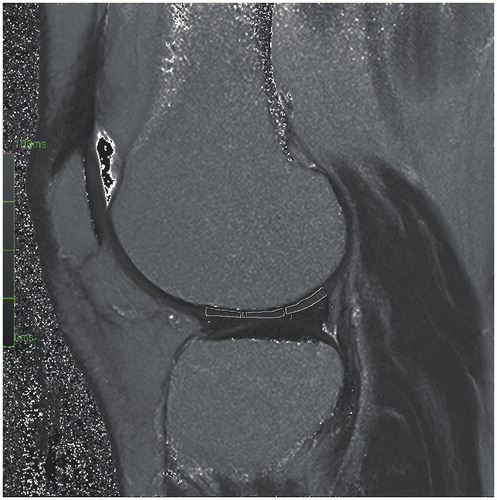
A potential source of bias in this study was the manual drawing of the ROIs. Automated drawing is possible, but previous studies have shown low intra- and interobserver reliability when large and standardized ROIs are used (Tiderius et al. Citation2004). The ROIs were drawn manually in a standardized fashion, where the anterior ROI stretched from the end of the anterior horn of the menisci to the anterior border of the tibia plateau. The central ROI included the posterior part of the area between the anterior and posterior menisci, whereas the posterior ROI spanned from the end of the posterior horn of the menisci to the posterior border of the tibial plateau (). Previous studies have found an intraclass correlation coefficient (ICC) for measurement of dGEMRIC index with manually drawn ROIs of 0.9 (Hingsammer et al. Citation2013). The ICC of the dGEMRIC readings from another study by the same research group was 0.882 (Aroen et al. Citation2016). The substantial degree of degenerative changes, as well as previous meniscal injuries, within this patient cohort may have challenged the placement of the anterior border of the anterior ROI and the posterior border of the posterior ROI, due to possible meniscal extrusions. This was accounted for during the drawing, when evident.
Figure 4. The drawing of the ROIs, represented here by the LFC (with T2).
We did not perform volume estimations and can therefore not evaluate our findings in relation to cartilage thickness. However, the ROIs were standardized with height ranging from 0.7 mm to 1.6 mm in the central ROI and length ranging from 8 mm to 16 mm. In the cases with severely thin cartilage, the T1(Gd) was not measured. We did not perform analyses regarding correlation between T1(Gd) and T2 on the one hand and height of the ROIs on the other. This is a source of error, because it has been shown that thin cartilage will have a lower T1(Gd) due to facilitated diffusion of the contrast medium (Hawezi et al. Citation2011).
It has been shown that differences in BMI will affect T1(Gd) due to different distribution volumes in lean and obese patients (Tiderius et al. Citation2006). In the present study, there was a large variation in BMI at baseline, but even so 16 had BMI values near the range classified as normal weight. We therefore chose not to use the correction factor suggested by Tiderius et al. There were 2 obese patients in our study, with a BMI of 37 and 40 at baseline. The T1(Gd) was within the normal range (except for low T1(Gd) in both medial posterior ROIs of 1 patient), and there were no differences between injured and uninjured knees.
In summary, we found no increase in degenerative changes 12 years after the diagnosis of an FCD, as measured with dGEMRIC. The natural history of untreated/debrided FCDs and of FCDs treated with MF or ACI shows large variations. The dGEMRIC values for defects on the MFC in the posterior sagittal plane tend to be lower than in the uninjured knee. Consequently, these FCDs can more easily be followed with dGEMRIC. However, in this study, radiographic OA changes did not correlate with cartilage quality, as assessed with dGEMRIC.
Supplementary data
Tables 5 and 6 are available online at: http://dx.doi.org/10.1080/17453674.2016.1255484.
LE and AÅ conceived the study and all the authors planned the method. CNE collected data and performed the analyses, whereas all authors and especially CH interpreted the dGEMRIC and T2 results. CNE and SL drafted the manuscript, and AÅ, CH, and LE revised it.
We thank Ingar Holme for his advice concerning relevant statistics. We also thank Helga Brøgger for performing the calculations of dGEMRIC and T2.
No competing interests declared.
The study was supported by grants from the Oslo Sports Trauma Research Center (OSTRC), where the first author is employed, and from Sophies Minde AS. The OSTRC is financed by the South-Eastern Norway Regional Health Authority, the Royal Norwegian Ministry of Education and Research, the Norwegian Olympic Committee, the Confederation of Sport, and Norsk Tipping. The work was also supported by the Faculty of Medicine, University of Oslo (UiO). Cathrine N. Engen previously attended the Medical Student Research Program and thereby received financial support from the Research Council of Norway.
IORT_A_1255484_O_Supplementary_data.pdf
Download PDF (23.5 KB)Related Research Data
- Aroen A, Loken S, Heir S, Alvik E, Ekeland A, Granlund O G, Engebretsen L. Articular cartilage lesions in 993 consecutive knee arthroscopies. Am J Sports Med 2004; 32(1): 211–215.
- Aroen A, Brogger H, Rotterud J H, Sivertsen E A, Engebretsen L, Risberg M A. Evaluation of focal cartilage lesions of the knee using MRI T2 mapping and delayed Gadolinium Enhanced MRI of Cartilage (dGEMRIC). BMC Musculoskelet Disord 2016; 17(1): 73.
- Bredella M A, Tirman P F, Peterfy C G, Zarlingo M, Feller J F, Bost F W, Belzer J P, Wischer T K, Genant H K. Accuracy of T2-weighted fast spin-echo MR imaging with fat saturation in detecting cartilage defects in the knee: comparison with arthroscopy in 130 patients. AJR Am J Roentgenol 1999; 172(4): 1073–80.
- Burstein D, Velyvis J, Scott K T, Stock K W, Kim Y J, Jaramillo D, Boutin R D, Gray M L. Protocol issues for delayed Gd(DTPA)(2-)-enhanced MRI (dGEMRIC) for clinical evaluation of articular cartilage. Magn Reson Med 2001; 45(1): 36–41.
- Chang G, Wiggins G C, Xia D, Lattanzi R, Madelin G, Raya J G, Finnerty M, Fujita H, Recht M P, Regatte R R. Comparison of a 28-channel receive array coil and quadrature volume coil for morphologic imaging and T2 mapping of knee cartilage at 7T. J Magn Reson Imaging 2012; 35(2): 441–8.
- Cunningham T, Jessel R, Zurakowski D, Millis M B, Kim Y J. Delayed gadolinium-enhanced magnetic resonance imaging of cartilage to predict early failure of Bernese periacetabular osteotomy for hip dysplasia. J Bone Joint Surg Am 2006; 88(7): 1540–8.
- Ding C, Cicuttini F, Scott F, Cooley H, Boon C, Jones G. Natural history of knee cartilage defects and factors affecting change. Arch Intern Med 2006; 166(6): 651–8.
- Friemert B, Oberlander Y, Schwarz W, Haberle H J, Bahren W, Gerngross H, Danz B. Diagnosis of chondral lesions of the knee joint: can MRI replace arthroscopy? A prospective study. Knee Surg Sports Traumatol Arthrosc 2004; 12(1): 58–64.
- Hawezi Z K, Lammentausta E, Svensson J, Dahlberg L E, Tiderius C J. In vivo transport of Gd-DTPA(2-) in human knee cartilage assessed by depth-wise dGEMRIC analysis. J Magn Reson Imaging 2011; 34(6): 1352–8.
- Hingsammer A, Chan J, Kalish L A, Mamisch T C, Kim Y J. Is the damage of cartilage a global or localized phenomenon in hip dysplasia, measured by dGEMRIC? Clin Orthop Relat Res 2013; 471(1): 301–7.
- Hubbard M J. Articular debridement versus washout for degeneration of the medial femoral condyle. A five-year study. J Bone Joint Surg Br 1996; 78(2): 217–9.
- Joseph G B, Baum T, Carballido-Gamio J, Nardo L, Virayavanich W, Alizai H, Lynch J A, McCulloch C E, Majumdar S, Link T M. Texture analysis of cartilage T2 maps: individuals with risk factors for OA have higher and more heterogeneous knee cartilage MR T2 compared to normal controls–data from the osteoarthritis initiative. Arthritis Res Ther 2011; 13(5): R153.
- Joseph G B, McCulloch C E, Nevitt M C, Heilmeier U, Nardo L, Lynch J A, Liu F, Baum T, Link T M. A reference database of cartilage 3 T MRI T2 values in knees without diagnostic evidence of cartilage degeneration: data from the osteoarthritis initiative. Osteoarthritis Cartilage 2015; 23(6): 897–905.
- Knutsen G, Engebretsen L, Ludvigsen T C, Drogset J O, Grontvedt T, Solheim E, Strand T, Roberts S, Isaksen V, Johansen O. Autologous chondrocyte implantation compared with microfracture in the knee. A randomized trial. J Bone Joint Surg Am 2004; 86-A(3): 455–64.
- Knutsen G, Drogset J O, Engebretsen L, Grontvedt T, Ludvigsen T C, Loken S, Solheim E, Strand T, Johansen O. A Randomized Multicenter Trial Comparing Autologous Chondrocyte Implantation with Microfracture: Long-Term Follow-up at 14 to 15 Years. J Bone Joint Surg Am 2016; 98(16): 1332–9.
- Lefkoe T P, Trafton P G, Ehrlich M G, Walsh W R, Dennehy D T, Barrach H J, Akelman E. An experimental model of femoral condylar defect leading to osteoarthrosis. J Orthop Trauma 1993; 7(5): 458–67.
- Loken S, Heir S, Holme I, Engebretsen L, Aroen A. 6-year follow-up of 84 patients with cartilage defects in the knee. Knee scores improved but recovery was incomplete. Acta Orthop 2010; 81(5): 611–8.
- Messner K, Maletius W. The long-term prognosis for severe damage to weight-bearing cartilage in the knee: a 14-year clinical and radiographic follow-up in 28 young athletes. Acta Orthop Scand 1996; 67(2): 165–8.
- Mosher T J, Smith H, Dardzinski B J, Schmithorst V J, Smith M B. MR imaging and T2 mapping of femoral cartilage: in vivo determination of the magic angle effect. AJR Am J Roentgenol 2001; 177(3): 665–9.
- Neuman P, Tjornstrand J, Svensson J, Ragnarsson C, Roos H, Englund M, Tiderius C J, Dahlberg L E. Longitudinal assessment of femoral knee cartilage quality using contrast enhanced MRI (dGEMRIC) in patients with anterior cruciate ligament injury–comparison with asymptomatic volunteers. Osteoarthritis Cartilage 2011; 19(8): 977–83.
- Newberry W N, Mackenzie C D, Haut R C. Blunt impact causes changes in bone and cartilage in a regularly exercised animal model. J Orthop Res 1998; 16(3): 348–54.
- Niemeyer P, Porichis S, Steinwachs M, Erggelet C, Kreuz P C, Schmal H, Uhl M, Ghanem N, Sudkamp N P, Salzmann G. Long-term outcomes after first-generation autologous chondrocyte implantation for cartilage defects of the knee. Am J Sports Med 2014; 42(1): 150–7.
- Owman H, Ericsson Y B, Englund M, Tiderius C J, Tjornstrand J, Roos E M, Dahlberg L E. Association between delayed gadolinium-enhanced MRI of cartilage (dGEMRIC) and joint space narrowing and osteophytes: a cohort study in patients with partial meniscectomy with 11 years of follow-up. Osteoarthritis Cartilage 2014; 22(10): 1537–41.
- Spiers A S, Meagher T, Ostlere S J, Wilson D J, Dodd C A. Can MRI of the knee affect arthroscopic practice? A prospective study of 58 patients. J Bone Joint Surg Br 1993; 75(1): 49–52.
- Tiderius C J, Olsson L E, de V H, Leander P, Ekberg O, Dahlberg L. Gd-DTPA2)-enhanced MRI of femoral knee cartilage: a dose-response study in healthy volunteers. Magn Reson Med 2001; 46(6): 1067–71.
- Tiderius C J, Tjornstrand J, Akeson P, Sodersten K, Dahlberg L, Leander P. Delayed gadolinium-enhanced MRI of cartilage (dGEMRIC): intra- and interobserver variability in standardized drawing of regions of interest. Acta Radiol 2004; 45(6): 628–34.
- Tiderius C, Hori M, Williams A, Sharma L, Prasad P V, Finnell M, McKenzie C, Burstein D. dGEMRIC as a function of BMI. Osteoarthritis Cartilage 2006; 14(11): 1091–7.
- Ulstein S, Aroen A, Rotterud J H, Loken S, Engebretsen L, Heir S. Microfracture technique versus osteochondral autologous transplantation mosaicplasty in patients with articular chondral lesions of the knee: a prospective randomized trial with long-term follow-up. Knee Surg Sports Traumatol Arthrosc 2014; 22(6): 1207–1215.
- Wei B, Du X, Liu J, Mao F, Zhang X, Liu S, Xu Y, Zang F, Wang L. Associations between the properties of the cartilage matrix and findings from quantitative MRI in human osteoarthritic cartilage of the knee. Int J Clin Exp Pathol 2015; 8(4): 3928–36.
- Widuchowski W, Widuchowski J, Koczy B, Szyluk K. Untreated asymptomatic deep cartilage lesions associated with anterior cruciate ligament injury: results at 10- and 15-year follow-up. Am J Sports Med 2009; 37(4): 688–92.
- Wondrasch B, Aroen A, Rotterud J H, Hoysveen T, Bolstad K, Risberg M A. The feasibility of a 3-month active rehabilitation program for patients with knee full-thickness articular cartilage lesions: the Oslo Cartilage Active Rehabilitation and Education Study. J Orthop Sports Phys Ther 2013; 43(5): 310–24.
- Yoshioka H, Stevens K, Hargreaves B A, Steines D, Genovese M, Dillingham M F, Winalski C S, Lang P. Magnetic resonance imaging of articular cartilage of the knee: comparison between fat-suppressed three-dimensional SPGR imaging, fat-suppressed FSE imaging, and fat-suppressed three-dimensional DEFT imaging, and correlation with arthroscopy. J Magn Reson Imaging 2004; 20(5): 857–64.