
Abstract
Background and purpose — The lower extremity functional scale (LEFS) is a well-known and validated instrument for measurement of lower extremity function. The LEFS was developed in a group of patients with various musculoskeletal disorders, and no reference data for the healthy population are available. Here we provide normative data for the LEFS.
Methods — Healthy visitors and staff at 4 hospitals were requested to participate. A minimum of 250 volunteers had to be included at each hospital. Participants were excluded if they had undergone lower extremity surgery within 1 year of filling out the questionnaire, or were scheduled for lower extremity surgery. Normative values for the LEFS for the population as a whole were calculated. Furthermore, the influence of sex, age, type of employment, socioeconomic status, and history of lower extremity surgery on the LEFS were investigated.
Results — 1,014 individuals fulfilled the inclusion criteria and were included in the study. The median score for the LEFS for the whole population was 77 (out of a maximum of 80). Men and women had similar median scores (78 and 76, respectively), and younger individuals had better scores. Participants who were unfit for work had worse scores. There were no statistically significant correlations between socioeconomic status and type of employment on the one hand and LEFS score on the other. A history of lower extremity surgery was associated with a lower LEFS score.
Interpretation — High scores were observed for the LEFS throughout the whole population, although they did decrease with age. Men had a slightly higher score than women. There was no statistically significant correlation between socioeconomic status and LEFS score, but people who were unfit for work had a significantly worse LEFS score.
The lower extremity functional scale (LEFS) is a well-known and validated patient-rated outcome measure (PROM) that can be used to measure lower extremity function. It was developed in 1999 by Binkley et al. (Citation1999) in a group of patients with various musculoskeletal conditions. The score consists of 20 questions, which are subdivided into 4 groups. These groups consist of activities with increasing physical demands. Questions on activity vary from walking between rooms to running on uneven ground. The LEFS is used for measuring lower extremity function in a wide variety of disorders and treatments (Backes et al. Citation2015, Mahler et al. Citation2016, Rehman et al. Citation2016, Telles et al. Citation2016) In orthopedic (trauma) surgery, patients present with an existing disorder. This makes it impossible to assess pre-disease physical function, as questionnaires regarding pre-disorder physical functioning are affected by recall bias (Last Citation2008). For this reason, it is challenging for physicians to reliably measure the effect of their treatment regarding return to pre-disorder physical functioning. Normative data for PROMs can aid in this problem by acting as reference data for a healthy population. Normative data are available for a few PROMs (Aasheim and Finsen Citation2014, Schneider and Jurenitsch Citation2016). For the LEFS, however, no such data are available.
Therefore we provide normative data for the lower extremity function scale. In addition, we wanted to investigate the influence of sex, age, type of employment, socioeconomic status, and history of lower extremity surgery on the LEFS score.
Methods
Adult visitors to the outpatient clinic of the Department of Surgery and also staff at 4 different Dutch hospitals were asked to participate in this study. The 4 hospitals were located in different regions (both rural and urban) and consisted of 1 university hospital and 3 teaching hospitals. Since it was not possible to perform a prospective sample size calculation, we chose to include a minimum of 250 individuals at each hospital. We considered this to be a large enough population to be representative of the whole population. We constantly monitored the age and sex of the respondents in order to obtain comparable group sizes. As data collection took several days at each hospital, after each day we checked the numbers of men and women and the distribution across different age categories. When differences arose, specific sex and/or age groups were approached to participate in the day(s) that followed.
The study consisted of a short questionnaire in which the postal code, age (as a continuous variable and subdivided into 3 categories (18–39, 40–64, and over 64 years)), sex, and work status (student, working, retired, unemployed, unfit for work, or other) of the subjects were recorded. When participants were actively employed at the time of filling out the questionnaire, they were requested to report whether they considered their employment to be blue-, pink-, or white-collar (i.e. very physically demanding, moderately physically demanding, or not physically demanding). After this, they were asked whether they had a history of lower extremity surgery and—if this was the case—how long ago. In addition, they were asked whether they were currently scheduled for lower extremity surgery. Next, they were presented with the Dutch version of the lower extremity functional scale (LEFS) (Hoogeboom et al. Citation2012) The LEFS has 20 items in 4 categories. For each question, 0 to 4 points can be earned, so 80 points can be earned in total—indicating maximal lower extremity function (Binkley et al. Citation1999) The Dutch version of the LEFS has been validated using the SF-36 as a reference and proved to have good internal consistency, good reliability, and good construct and discriminant validity, while showing no floor or ceiling effects (Hoogeboom et al. Citation2012).
Individuals were excluded if they had had lower extremity surgery within 1 year of filling out the questionnaire. Participants who were scheduled for lower extremity surgery were also excluded. Missing data in the LEFS were treated according to the instructions of the developers of the questionnaire (Stratford et al. Citation2005). When questionnaires contained more than 4 missing answers, or 3 missing within 1 domain, they were excluded (Stratford et al. Citation2005).
We obtained data on socioeconomic status (SES) from the Netherlands Institute for Social Research (Sociaal Cultureel Planbureau). For all postal codes, a number is available that reflects the SES of that particular area. This figure ranges from −6.7 to +3.1, where 0 represents the average SES for the Netherlands.
Statistics
Normal distribution was assessed using histograms and plots. Continuous variables are presented as mean with standard deviation (SD) or median with interquartile range (IQR), as appropriate. Categorical variables are given as frequencies and percentages. Due to the non-parametric distribution, LEFS score is presented as median and IQR. The mean and SD are also provided, to show the variability of the whole population and to allow comparison with other studies. The Mann-Whitney U-test and Kruskal-Wallis test were used to check for differences in non-parametric outcome variables. Spearman’s rho was used to investigate correlations between the LEFS score and age, and LEFS score and SES. All analyses were performed using SPSS version 23).
For this study, the need to obtain informed consent was waived by the local Medical Ethics Committee.
Results
Demographics ()
The questionnaire was filled out by 1,155 individuals. Of these, 141 participants had to be excluded because they had a history of lower extremity surgery or because they were scheduled for lower extremity surgery (n = 62), or because there was too much missing data that could not be imputed (n = 79). For 9 questionnaires, there were no more than 4 questions missing (or 3 within one domain). These missing values were imputed according to the method of the developers of the questionnaire (Stratford et al. Citation2005).
Sex-specific median LEFS scores for each age category.
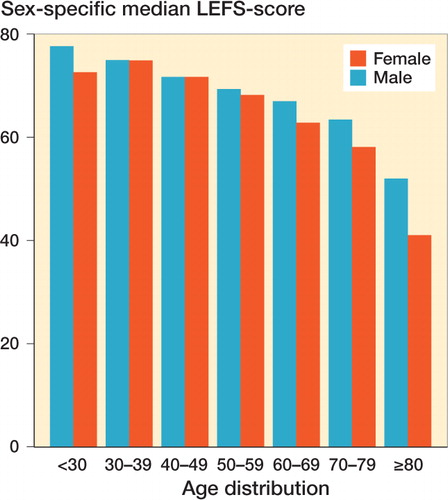
Table 1. Demographic data. Values are n (%) unless otherwise stated
LEFS scores
Median LEFS score for the population was 77 (IQR: 63–80, range: 4.5–80) (). None of the participants scored zero points, and 383 individuals (38%) achieved the maximum score of 80 points. The LEFS score showed a statistically significant correlation with age (correlation coefficient: −0.357; p < 0.001) (Figure), but not with SES (correlation coefficient: 0.017; p = 0.6). Men had a statistically significant better score than women. Volunteers who were unfit for work had worse LEFS scores than participants with other daily activities (p < 0.001). The level of physical demand of employment was not statistically significantly related to LEFS score. Individuals with a history of lower extremity surgery generally had a worse LEFS score than individuals with no history of lower extremity surgery (p < 0.001) ().
Table 2. LEFS scores related to percentiles
Table 3. Subgroups. LEFS score values are median [IQR] (range)
Discussion
In healthcare studies, outcomes are often measured through patient-rated outcome measures (PROMs). These outcome measures are, however, often determined in patients rather than in healthy volunteers (Olerud and Molander Citation1984, MacDermid Citation1996, Binkley et al. Citation1999). This means that it is unknown what normal scores for a healthy individual should be. Earlier research has shown that a healthy population does not necessarily score a maximum amount of points on a PROM (Schneider and Jurenitsch 2016). The latter study showed that mean score for the foot function index (FFI) was 10 (out of 100 points, where 0 points means no foot disability), and only one-third of the respondents achieved the maximum score of 0 points. These figures indicate that it is of importance to be aware of the normative data of a PROM. Presenting the results of a study in the light of normative values is far more informative than presenting outcome scores alone.
Several studies have used the LEFS to evaluate treatment effect. For example, a study by Pinsker et al. (Citation2015) used the LEFS to compare the effects of ankle arthrodesis and ankle arthroplasty. They found a median score of 44 for both ankle arthrodesis and ankle arthroplasty, which was considerably lower than in a healthy population. Demetracopoulos et al. (Citation2014) evaluated the effect of peroneal tendon repair using the LEFS. They found a mean LEFS score of 71, indicating a good result of their treatment.
When less than 15% of the individuals have the minimum score, no floor effect is present, and when less than 15% reach the maximum score, there is no ceiling effect (McHorney and Tarlov Citation1995). The absence of any floor and/or ceiling is beneficial, as it enables researchers to differentiate better between patients at the low and high ends of a scoring system (Schepers et al. Citation2008). In the present study, none of the participants scored 0 points, but almost 40% of the participants scored the maximum amount of points—indicating that there was a ceiling effect. This contrasts with an earlier study by Hoogeboom et al. (Citation2012) who found no ceiling effect while evaluating the LEFS. This difference is easily explained by the fact that we only included "healthy" volunteers while Hoogeboom et al. included patients with hip and/or knee osteoarthritis. In addition, since the LEFS was designed for use in individuals with lower extremity conditions, the fact that a ceiling effect was found for healthy individuals is notable, but it should not limit the validity of the test in the population that it was designed for.
As expected, the LEFS score showed a negative correlation with age; i.e. lower extremity function decreases with increasing age. We observed a gradual decrease in function from the age of 50. This finding is of importance for future studies, as the results for a population as a whole should be interpreted with care. It would be more appropriate to do a separate analysis of the results for different age categories, particularly young patients and elderly patients.
Men had a statistically significantly better LEFS score than women; however, the difference was only 2 points. This is not clinically relevant, as the minimum clinically important difference in the LEFS ranges between 9 and 12 points (Binkley et al. Citation1999, McCormack et al. Citation2015). Furthermore, we found that participants who were unfit for work had significantly worse scores. Compared to the working population, this difference was of clinical importance (29 points). Lower socioeconomic status has repeatedly been correlated to poorer health and lower quality of life (Pickett and Pearl Citation2001, Clement and Court-Brown Citation2014, Kristensen et al. Citation2016). However, we failed to detect any such significant correlation between SES and LEFS score—indicating that the influence of SES on the LEFS score in a normal population is very small. This contrasts with the results of various other studies in which it was found that lower SES had a negative influence on outcome following treatment for proximal and distal radius fractures, humeral fractures, and hip fractures (Chung et al. Citation2007, Duckworth et al. Citation2012, Clement et al. Citation2014, Paksima et al. Citation2014, Orive et al. Citation2016). This suggests that function may be independent of SES in a normal population, but in posttraumatic patients SES may negatively influence (treatment) outcome. We know no other study relating socioeconomic status to the results of lower extremity or foot/ankle questionnaires.
A possible weakness of our study was that our sample was not representative of the population as a whole. However, we tried to balance the numbers of females and males. Furthermore, we constantly monitored the distribution of the responses in the different age categories. When necessary, we requested that more males than females (or vice versa) should fill out the questionnaire, and we did the same for the 3 age categories used. For other subpopulations (e.g. SES and heaviness of employment), this was unfortunately not possible and may have biased our results. We do feel, however, that with our study population of over 1,000 individuals, we were able to make an accurate estimate of normative values for the LEFS—especially as we had individuals from different regions and different types of hospitals. Using the results of the present study will help researchers to interpret their data and physicians to set goals for treatment results.
Conclusion
High scores were observed for the LEFS throughout the whole population, although it did decrease with age. Men had a slightly higher score than women. There was no statistically correlation between socioeconomic status and LEFS score, but people who were unfit for work had significantly poorer LEFS scores.
Design of the paper: SD, MM, and TS. Data acquisition and analysis: SD, SK, MM, JW, and NS. Interpretation of the data: SD, SK, MM, CG, and TS. Drafting of the work: SD, SK, and MM. Critical revision of the work: SD, SK, MM, JW, NS, CG, and TS.
No competing interests declared.
- Aasheim T, Finsen V. The DASH and the QuickDASH instruments. Normative values in the general population in Norway. J Hand Surg Eur Vol 2014; 39(2): 140–4.
- Backes M, Dingemans S A, Schep N W, Bloemers F W, Van Dijkman B, Garssen F P, et al. Wound infections following implant removal below the knee: the effect of antibiotic prophylaxis; the WIFI-trial, a multi-centre randomized controlled trial. BMC Surg 2015; 15(1): 12.
- Binkley J M, Stratford P W, Lott S A, Riddle D L. The Lower Extremity Functional Scale (LEFS): scale development, measurement properties, and clinical application. North American Orthopaedic Rehabilitation Research Network. Phys Ther 1999; 79(4): 371–83.
- Chung K C, Kotsis S V, Kim H M. Predictors of functional outcomes after surgical treatment of distal radius fractures. J Hand Surg Am 2007; 32(1): 76–83.
- Clement N D, Court-Brown C M. Elderly pelvic fractures: the incidence is increasing and patient demographics can be used to predict the outcome. Eur J Orthop Surg Traumatol 2014; 24(8): 1431–7.
- Clement N D, McQueen M M, Court-Brown C M. Social deprivation influences the epidemiology and outcome of proximal humeral fractures in adults for a defined urban population of Scotland. Eur J Orthop Surg Traumatol 2014; 24(7): 1039–46.
- Demetracopoulos C A, Vineyard J C, Kiesau C D, Nunley J A. Long-term results of debridement and primary repair of peroneal tendon tears. Foot Ankle Int 2014; 35(3): 252–7.
- Duckworth A D, Clement N D, Jenkins P J, Will E M, Court-Brown C M, McQueen M M. Socioeconomic deprivation predicts outcome following radial head and neck fractures. Injury 2012; 43(7): 1102–6.
- Hoogeboom T J, de Bie R A, den Broeder A A, van den Ende C H. The Dutch Lower Extremity Functional Scale was highly reliable, valid and responsive in individuals with hip/knee osteoarthritis: a validation study. BMC Musculoskelet Disord 2012; 13(1): 117.
- Kristensen P K, Thillemann T M, Pedersen A B, Søballe K, Johnsen S P. Socioeconomic inequality in clinical outcome among hip fracture patients: a nationwide cohort study. Osteoporos Int 2016 [Epub ahead of print]
- Last J M. A Dictionary of Epidemiology. 6 ed. Oxford University Press; 2008.
- MacDermid J C. Development of a scale for patient rating of wrist pain and disability. J Hand Ther 1996: 9(2): 178–83.
- Mahler E, Cuperus N, Bijlsma J, Vliet Vlieland T, van den Hoogen F, den Broeder A, et al. Responsiveness of four patient-reported outcome measures to assess physical function in patients with knee osteoarthritis. Scand J Rheumatol 2016; 45(6): 518–27.
- McCormack J, Underwood F, Slaven E, Cappaert T. The minimum clinically important difference on the VISA-A and LEFS for patient with insertional Achilles tendinopathy. Int J Sports Phys Ther 2015; 10(5): 639–44.
- McHorney C A, Tarlov A R. Individual-patient monitoring in clinical practice: are available health status surveys adequate? Qual Life Res 1995; 4(4): 293–307.
- Olerud C, Molander H. A scoring scale for symptom evaluation after ankle fracture. Arch Orthop Trauma Surg 1984; 103(3): 190–4.
- Orive M, Anton-Ladislao A, García-Gutiérrez S, Las Hayas C, González N, Zabala J, et al. Prospective study of predictive factors of changes in pain and hip function after hip fracture among the elderly. Osteoporos Int 2016; 27(2): 527–36.
- Paksima N, Pahk B, Romo S, Egol KA. The association of education level on outcome after distal radius fracture. HAND 2014; 9(1): 75–9.
- Pickett K E, Pearl M. Multilevel analyses of neighbourhood socioeconomic context and health outcomes: a critical review. J Epidemiol Community Health 2001; 55(2): 111–22.
- Pinsker E, Inrig T, Daniels T R, Warmington K, Beaton D E. Reliability and validity of 6 measures of pain, function, and disability for ankle arthroplasty and arthrodesis. Foot Ankle Int 2015; 36(6): 617–25.
- Rehman Z U, Sophie Z, Mal L. Functional outcomes after successful lower extremity arterial injuries repair. J Pak Med Assoc 2016; 10(oct;66): 134–6.
- Schepers T, Heetveld M J, Mulder P G H, Patka P. Clinical outcome scoring of intra-articular calcaneal fractures. J Foot Ankle Surg 2008; 47(3): 213–8.
- Schneider W, Jurenitsch S. Age- and sex-related normative data for the foot function index in a German-speaking cohort. Foot Ankle Int 2016a; 37(11): 1238–42.
- Stratford P, Hart D, Binkley J, Kennedy D, Alcock G, Hanna S. Interpreting lower extremity functional status scores. Physiother Can 2005; (57): 154–62.
- Telles G, Cristovão D R, Belache F A T C, Santos M R A, Almeida R S de, Nogueira L A C. The effect of adding myofascial techniques to an exercise programme for patients with anterior knee pain. J Body Mov Ther 2016; 20(4): 844–50.