
Abstract
Background and purpose — Fracture non-union remains a major clinical problem, yet there are no data available regarding the overall risk of fractures progressing to non-union in a large population. We investigated the rate of non-union per fracture in a large adult population.
Methods — National data collected prospectively over a 5-year period and involving just under 5,000 non-unions were analyzed and compared to the incidence of fracture in the same period.
Results and interpretation — The overall risk of non-union per fracture was 1.9%, which is considerably less than previously believed. However, for certain fractures in specific age groups the risk of non-union rose to 9%. As expected, these higher rates of non-union were observed with tibial and clavicular fractures, but—less expectedly—it was in the young and middle-aged adults rather than in the older and elderly population. This study is the first to examine fracture non-union rates in a large population according to age and site, and provides more robust (and lower) estimates of non-union risk than those that are frequently quoted.
Non-union can be a devastating complication of long bone fracture. It can take several years for the treatment to be successful, and it may result in permanent disability. In the UK, it has been estimated to cost between £7,000 and £79,000 to treat a single case (approximately €8,000 to €91,000) (Patil and Montgomery Citation2006, Dahabreh et al. Citation2007, Kanakaris et al. Citation2007, Dahabreh et al. Citation2009).
We have previously reported the total number of non-unions in Scotland, and found this to be less than 20 per 100,000 population (Mills et al. Citation2012). There are no published data on the overall risk of non-union per fracture in a large adult population, except estimates based on small numbers regarding the non-union rate for some fracture patterns (Tzioupis and Giannoudis Citation2007). In this study, we investigated the relative risk of symptomatic long bone fracture non-union in a large adult population.
Methods
To derive the fraction of a particular fracture progressing to non-union, data are required both for the numerator, i.e. the number of non-unions, and for the denominator, i.e. the corresponding number of fractures.
Numerator data—fracture non-unions
The number of fracture non-unions occurring in Scotland over the 5-year period April 1, 2005 to March 31, 2010 and affecting patients aged 15 years or more was obtained from the NHS Scotland Information Services Division (ISD). Every inpatient admission in Scotland is coded on discharge by ISD for diagnosis using the ICD-10 classification. The data are collected centrally by the ISD and stratified according to patient age, sex, diagnosis (e.g. fracture non-union), and anatomical location. As almost all symptomatic non-unions are treated operatively, the ISD inpatient data provide an appropriate surrogate marker of the actual non-union numbers by fracture site and patient age. The accuracy of the ISD coding was cross-checked by review of the code given to 100 patients who were treated for non-union in Lothian, Scotland, within the time frame of the study, and was found to be 97%.
Denominator data—adult fractures in Scotland
The ISD dataset was unsuitable for establishing the total number of fractures during the study period, as it only consisted of inpatient data—and the majority of patients with fractures are treated as outpatients. To obtain an accurate estimate of adult fracture numbers, we used fracture incidence data from a prospectively collected database in NHS Lothian, the second largest health board in Scotland. The ISD fracture data, which are available by individual health board and hospital, showed that the distribution of fractures in the NHS Lothian population in terms of sex, age, and anatomical site was a good epidemiological representation of the rest of Scotland, making it a suitable database. Complete data on 6,800 fractures occurring in the Lothian catchment area with a population of 545,000 (10% of the Scottish population) were collected over a 12-month period within the 5-year study period (Aitken Citation2013).
Data handling
The anatomical descriptions of the ISD non-union data were constrained by the ICD-10 classification format, which has limited anatomical subsets. For example, non-unions of the foot are grouped together with non-unions of the ankle, as are those of the femur and the pelvis and the clavicle and scapula. For comparison, the acute fractures had to be arranged into the same anatomical subsets.
Due to the rare nature of a scapula non-union and the relatively high frequency of clavicle non-union, we calculated the upper and lower incidence of clavicle non-union per fracture by using the same non-union figures but using 2 different denominators—clavicle and scapula fractures combined and clavicle fractures alone. “Site unspecified” and “no additional” detail were codes used by ISD when the site of the non-union was unclear or not included within the ICD-10 codes; this occurred in 5% of cases.
Statistics
We were able to obtain the total number of fracture non-unions in the population of interest, and did not use a smaller sample, so inferential statistical analysis was not used for numerator data. In contrast, our fracture incidence data were taken from a smaller representative regional sample (Lothian), rather than from the whole of Scotland, so 95% confidence intervals were estimated using the cumulative Poisson distribution. The frequency of fracture non-union was calculated as the number of non-unions identified per 1,000 fractures sustained in the Scottish population.
Results
Over a 5-year period (April 1, 2005 to March 31, 2010) there were 4,895 non-union patients of all ages treated in Scotland (total population: 5.2 million). With children removed, the number fell to 4,715, with 57% occurring in males and 43% in females (adult population: 4.3 million). The overall number of non-unions peaked in the 35- to 44-year age bracket. According to sex, the non-union number (and incidence) peaked in men aged 25–34 years and in women aged 65–74 years. Almost 25% of all non-unions occurred in the forearm. illustrates the demographics of the total 5-year symptomatic non-union numbers by distribution of age and sex, and by age and anatomical location.
Figure 1. Total number of non-unions treated over a 5-year period in Scotland.
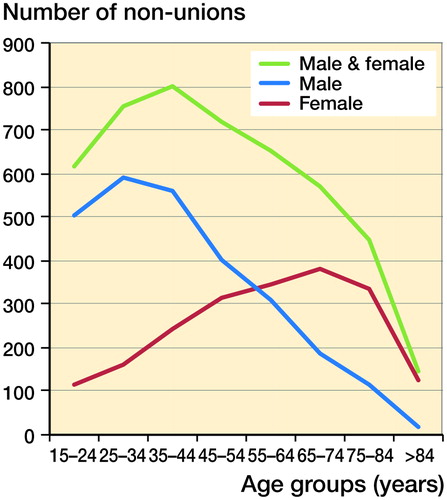
Table 1. Total numbers of non-union patients in Scotland over 5 years between 2005 and 2010 according to age and ISD-10 anatomical non-union site
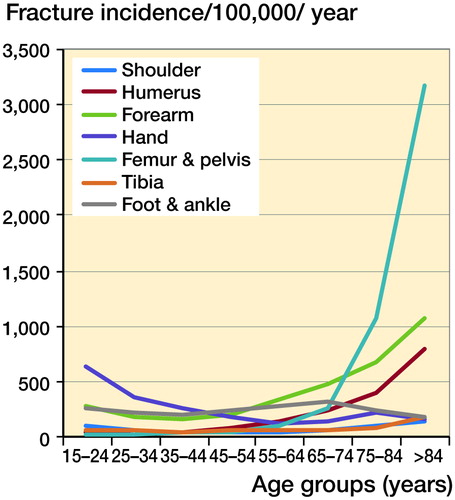
The overall fracture incidence in men and women was similar (11.6 per 1,000 population per year), but with an age distribution that was bimodal in males and unimodal in females. Forearm and hand had the highest overall fracture incidence, at 3 per 1,000 population per year, but the femur/pelvis was by far the commonest site in a single age group (75 years and over), at 32 per 1,000 per year. and show the fracture incidence by age, sex, and anatomical distribution.
Figure 2. Incidence of fractures per 100,000 population, according to sex.
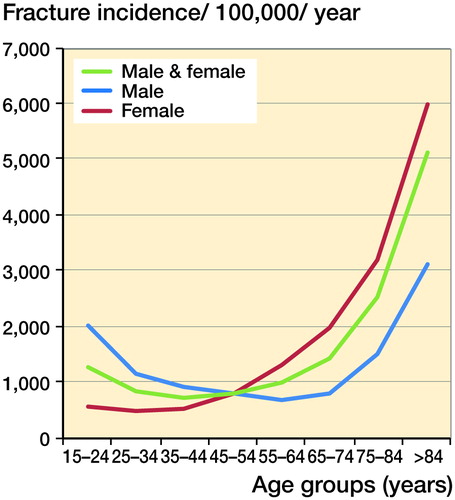
Figure 3. Incidence of fractures per 100, 000 population, according to ISD-10 anatomical distribution.
The overall rate of non-union per fracture in adults was 1.9%: 1.5% in women and 2.3% in men. The lower leg had the highest incidence of non-union in 6 of the 8 age groups. In every anatomical group, the risk of non-union per fracture peaked in early adulthood and fell with increasing age. and and show the rate of non-union per 1,000 fractures by age, sex, and anatomical distribution.
Figure 4. Incidence of non-union per 1,000 fractures per annum, according to sex.
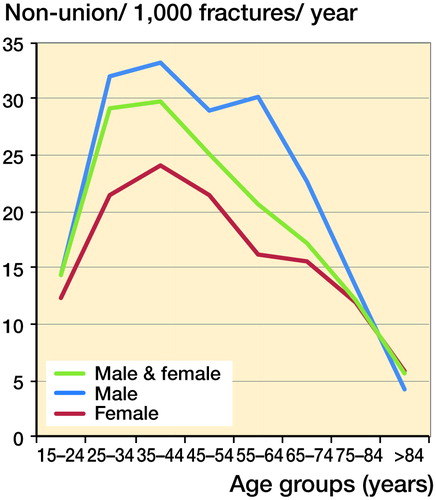
Figure 5. Incidence of non-union per 1,000 fractures, according to ISD-10 anatomical distribution.
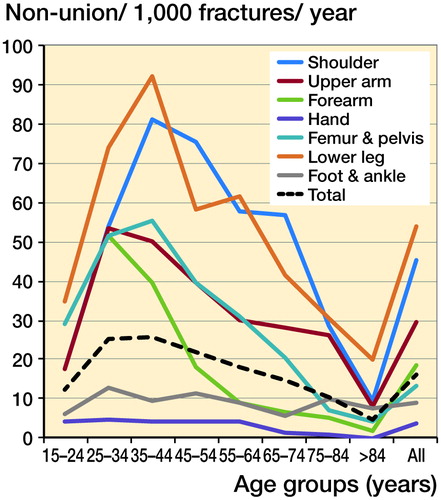
Table 2. Frequency of non-union per 1,000 fractures, according to distribution of age and sex
The long bones all had a similar pattern of non-union, with a sharp increase between 15 and 34 years, peaking between 25 and 44 years, and then steadily declining to the lowest level of risk in the ≥85-year age group. In the hand, foot, and ankle, the probability of non-union per fracture remained consistently low in all the age groups—at around 1% or less.
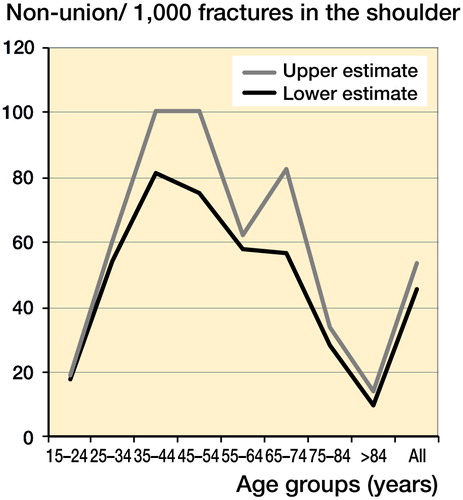
Unlike the fracture data, it was not possible to separate the non-union data for the scapula and clavicle. Clavicle fractures are relatively common whereas scapular fractures are not. For this reason, the rate of non-union per fracture for the shoulder was calculated in 2 ways: the shoulder non-union numbers were divided firstly by the combination of both clavicle and scapula fractures and secondly by the clavicle fractures as the sole denominator (). As scapula non-unions are extremely rare, the higher second calculation would be expected to be a closer estimate of the true rate of clavicle non-union. However, the variation between the 2 calculations in most age groups was small; at its maximum difference the higher rate was 1 in 40 non-unions per fracture greater than the lower rate. These results are shown in . (For consistency, the lower non-union incidence has been used in ).
Figure 6. Upper and lower estimates of clavicle non-union per fracture.
8% of fracture patients had multiple fractures, but only 12 of the 4,715 patients (0.25%) sustained multiple non-unions.
Discussion
In this study, we used data on almost 5,000 symptomatic non-unions to assess the risk of fractures progressing to non-union in patients of different ages, and in different bones. A search of the English language literature indicated that there had been no other population studies on the incidence of non-union per fracture other than in children (Mills et al. Citation2013).
The overall rate of non-union was 1.9% per fracture, yet there is a commonly held belief that the rate is 3–5 times higher. For a few specific groups, the rate was over 5%—e.g. in the 35- to 44-year age group with clavicle/scapula fracture, it was 8.1% compared to 4.5% for all clavicle/scapula fracture age groups. However, of the 56 site-/age-specific groups only 1 in 7 had a risk of non-union per fracture that exceeded 5%. The assertion that fractures carry an overall risk of non-union of 5–10% does not arise from any clear data or previous study, despite being quoted in many scientific papers—over 25 publications at a recent count. These papers cited as their source of information a book of musculoskeletal epidemiology (Praemer et al. Citation1992, Citation1999) or a review article that focused on the role of growth factors and other healing enhancement modalities (Einhorn Citation1995), which itself cited the epidemiology book (Praemer et al. Citation1992). Neither of these sources had any data regarding fracture non-union epidemiology. 20 publications that have cited 1 or both of these sources of information are listed in Table 3 (see Supplementary data).
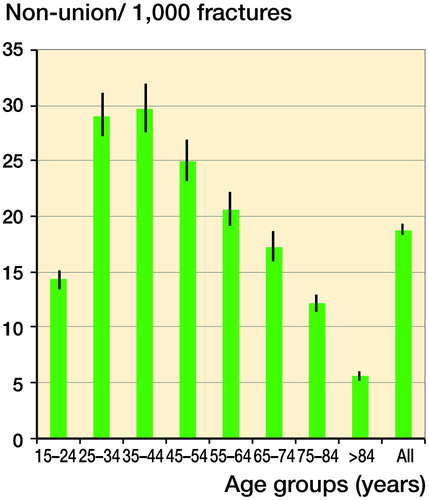
Although the number of fractures increased with age, the number of non-unions did not. The non-union rate per fracture was highest in the 30- to 44-year age group, 20 times greater than that in the 0- to 14-year-olds (Mills and Simpson Citation2013) and 2.5 times higher that in those aged ≥75. illustrates, with narrow 95% confidence intervals, the steady drop in incidence of non-union per fracture with increasing age.
Figure 7. Incidence of non-union per 1,000 fractures, by age distribution, showing 95% confidence intervals.
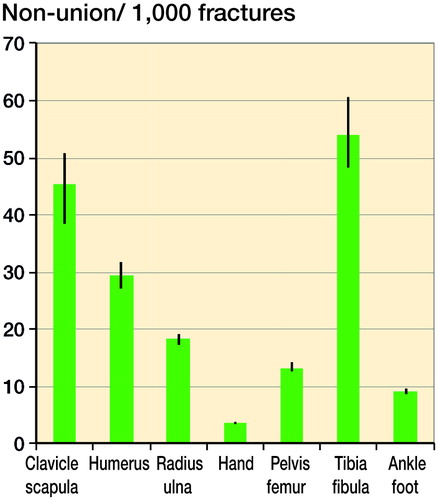
Anatomically, the highest risk of non-union was in the lower leg (tibia/fibula). The non-unions in the lower leg peaked in the 30- to 44-year age group. Unfortunately, non-unions of the tibia and fibula could not be differentiated from each other, but fractures of the fibula made up 12% of the tibia/fibula fracture cohort (Aitken Citation2013) and it has been reported that the risk of fibula non-union is around 0.3–5.4% (Bhadra et al. Citation2012). Thus, our rate of non-union in the lower leg may be a slight underestimate of the true risk of tibial non-union. If the fibula fractures are removed from the denominator, the estimate for the upper limit of tibial non-union would be 7.5%. Our finding of 5.4% (range across all age groups: 2.0–9.2%) for tibial (lower leg) non-union is at the conservative end of previous estimates (based on small case series), which have ranged from 1% for closed tibial fractures to 26% for open tibial fractures with extensive soft tissue injury (Court-Brown et al. Citation2006, Tzioupis and Giannoudis Citation2007). shows the narrow 95% confidence intervals for the anatomical distribution.
Figure 8. Incidence of non-union per 1,000 fractures, according to anatomical distribution, showing 95% confidence intervals.
Previous publications have given figures for forearm diaphyseal fracture non-unions ranging from 0% to 7.4% (Court-Brown Citation2006), slightly higher than our average of 1.8% (range: 0.2–5.2%). Although scapula non-unions are very rare, there have been a few published case studies (Marek et al. Citation2009, Robinson et al. Citation2012). Given the relative frequency of clavicle non-union, we calculated the incidence of clavicle non-union using the combined scapula/clavicle non-union number and one of 2 fracture denominators—just the clavicle fracture numbers alone, or a combination of scapula and clavicle fractures (). This provided an upper (5.4%) and lower (4.5%) estimate of the incidence of non-union per fracture for the clavicle. The publications of other smaller series have given figures of 1–5% (Robinson Citation1998, Nowak et al. Citation2000) for clavicle non-union, comparable with ours.
The rate of femoral/pelvic non-union was highest in the 35- to 44-year age group but was still relatively low at 5.5%. This may be an underestimation, as coding does not differentiate pelvic non-unions from femoral non-unions. The pelvic fractures (including those of the pubic rami) accounted for 12% of the pelvic/femoral fracture denominator, but may not have accounted for 12% of the non-unions. The reason for a higher rate of non-union in the younger age groups may be the choice of treatment—as intracapsular femoral neck fractures in younger patients, where possible, are stabilized with internal fixation whereas older patients are more likely to have an arthroplasty procedure, which does not carry a risk of non-union, as the fracture has been excised. However, as the mean age in this fracture cohort for intracapsular femoral neck and extracapsular trochanteric femoral fractures was 81 and 82 years, respectively (Aitken Citation2013), it is unlikely that the peak in the 35- to 44- year old age group can be accounted for by internally fixed intracapsular femoral neck fractures progressing to non-union. In the literature, the rate of non-union of intracapsular femoral neck hip fractures has varied between 7% and 20% of those treated by internal fixation (Upadhyay et al. Citation2004, Damany et al. Citation2005, Duckworth 2011).
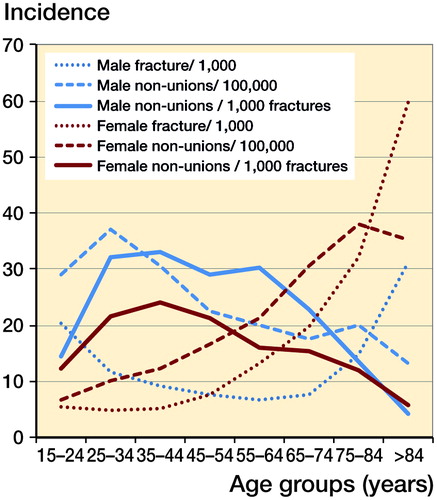
When the pattern of fracture incidence, non-union incidence, and non-union per fracture incidence according to age and sex were compared (), the patterns were markedly different. The non-union incidence was unimodal in both men and women whereas the fracture incidence was unimodal in women and bimodal in men (although the peak in young men was far smaller than the second one in elderly men), and in both sexes the incidence of fractures was relatively low up to the age of 64 years. The non-union per fracture incidence followed yet another pattern, peaking in the 35- to 44-year age group in both sexes with a gradual decline thereafter.
Figure 9. Comparison of the patterns of incidence of fractures, non-union, and non-union per fracture, according to age and sex.
The risk factors for non-union are multifactorial, with host factors, mechanical factors, and biological bone factors all playing a role (Giannoudis et al. Citation2007, Calori et al. Citation2008). However, the results of our study suggest that the risk of fracture non-union may not increase with age-related loss of bone density. Our results concur with a prospective study of 1498 acute fracture patients over the age of 50 years who all underwent screening for osteoporosis and of whom 40 developed non-union (van Wunnik et al. Citation2011). After case-control matching (1:2), the authors concluded that osteoporosis was not a risk factor for fracture non-union.
High-energy and open fractures are at increased risk of disturbed fracture healing (Robinson Citation1998, Bhandari et al. Citation2003, Court-Brown Citation2009, Schemitsch et al. Citation2012). The average age for sustaining a fracture from a fall down a stair or from standing height is in the sixth and seventh decade, whereas fractures caused by an higher-energy mode such as from sport, a direct blow, or a motor vehicle accident occur in the younger adult population (25–39 years of age on average) (Court-Brown Citation2009, Enninghorst et al. Citation2013). There are many factors—both patient-derived (e.g. smoking, diabetes) and surgeon-related (e.g. poor operative fixation)—that influence fracture healing, many of which have not yet been clearly quantified and are outwith the scope of this study.
Our data are important for regional/national planning, both of the provision of trauma services and of specialist units for complex non-union management. This is relevant globally, as there is a rising rate of trauma-related morbidity in the young adult population (Mock Citation2004).
There were weaknesses in the methodology of our study. A diagnosis of non-union was assumed when the patient had operative treatment for a fracture that had failed to heal. Although variation is recognized between surgeons (Bhandari et al. Citation2002), the decision to operate would usually be determined by the symptomatic nature of the non-union. Our figures reflect the symptomatic “fit” cases rather than the total number of cases; the figures do not include patients who were managed nonoperatively or went entirely undiagnosed. ICD-10 coding is limited, and unfortunately prevented us from separating out pertinent anatomical sites such as clavicle from scapula or femoral neck from pelvis. The population denominator was taken from a smaller population than was the numerator; however, the smaller population was found to be a good representation of the larger population (Mills Citation2016).
The ISD data are NHS Scotland data. The data do not include patients treated in the private sector. In Scotland, private practice is small—and predominantly non-complex arthroplasty and day case procedures; trauma and secondary or complex procedures such as non-union are not usually managed in the private sector. At our request, the private hospitals provided operative data on non-union, but their use of a completely different coding system (CCSD) prevented incorporation of their data into the study dataset. In total, less than 50 non-union procedures per year, i.e. less than 5% of the overall number for Scotland, were performed in the private sector. An additional 50 non-unions would have had an overall effect of increasing the non-union per fracture rate to a total of 2.0%.
The ISD/ICD-10 data count admission episodes rather than patients; so a patient who had 2 separate operations for a non-union would be counted twice. Patient episode data for this patient cohort were available from the ISD; the number of non-unions in our study may have been an overestimation of around 14% (88% had one procedure, 9% had 2 procedures, 2.5% had 3 procedures, and 0.8% had 4 or more). The complexity of the data and the variety of procedures coded prevented the data from being broken down further according to age/sex/site and procedure performed. This source of error would reduce the overall incidence of non-union per fracture by approximately 0.3–1.6%.
The combination of the 2 potential sources of error discussed above would possibly lower the incidence by 0.16% to a non-union risk of 1.7% per fracture.
Our study has revealed that the incidence of non-union per fracture may be lower than that previously considered. Given the current ICD-10 classification, the data presented here are the best calculation of the incidence of non-union per fracture treated in an adult population of over 4 million people.
In summary, this study is the first one published to examine fracture non-union rates in a large population according to age and site. The overall risk of non-union per facture was found to be 1.9%. The peak age group at risk of non-union per fracture was 25–44 years, and there was lowest risk in the elderly population.
Supplementary data
Table 3 and additional data are available as supplementary data in the online version of this article, http://dx.doi.org/10.1080/17453674.2017.1321351
LAM: study design, data collection, data analysis, and writing. SAA: data collection, data analysis, and writing. AHRWS: conception, data analysis, and writing.
IORT_A_1321351_SUPP.PDF
Download PDF (28.4 KB)Related Research Data
- Aitken S A. Thesis: The epidemiology of upper limb, lower limb and pelvic fractures in adults. In: Department of Trauma and Orthopaedics. University of Edinburgh; 2013.
- Bhadra A K, Roberts C S, Giannoudis P V. Nonunion of fibula: a systematic review. Int Orthop [Review] 2012; 36(9): 1757–65.
- Bhandari M, Guyatt G H, Swiontkowski M F, Tornetta P, 3rd, Sprague S, Schemitsch E H. A lack of consensus in the assessment of fracture healing among orthopaedic surgeons. J Orthop Trauma 2002; 16(8): 562–6.
- Bhandari M, Tornetta P, 3rd, Sprague S, Najibi S, Petrisor B, Griffith L, Guyatt G H. Predictors of reoperation following operative management of fractures of the tibial shaft. J Orthop Trauma 2003; 17(5): 353–61.
- Calori G M, Phillips M, Jeetle S, Tagliabue L, Giannoudis P V. Classification of non-union: need for a new scoring system? Injury 2008; 39Suppl2: S59–S63.
- Court-Brown C M, McQueen M M, Tornetta P. Trauma. Lippincott Williams & Willkins: Philadelphia 2006.
- Court-Brown C, Aitken S A, Forward D, O’Toole R. The epidemiology of adult fractures. In: Rockwood and Green’s fractures in adults. (Eds. Bucholz RW, Court-Brown C, Heckman JD, Tornetta P): Philidelphia, Lippincott Williams & Wilkins, 2009; pp. 53–84.
- Dahabreh Z, Dimitriou R, Giannoudis P V. Health economics: a cost analysis of treatment of persistent fracture non-unions using bone morphogenetic protein-7. Injury 2007; 38(3): 371–7.
- Dahabreh Z, Calori GM, Kanakaris N K, Nikolaou V S, Giannoudis P V. A cost analysis of treatment of tibial fracture nonunion by bone grafting or bone morphogenetic protein-7. Int Orthop 2009; 33(5): 1407–14.
- Damany D S, Parker M J, Chojnowski A. Complications after intracapsular hip fractures in young adults. A meta-analysis of 18 published studies involving 564 fractures. Injury 2005; 36(1): 131–41.
- Einhorn T A. Enhancement of fracture-healing. J Bone Joint Surg Am 1995; 77(6): 940–56.
- Enninghorst N, McDougall D, Evans J A, Sisak K, Balogh Z J. Population-based epidemiology of femur shaft fractures. J Trauma Acute Care Surg 2013; 74(6): 1516–20.
- Giannoudis P V, Einhorn T A, Marsh D. Fracture healing: the diamond concept. Injury 2007; 38Suppl4: S3–S6.
- Kanakaris N K, Giannoudis P V. The health economics of the treatment of long-bone non-unions. Injury 2007; 38Suppl2: S77–S84.
- Marek D J, Sechriest V F, 2nd, Swiontkowski M F, Cole P A. Case report: reconstruction of a recalcitrant scapular neck nonunion and literature review. Clin Orthop Rel Res 2009; 467(5): 1370–6.
- Mills L A. Thesis: Fracture non-union epidemiology and treatment. In: College of Medicine and vetinary Medicine. University of Edinbugh; 2016.
- Mills L A, Simpson A H R. The relative incidence of fracture non-union in the Scottish population (5.17 million): a 5-year epidemiological study. BMJ Open 2012; 3: e002276
- Mills L A, Simpson A H. The risk of non-union per fracture in children. J Child Orthop 2013; 7(4): 317–22.
- Mock C L J, Goosen J, Joshipurs M, Peden M. Guidelines for essentail trauma care. Geneva, World Health Organisation. 2004.
- Nowak J, Mallmin H, Larsson S. The aetiology and epidemiology of clavicular fractures. A prospective study during a two-year period in Uppsala, Sweden. Injury 2000; 31(5): 353–8.
- Patil S, Montgomery R. Management of complex tibial and femoral nonunion using the Ilizarov technique, and its cost implications. J Bone Joint Surg Br 2006; 88(7): 928–32.
- Praemer A, Furner S, Rice D P, American Academy of Orthopaedic Surgeons. Musculoskeletal conditions in the United States. 1st ed. American Academy of Orthopaedic Surgeons: Park Ridge, Ill. 1992.
- Praemer A, Furner S, Rice D P. Musculoskeletal conditions in the United States. American Academy of Orthopaedic Surgeons: Rosemont, Ill. 1999.
- Robinson C M. Fractures of the clavicle in the adult. Epidemiology and classification. J Bone Joint Surg Br 1998; 80(3): 476–84.
- Robinson C M, Al-Hourani K, Malley T S, Murray I R. Anterior shoulder instability associated with coracoid nonunion in patients with a seizure disorder. The J Bone Joint Surg Am 2012; 94(7): e40.
- Schemitsch E H, Bhandari M, Guyatt G, Sanders D W, Swiontkowski M, Tornetta P, Walter S D, Zdero R, Goslings J C, Teague D, Jeray K, McKee M D, Study to Prospectively Evaluate Reamed Intramedullary Nails in Patients with Tibial Fractures (SPRINT) Investigators. Prognostic factors for predicting outcomes after intramedullary nailing of the tibia. J Bone Joint Surg Am 2012; 94(19): 1786–93.
- Tzioupis C, Giannoudis P V. Prevalence of long-bone non-unions. Injury 2007; 38Suppl2: S3–S9.
- Upadhyay A, Jain P, Mishra P, Maini L, Gautum V K, Dhaon B K. Delayed internal fixation of fractures of the neck of the femur in young adults. A prospective, randomised study comparing closed and open reduction. J Bone Joint Surg Br 2004; 86(7): 1035–40.
- van Wunnik B P, Weijers P H, van Helden S H, Brink P R, Poeze M. Osteoporosis is not a risk factor for the development of nonunion: A cohort nested case-control study. Injury 2011; 42(12): 1491–4.