
Abstract
Purpose — The primary objective in this study was to describe the patient-reported outcome measures (PROMs) of total hip replacement (THR) patients 6 years after index surgery. Second, we sought to analyze how the preoperative, 1- and 6-year outcomes were associated.
Patients and methods — By assessing the Swedish Hip Arthroplasty Register (SHAR), 15,755 patients with complete follow-up were included in the study group. 1-year and 6-year response rates were 93% and 87%. PROMs used by the SHAR include the EQ-5D instrument, and 2 modified visual analogue scales, 1 for pain and 1 for satisfaction. We used a multivariable linear regression model to examine the relationship between preoperative, 1-year, and 6-year outcome.
Results — On average, patient-reported outcomes 6 years after THR were satisfactory. Though there was some deterioration in all mean 6-year PROMs, the patient-reported outcome after 6 years strongly resembled that of the 1-year results. The 1-year follow-up was the strongest factor associated with the 6-year results.
Interpretation — There is little deterioration in patient-reported outcomes 6 years after THR compared with the 1-year results. Although the 1-year follow-up was the strongest predictor of the 6-year results it could not alone explain the results, thus supporting the utility of the 6-year follow-up in THR patients.
Due to the expected clinical benefits and advances in prosthetic materials, the indications for hip arthroplasty have broadened. This, along with an aging population, increases the demand for THR surgery (Ethgen et al. Citation2004, Nemes et al. Citation2014). In 2012, 15,978 patients received THR surgery in Sweden alone, and approximately 3% of the Swedish population 40 years and older have at least 1 replaced hip (Garellick et al. Citation2013). As the number of THRs grows, the associated increase in other health-care expenditures demands consistent evaluation of these procedures (Hirsch Citation1998).
Historically, the success of THR has been measured by mortality and morbidity rates, as well as indices of implant survival rates (Britton et al. Citation1997). Today, the primary indications for THR are pain, functional limitation because of intraarticular disease and perceived loss of quality of life (Mancuso et al. Citation1996, Dreinhöfer et al. Citation2006). Therefore, it is imperative to accurately quantify pain reduction, improved function and quality of life. Furthermore, there is often a discrepancy between the surgeons’ and patients’ satisfaction with the surgical intervention (Mahomed et al. Citation2002, Mancuso et al. Citation2009). Generally, patients are less satisfied with their outcomes than surgeons are (Noble et al. Citation2013). This has prompted the inclusion of patient-reported outcome measures (PROMs) in the assessment of THR outcome.
PROMs are questionnaires administered to patients that are rigorously tested in terms of practicality, reliability, and validity, in order to be easy to use, yield reproducible results, and measure the intended outcome (Green et al. Citation2000). The Swedish Hip Arthroplasty Register (SHAR) collects prospective observational nationwide data in an effort to improve outcomes following THR surgery and has included a PROM follow-up program since 2002. Now, more than 10 years later, PROMs are captured and registered at every clinic in Sweden.
Data from the SHAR have shown that THR patients generally report a low health-related quality of life (HRQoL) and suffer from pain preoperatively (Rolfson et al. Citation2011). However, at the 1-year postoperative follow-up HRQoL is similar to an age- and sex-matched general population, and pain is substantially reduced (Rolfson et al. Citation2011). Few studies have investigated the mid- to long-term changes in PROMs following THR and have shown little or no change in the patients’ health state (Wylde et al. Citation2009, Judge et al. Citation2013).
This study describes the preoperative, 1-year, and 6-year results of the nationwide PROM follow-up program in Sweden. Second, we try to explore the effect of sex, age and Charnley classification on the 6-year results, as well as the relationship between the preoperative, 1-year and 6-year PROMs.
Patients and methods
Patients
Data from 81,126 patients who underwent THR between 2002 and 2007 in Sweden were collected in the SHAR. Patients treated with THR for hip fractures or malignancies were excluded yielding only elective THR for this study. Roughly 2/3 (35,549/57,317) of the patients that underwent elective THR had no preoperative PROMs, explained by the gradual introduction of the PROM program throughout the country (). If a patient had bilateral THR, only the operation occurring first was included. All patients who underwent re-operation within 7 years of the index surgery were excluded to minimize the risk of these early revisions interfering with the result of the primary THR.
Figure 1. Flowchart for the patient selection. a Indicates number of patients deceased within the respective follow-up period.
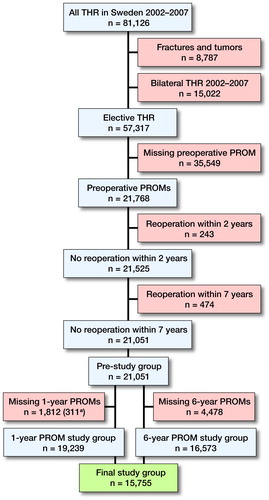
The 15,755 patients in the final study group had complete preoperative, 1-year and 6-year PROMs.
PROM follow-up program
Questionnaires are administered to THR patients preoperatively, and at the 1- and 6-year follow-up. The 1-year follow-up is meant to evaluate the THR outcome at a time when a full recovery from surgery is plausible. The next PROM follow-up occurs 6 years after index surgery as this is when complications such as loosening and osteolysis typically start to present. The preoperative response rate is 85%, and the missing 15% are most likely due to deficient routines in handing out questionnaires at some clinics (Garellick et al. Citation2013). In this study, 1-year and 6-year response rates were 93% and 87%.
At each follow-up, patients are mailed a packet containing general information, a stamped return envelope, the PROM survey, and a cover letter telling the patient to contact his/her surgeon if he or she has any hip-related problems. Non-responders receive 1 reminder after 8 weeks. The preoperative questionnaire includes the Charnley classification, a visual analog scale (VAS) for pain and the generic EQ-5D instrument. These PROMs, as well as a VAS for satisfaction, are collected at postoperative follow-up around 1 month after surgery.
The VAS for pain and for satisfaction contains a horizontal line from 0 to 100, with 0 indicating the best possible score, i.e. no pain or complete satisfaction. The VAS for pain pertains to the amount of pain from the hip during the last month. The VAS for satisfaction addresses the satisfaction with the index surgery. Both scales are modified from the traditional VAS with 5 subscale indicators (0–20, very satisfied/no pain; 20–40, satisfied/mild pain; 40–60, moderately satisfied/moderate pain; 60–80, not satisfied/severe pain; 80–100, dissatisfied/unbearable pain). Both have been tested internally for validity and reliability (Rolfson Citation2010).
EuroQol’s EQ-5D (EuroQol, Rotterdam, The Netherlands) is a standardized generic HRQoL instrument that evaluates patients in 5 dimensions: mobility, self-care, usual activities, pain/discomfort and anxiety/depression, converted into a single summary index ranging from –0.594 to 1, with values indicating worst to best possible health state, respectively. The EQ-5D instrument also includes an EQ-VAS where the patients rate their overall health state on a vertical line ranging from 0 (worst possible) to 100 (best possible) (Rabin and De Charro Citation2001, Rolfson Citation2010).
Statistics
We used SPSS® (for Mac, release 22.0.0.0) (IBM Corp, Armonk, NY, USA) and R (R Core Team Citation2016) for statistical analysis. Frequencies and proportions are used to present data regarding categorical variables. For PROM results and other continuous variables, results are presented with mean (SD). Student’s t-test was used to evaluate the differences in continuous variables, while chi-square tests were employed for categorical variables.
We used multivariable regression analysis to assess the effects of preoperative and 1-year PROMs on 6-year outcomes. A mediation analysis was conducted to better understand the effect of the preoperative PROM on the 6-year outcome (Figure 2, see supplementary data) (Imai et al. Citation2010, Tingley et al. Citation2014). Mediation analysis aims to clarify the relationship between an antecedent variable (preoperative PROM) and outcome (6-year PROM) by the inclusion of a third variable: the mediator (1-year PROM). Mediation exists if the antecedent changes the mediator and change in the mediator is followed by change in the outcome when the antecedent variable is present (VanderWeele Citation2011). Thus, the mediator accounts partially or totally for the relationship between the antecedent variable and outcome and the total effect of the antecedent variable on the outcome can be decomposed into effects due to mediated paths and effects due to non-mediated paths (Suzuki et al. Citation2011) (Figure 2, see Supplementary data).
The parameters of these equations are estimated using the least-squares method. The diagnostic test run did not identify any serious violation of the assumptions of the linear regression analysis. Additional to the assumptions of linear regression, mediation analysis has strong assumptions. First, mediation assumes that the casual directions are correct. While we did not explicitly test for causality we assume that the information flow follows the chronological order of preoperative data, 1-year follow up and ends with the 6-year follow up. Another important assumption is that the mediator and the outcome have no other common causes beside the ancestor. However, this assumption is almost always violated in observational studies and sensitivity analyses are needed to assess the effect of violation of assumption on estimated effects. This is further elaborated on in the Appendix.
Ethics, funding and potential conflicts of interest
The SHAR complies with the fundamental ethical guidelines of the Declaration of Helsinki (WMA Citation2013). The continued collection of nationwide, prospective observational data is regulated by the Patient Data Act (SFS Citation2008) and the Personal Data Act (SFS Citation1998). Collected data are aggregated to ensure that information cannot be traced back to the individual patient. All patients receive information regarding SHAR orally or in writing preoperatively. Patients have the right to leave the PROM program and have all data erased from the SHAR at any time. This study is part of a larger research project approved by the Regional Ethics Review Board in Gothenburg (entry number 271-14).
No funding was received. We have no conflicts of interest.
Results
The final study group included 15,755 patients and was used for all 6-year PROM analyses. Women represented 58% of the study participants. Osteoarthritis was the dominating diagnosis (93%), followed by inflammatory arthritis and childhood hip disease, the latter 2 being more common in the female group. The mean age of patients was 67 years. Women were older than men, and had a higher proportion of Charnley class C patients. There were statistically significant differences for all PROM scores between the three time points ().
Table 1. Patient demographics of all 15,755 patients included in this study. Note all assessed parameters were significantly different between men and women (all p < 0.001)
Linear regression analysis: outcome of 6-year PROMs
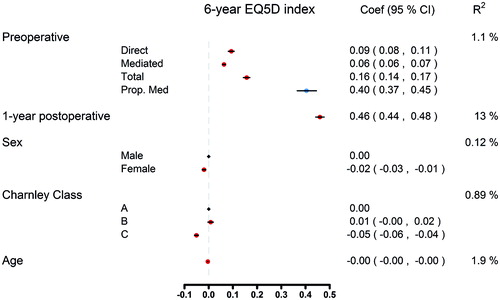
The 1-year postoperative PROM explained most variation in 6-year EQ-5D index (). The patient’s health state before surgery, as classified by the preoperative EQ-5D, has little effect in determining the 6-year EQ-5D index. Being female, Charnley class C, and age all had a negative effect on the 6-year EQ-5D score; however, the effect is not great.
Figure 3. Multivariable regression analysis on the effect of preoperative EQ-5D index on 6-year EQ-5D index values where the 1 -year follow-up EQ-5D index acts like a mediator.
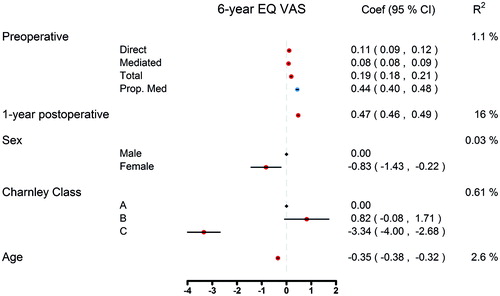
Similarly, the 1-year postoperative EQ VAS explained most variance in 6-year EQ VAS (). While Charnley class as a 3-level variable explained a low amount of the observed variance in 6-year outcome, class C patients have a notable tendency towards a decline in EQ VAS compared with classes A and B. Furthermore, age has a notable effect on the 6-year EQ VAS outcome, with older patients reporting worse EQ VAS scores. Females have lower EQ VAS scores with –0.81 units than males (95% CI = -1.38; –0.24).
Figure 4. Multivariable regression analysis on the effect of preoperative EQ VAS index on 6-year EQ VAS index values where the 1-year follow-up EQ VAS index acts like a mediator.
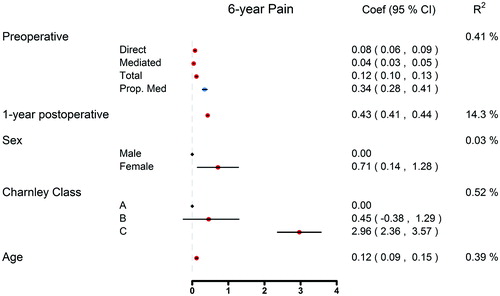
The 1-year postoperative Pain VAS explained most variance in 6-year Pain VAS (). There is a statistically significant difference in 6-year VAS pain between patients in the different Charnley classifications. Older age and female sex increase the risk of pain in the 6-year follow-up.
Figure 5. Multivariable regression analysis on the effect of preoperative Pain VAS index on 6-year Pain-VAS index values where the 1-year follow-up Pain-VAS index acts like a mediator.
Discussion
It is well known that total hip replacement provides improvements in health-related quality of life, pain reduction, and satisfaction after index surgery, as also found in our study. The average THR patient reports a low preoperative HRQoL, yet has a postoperative EQ-5D index comparable to those expected of the general population (Rolfson et al. Citation2011). This effect is thought to be preserved with minimal deterioration beyond the 1-year postoperative period, but slight decline has been observed in PROMs over time (Gould et al. Citation2012). As the average age of patients in our study was 67 years, it is plausible that the slight decline in the health state of the patient is related to natural aging but it is important to determine whether the improvements in HRQoL after THR surgery are long lasting (Gordon et al. Citation2014). Few studies have examined the long-term changes in PROMs following THR and most have found little or no change in the patients’ health state (Wylde et al. Citation2009, Judge et al. Citation2013). We found that the only PROM with marked decline between the 1- and 6-year follow-ups is the EQ VAS. Pain and satisfaction remain relatively unchanged, further indicating that the minor PROM deterioration observed is likely mediated through aging.
Previous research has identified substantial improvement in PROMs after THR surgery (Wylde et al. Citation2009, Judge et al. Citation2013, Naal et al. Citation2015, Geeske Peeters et al. Citation2017). Judge et al. (2013) conducted a study on 1,281 THR patients to assess the longitudinal changes in Oxford Hip Scores (OHS), a PROM developed to assess function and pain amongst patients undergoing hip arthroplasty. Patients received PROMs preoperatively and each consecutive year postoperatively for 5 years to evaluate changes in the OHS. Regardless of the patient’s preoperative health state and other negative risk factors, such as age and BMI, patients reported substantial improvements in the OHS. Furthermore, that study concluded that the differences observed in the OHS between 1- and 5-year follow-ups were negligible (Judge et al. Citation2013). Similarly, Wylde et al. (Citation2009) assessed postoperative OHS 5–8 years after THR surgery from 1,112 patients that underwent THR in 1 elective orthopedic center. The collected PROMs resembled scores from patients 6 to 12 months postoperatively, suggesting that early PROMs are associated with long-term outcomes in THR. However, this group conducted a later study comparing the OHS reported 5–8 years postoperatively to the OHS 12–16 years postoperatively and found considerable change in the scores across patients. This change only reached statistical significance in patients over 80 years old, indicating that this decline in health state is associated with patient age.
Our data remain largely consistent with the previous research on mid-term PROMs in patients who have undergone THR as we further corroborate the large improvement seen in pain levels and HRQoL after surgery. We have determined that the PROMs after THR in Sweden remain relatively constant between the 1- and 6-year follow-ups. Charnley class C, age and female sex all contribute to worse outcomes in the 6-year follow-up. In the general population, women report a lower EQ-5D index as well as more problems in the dimensions of usual activities, pain/discomfort and anxiety/depression (Burström et al. Citation2001). This might be reflected in patients undergoing THR as well. In our study, women were 2.5 years older than men and reported slightly worse PROMs after THR surgery. However, when comparing the preoperative, 1- and 6-year follow-ups, women have a higher net gain in PROMs postoperatively.
These variables, along with the preoperative PROMs, only explain the variability in the mid- to long-term outcome to a small extent. Our data suggest the 1-year postoperative follow-up PROM to be the strongest predictor of the 6-year PROM. While some preoperative PROMs were associated with the 1-year scores (EQ-5D index 40%, EQ VAS 45%, pain-VAS 36%), other factors not observed in this study also likely affected the 1-year outcome. In conclusion, the correlation between 1- and 6-year follow-ups is not strong enough to abandon 6-year follow-up.
We report data gathered from a nationwide register that collects long-term follow-up PROM data. This offers certain unique advantages of having both large recruitment and retention of subjects. The preoperative PROM response rate was 85%. Missing preoperative PROMs can likely be attributed to faulty routines in their administration (Garellick et al. Citation2013). The response rates in the 1- and 6-year follow-ups were satisfactory, at 93% and 87%. It has been shown that there is a peak in the occurrence of postoperative complications 6 years after surgery, giving further importance to the 6-year follow-ups as it is crucial to detect some of these complications in a timely manner.
Our study did have certain limitations. First, like all observational register studies, there are likely confounding variables unknown to us that were not collected and therefore were unable to be assessed. Second, the SHAR’s follow-up PROMs include the widely used, generic EQ-5D, combined with the disease-specific VASs for pain and satisfaction resulting in a universally applicable evaluation of patient-reported outcome after THR. There are several other PROMs when it comes to assessing HRQoL, pain and hip function. Some of these are more comprehensive and detailed compared with the relatively compact EQ-5D instrument and VAS scales. A compromise in sensitivity is accepted as the SHAR strives to achieve a high response rate and has succeeded in doing so due to the careful selection of evaluated PROMs.
Future research is warranted to assess the correlation between 1- and 10-year follow-up PROMs to determine if these subjective measures of health remain relatively consistent in the long-term follow-up of THR patients. It will be especially interesting to investigate which factors are associated with those who develop complications in the latter phases of follow-up between 6 and 10 years postoperatively.
Supplementary data
Figure 2 and an Appendix describing missing data and sensitivity analyses are available as supplementary data in the online version of this article, http://dx.doi.org/10.1080/17453674.2017.1339541
AB, GG, SN and OR designed the study. AB and SN performed statistical analyses. AB, GD, SN and OR analyzed and interpreted the results. AB and GD drafted the manuscript. All authors contributed to and approved the final version of the manuscript.
IORT_A_1339541_SUPP.PDF
Download PDF (154.7 KB)- Britton A R, Murray D W, Bulstrode C J, McPherson K, Denham R A. Pain levels after total hip replacement: Their use as endpoints for survival analysis. J Bone Joint Surg Am 1997; 79 (1): 93–8.
- Burström K, Johannesson M, Diderichsen F. Swedish population health-related quality of life results using the EQ-5D. Qual Life Res 2001; 10 (7): 621–35.
- Dreinhöfer K E, Dieppe P, Stürmer T, Gröber-Grätz D, Flören M, Günther K P, Puhl We, Brenner H. Indications for total hip replacement: Comparison of assessments of orthopaedic surgeons and referring physicians. Ann Rheum Dis 2006; 65 (10): 1346–50.
- Ethgen O, Bruyerè O, Richy F, Dardennes C, Reginster J Y. Health-related quality of life in total hip and total knee arthroplasty: A qualitative and systematic review of the literature. J Bone Joint Surg Am 2004; 86 (5): 963–74.
- Garellick G, Rogmark C, Karrholm J, Rolfson O. Swedish Hip Arthroplasty Register. Annual Report 2012. www.shpr.se 2013.
- Geeske Peeters G M, Rainbird S, Lorimer M, Dobson A J, Mishra G D, Graves S E. Improvements in physical function and pain sustained for up to 10 years after knee or hip arthroplasty irrespective of mental health status before surgery. Acta Orthop 2017; 88 (2): 158–65.
- Gordon M, Greene M, Frumento P, Rolfson O, Garellick G, Stark A. Age- and health-related quality of life after total hip replacement: Decreasing gains in patients above 70 years of age. Acta Orthop 2014; 85(3): 244–9.
- Gould V C, Blom A W, Wylde V. Long-term patient-reported outcomes after total hip replacement: Comparison to the general population. Hip Int 2012; 22 (2): 160–5.
- Green C, Brazier J, Deverill M. Valuing health-related quality of life: A review of health state valuation techniques. PharmacoEconomics 2000; 17 (2): 151–65.
- Hirsch H S. Total joint replacement: A cost-effective procedure for the 1990s. Medicine and Health, Rhode Island 1998; 81 (5): 162–4.
- Imai K, Keele L, Tingley D. A general approach to causal mediation analysis. Psychol Methods 2010; 15 (4): 309–34.
- Judge A, Arden N K, Batra R N, Thomas G, Beard D, Javaid M K, Cooper C, Murray D, and EPOS group. The association of patient characteristics and surgical variables on symptoms of pain and function over 5 years following primary hip-replacement surgery: A prospective cohort study. BMJ Open 2013; 3 (3).
- Mahomed N N, Liang M H, Cook E F, Daltroy L H, Fortin P R, Fossel A H, et al. The importance of patient expectations in predicting functional outcomes after total joint arthroplasty. J Rheumatol 2002; 29 (6): 1273–9.
- Mancuso C A, Ranawat C S, Esdaile J M, Johanson N A, Charlson M E. Indications for total hip and total knee arthroplasties: Results of orthopaedic surveys. J Arthroplasty 1996; 11 (1): 34–46.
- Mancuso C A, Jout J, Salvati E A, Sculco T P. Fulfillment of patients’ expectations for total hip arthroplasty. J Bone Joint Surg Am 2009; 91 (9): 2073–8.
- Naal F D, Impellizzeri F M, Lenze U, Wellauer V, von Eisenhart-Rothe R, Leunig M. Clinical improvement and satisfaction after total joint replacement: A prospective 12-month evaluation on the patients’ perspective. Qual Life Res 2015; 24 (12): 2917–25.
- Nemes S, Gordon M, Rogmark C, Rolfson O. Projections of total hip replacement in Sweden from 2013 to 2030. Acta Orthop 2014; 85 (3): 238–43.
- Noble P C, Fuller-Lafreniere S, Meftah M, Dwyer M K. Challenges in outcome measurement: Discrepancies between patient and provider definitions of success. Clin Orthop Relat Res 2013; 471 (11): 3437–45.
- R Core Team. R: A language and environment for statistical computing. R Foundation for Statistical Computing 2016; Vienna, Austria (http://www.R-project.org/).
- Rabin R, De Charro F. EQ-5D: A measure of health status from the EuroQol Group. Ann Med 2001; 33 (5): 337–43.
- Rolfson O. Patient-reported outcome measure and health-economic aspects of total hip arthroplasty: A study of the Swedish Hip Arthroplasty Register. Gothenburg: University of Gothenburg; 2010.
- Rolfson O, Kärrholm J, Dahlberg L E, Garellick G. Patient-reported outcomes in the Swedish Hip Arthroplasty Register: Results of a nationwide prospective observational study. J Bone Joint Surg Br 2011; 93 (7): 867–75.
- SFS. Personal Data Act. SFS 1998: 204: Ministry of Justice (Ed Justice Mo); 1998.
- SFS. Patient Data Act. SFS 2008: 355: Ministry of Health and Social Affairs (Ed Affairs MoHaS); 2008.
- Suzuki E, Yamamoto E, Tsuda T. Identification of operating mediation and mechanism in the sufficient-component cause framework. Eur J Epidemiol 2011; 26 (5): 347–57.
- Tingley D, Yamamoto T, Hirose K, Keele L, Imai K. Mediation: R Package for Causal Mediation Analysis 2014-09-02; 59 (5): 38.
- VanderWeele T J. Subtleties of explanatory language: What is meant by “mediation”? Eur J Epidemiol 2011; 26 (5): 343–6.
- WMA. Declaration of Helsinki – Ethical principles for medical research involving human subjects. Ferney-Voltaire: World Medical Association 2013.
- Wylde V, Blom A W, Whitehouse S L, Taylor A H, Pattison G T, Bannister G C. Patient-reported outcomes after total hip and knee arthroplasty: Comparison of midterm results. J Arthroplasty 2009; 24 (2): 210–16.