
Abstract
Background and purpose — In arthroplasty registry studies, the analysis of time to revision is complicated by the competing risk of death. There are no clear guidelines for the choice between the 2 main adjusted analysis methods, cause-specific Cox and Fine–Gray regression, for orthopedic data. We investigated whether there are benefits, such as insight into different aspects of progression to revision, to using either 1 or both regression methods in arthroplasty registry studies in general, and specifically when the length of follow-up is short relative to the expected survival of the implants.
Patients and methods — Cause-specific Cox regression and Fine–Gray regression were performed on total hip (138,234 hips, 124,560 patients) and knee (139,070 knees, 125,213 patients) replacement data from the Dutch Arthroplasty Register (median follow-up 3.1 years, maximum 8 years), with sex, age, ASA score, diagnosis, and type of fixation as explanatory variables. The similarity of the resulting hazard ratios and confidence intervals was assessed visually and by computing the relative differences of the resulting subdistribution and cause-specific hazard ratios.
Results — The outcomes of the cause-specific Cox and Fine–Gray regressions were numerically very close. The largest relative difference between the hazard ratios was 3.5%.
Interpretation — The most likely explanation for the similarity is that there are relatively few events (revisions and deaths), due to the short follow-up compared with the expected failure-free survival of the hip and knee prostheses. Despite the similarity, we recommend always performing both cause-specific Cox and Fine–Gray regression. In this way, both etiology and prediction can be investigated.
Competing risks methodology is beginning to take its rightful place in the arsenal of statistical methods for arthroplasty registry data (Gillam et al. Citation2011, Lacny et al. Citation2015, Wongworawat et al. Citation2015). The generally advanced age of arthroplasty patients necessitates competing risks techniques, which naturally incorporate the probability that a patient may die before experiencing revision, or before another outcome of interest occurs. For unadjusted analyses, the Aalen–Johansen estimator is typically used, which is a more general version of the Kaplan–Meier, capable of incorporating competing events (Aalen and Johansen Citation1978, Putter et al. Citation2007). It provides an estimate of the cumulative incidence function, which is defined as the probability of failing from a specific cause before time t. For adjusted analyses, 2 methods are typically considered: cause-specific Cox regression and Fine–Gray regression (Holt Citation1978, Fine and Gray Citation1999, Putter et al. Citation2007). The choice between these 2 methods is the focus of this paper. The assumptions underlying both methods are not in general compatible. Current practice is to select 1 of the 2 methods, e.g., Puchner et al. Citation2015, Wang et al. Citation2009, contrary to the recommendations of Latouche et al. (Citation2013), if competing risks are adjusted for at all. The implications for the interpretation of analyses of large arthroplasty data-sets of these methodologies are still lacking in the orthopedic literature (Porcher Citation2015).
Competing risks
Traditional methods for estimating the time to revision of a joint implant include the Kaplan–Meier estimator and Cox proportional hazard models. These methods treat patients who die before experiencing revision as censored observations, implying that their implants could still be revised, even though they have died. Methods that do not account for the competing risk of death will overestimate the probability of revision (Putter et al. Citation2007, Keurentjes et al. Citation2012, Lacny et al. Citation2015), which may influence medical decision-making. The impact of ignoring the competing risk of death on the results of the analyses depends on the incidence of the competing event. In the case of revision surgery, the incidence of death is typically very high, as the patient population is on average elderly (average age is 69 years for THR and TKR in The Netherlands). This is illustrated in Figures 1 and . The competing risk of death is especially strong for patients older than 70: the cumulative incidence of revision 8 years after THR is 3.4%, while that of death is 18%. The numbers for TKR are 3.3% and 19% respectively.
Figure 1. Unadjusted cumulative incidences of revision (bottom) and death (top) after THR in patients 70 years or younger or older than 70. Estimated by the Aalen–Johansen (1978) estimator.
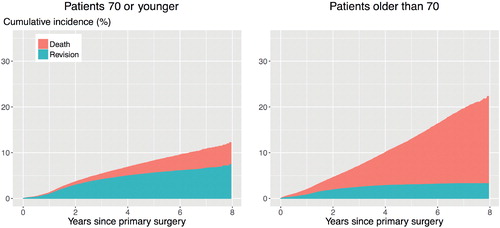
Figure 2. Unadjusted cumulative incidences of revision (bottom) and death (top) after TKR in patients 70 years or younger or older than 70. Estimated by the Aalen–Johansen (1978) estimator.
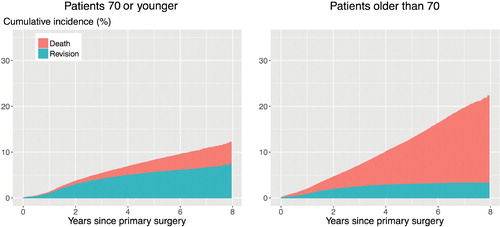
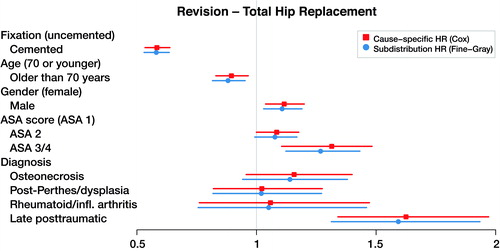
Figure 3. Cause-specific hazard ratios and subdistribution hazard ratios for total hip replacement with revision as end-point (dots), with 95% confidence intervals (lines).
For adjusted analyses, typically either cause-specific Cox regression or Fine–Gray regression are performed. We briefly review the 2 methods. We refer to Gillam et al. (Citation2011) for a comprehensive review and comparison of competing risks methods for arthroplasty registry data.
Overview of statistical outcome-measure methods
Cause-specific Cox regression
The Cox proportional hazards (PH) model is a default choice for modelling the effect of covariates on the hazard rate when there is no competing event. Cause-specific Cox regression is a natural extension of standard Cox PH modelling for the competing risks setting, where a PH model is applied to each cause-specific hazard. The cause-specific hazard is the instantaneous rate of failure due to one of the causes. All cause-specific hazards, in our case the cause-specific hazards of revision and death, are estimated separately, by censoring all individuals who failed due to a cause other than the one considered. Thus, when the cause-specific hazard of revision is estimated, all patients who die before undergoing revision are considered censored. In the Cox model, the instantaneous risk of revision is compared among patients who are event free and in follow-up (that is, who have not yet experienced revision or the competing event of death at a particular time point). This model is appropriate if the interest is in understanding etiological or biological questions (Putter et al. Citation2007).
An advantage of cause-specific Cox regression is that it gives detailed insights into the relationship between a risk factor and each separate outcome. In our orthopedic setting, with revision and death as outcomes, such insights are of the form: “Is the revision risk for a patient group (e.g., older patients) only decreased because these patients are more likely to die before being eligible for revision, or is there a separate age-related effect?” A drawback is that the results from cause-specific Cox regression do not directly answer the question as to whether the revision risk is decreased at all for patients with a certain characteristic (e.g., older patients), at least, not without combining the analyses for both the hazard of revision and the hazard of death. The effect of a covariate on the cause-specific hazard of revision can be quite unpredictable when expressed in terms of the cause-specific cumulative incidence function. For example, a covariate may be associated with an increased hazard of revision, but the probability of revision may be unaffected or even decrease. One of the ways in which this can happen is if the covariate is associated with an even larger increase in the hazard of death. The reason for this is that the cumulative incidence of any event (for example, revision) depends on the cause-specific hazards of all events. It follows that the way in which the cause-specific cumulative incidence is associated with covariates might be different from the way in which the cause-specific hazard is associated with covariates. For example, old age could be associated with an increased hazard of revision, but with an even larger hazard of death, such that the probability of revision for older patients may turn out to be lower than that of younger patients.
Fine–Gray regression model
Fine–Gray regression resolves the most important drawback to cause-specific Cox regression, as the coefficients resulting from Fine–Gray regression do have a direct relationship with the cumulative incidence (Fine and Gray Citation1999). Although the value itself is hard to interpret (Andersen et al. Citation2012), if a covariate has a positive coefficient in the Fine–Gray model, then the cumulative incidence will be increased. Fine–Gray regression achieves this by assuming a proportional hazards model for a different hazard, namely the subdistribution hazard. The subdistribution hazard is the instantaneous risk of failing from a cause given that the individual has not failed from that cause. The difference with the cause-specific hazard is that the risk set for the subdistribution hazard includes individuals who have failed from other causes already (such as death, which is “competing” with the risk of revision). The hazard of revision is compared based on the subset of patients who have not yet experienced revision at a particular time point. A patient who dies remains in the risk set, contrary to the risk set for cause-specific Cox regression, where such a patient would be censored. While Fine–Gray regression allows direct assessment of the relationship between a covariate and the cumulative incidence of the cause of interest, the insight into the effect of a covariate on a cause-specific hazard instead of a probability is lost. A model that regresses on the cumulative incidence function is a proper tool for prognosis and medical decision-making, since it deals with the actual risk of events occurring over time (Gail and Pfeiffer Citation2005, Ambrogi et al. Citation2008). In our orthopedic setting, questions answered by Fine–Gray regression are of the form: “Is a certain group of patients (e.g., older patients) more or less likely to experience revision than other (e.g., younger) patients?” and these can be answered by only estimating the subdistribution hazard of revision, without need for combination with the subdistribution hazard of death.
Relationship between cause-specific Cox and Fine–Gray regression
Both regression methods can be used to obtain an estimate of the cumulative incidence function, through different hazard ratios. There is a little-known relationship between the subdistribution hazard and cause-specific hazard to which we draw attention in this paper. Taking revision as the end-point of interest, the following equality holds (Beyersmann and Schumacher Citation2007, Beyersmann and Scheike Citation2013):
Here, the overall survival is the probability of neither experiencing revision nor dying. If the probability of experiencing revision is low, then both quantities in the ratio will be close to each other, and thus the ratio will be close to 1. This in turn implies that the cause-specific hazard and subdistribution are almost the same. A similar expression holds for the subdistribution hazards and cause-specific hazards for death; when there are few deaths, the subdistribution and cause-specific hazards will be almost the same. There is another situation in which the cause-specific and subdistribution hazard ratios for a covariate are similar, namely when a covariate only affects one of the cause-specific hazards (Grambauer et al. Citation2010). As we shall see in the analysis of data from the Dutch Arthroplasty register, equality will turn out to be relevant for the analysis of data from orthopedic registries with a relatively short follow-up.
Purpose of study
The purpose of the present paper is to use real orthopedic data to discuss the advantages and disadvantages of each method for arthroplasty registry studies with revision as the end-point, to characterize the questions that can be answered by each method, and to draw attention to the little-known fact that Fine–Gray and cause-specific Cox regression may yield numerically very similar results when there are few revisions or death, or when a covariate affects only one of the cause-specific hazards.
Patients and methods
Comparison of the Dutch Arthroplasty Register data
This is a national cohort study, using data on THRs and TKRs from the Dutch Arthroplasty Register (LROI), established in 2007. Completeness for hip arthroplasties was over 97%, and for knee arthroplasties over 96%, in 2012 and 2013 (Van Steenbergen et al. Citation2015). Inclusion criteria for this analysis were:
THR/TKR performed between January 1, 2008 and December 31, 2015;
Complete covariate information available;
Known diagnosis (i.e., “other” was excluded).
138,234 hips in 124,560 patients, and 139,070 knees in 125,213 patients were included. On both data sets, cause-specific Cox regression and Fine–Gray regression were performed, with either revision or death as outcomes. The PH assumptions were checked by inspecting the Aalen–Johansen estimates of the cumulative incidences (for Fine–Gray) and the Nelson–Aalen estimates of the cumulative hazards. Besides a visual assessment of the similarity of the outcomes, for each variable the relative difference of the hazard ratios was computed as:
The analyses are adjusted for sex, age, ASA classification, diagnosis, and type of fixation. Age is categorized to “70 or younger” and “older than 70”. ASA scores 3 and 4 were grouped together. Patients with hybrid fixations were excluded, leaving only patients with cemented or uncemented fixation. The THR patients had 1 of 5 diagnoses: osteoarthritis, dysplasia or post-Perthes, rheumatoid or inflammatory arthritis, osteonecrosis, or late posttraumatic. The TKR patients had 1 of 4 diagnoses: osteoarthritis, rheumatoid or inflammatory arthritis, osteonecrosis, or posttraumatic arthritis ( and ). Median follow-up for both THR and TKR was 3.1 years, maximum was 8 years. Analyses were performed using R version 3.3.2 (R Core Team Citation2016).
Table 1. Patient characteristics for the total hip replacement patients from the Dutch Arthroplasty Register included in the analysis, that is, for the patients with complete covariate information and no “other” diagnosis. Values are frequency (%) unless otherwise specified
Table 2. Patient characteristics for the total knee replacement patients from the Dutch Arthroplasty Register included in the analysis, that is, for the patients with complete covariate information and no “other” diagnosis. Values are frequency (%) unless otherwise specified
Ethics, funding, and potential conflicts of interest
No research ethics committee approval was sought for secondary analysis of registry data in line with the guidelines of the Central Committee on Research Involving Human Subjects. No funding was received for this study. No competing interests were declared.
Results
Tables 3 and 4 (see Supplementary data) state the estimated coefficients and standard errors for each competing outcome obtained by cause-specific Cox and Fine–Gray regression, for THR and TKR respectively. No violation of the PH assumptions was detected.
The cause-specific hazard ratios resulting from cause-specific Cox, and the subdistribution hazard ratios resulting from Fine–Gray by exponentiating the coefficients in Tables 3 and 4 (see Supplementary data) are visualized, together with the 95% confidence intervals, in , to allow for visual assessment of the similarity of the outcomes.
Figure 4. Cause-specific hazard ratios and subdistribution hazard ratios for total hip replacement with death as end-point (dots), with 95% confidence intervals (lines).
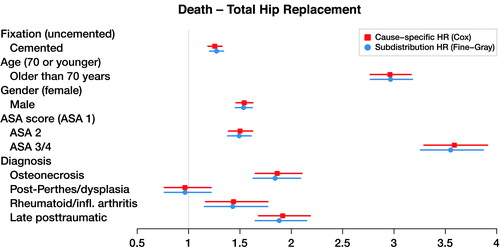
Figure 5. Cause-specific hazard ratios and subdistribution hazard ratios for total knee replacement with revision as end-point (dots), with 95% confidence intervals (lines).
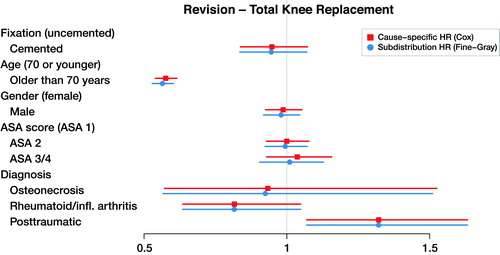
Figure 6. Cause-specific hazard ratios and subdistribution hazard ratios for total hip replacement with death as end-point (dots), with 95% confidence intervals (lines).
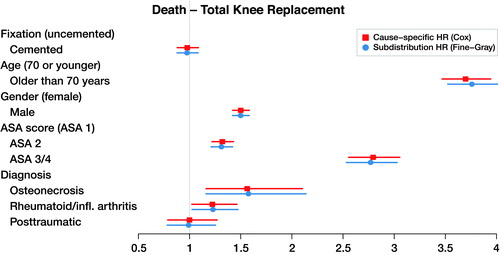
The maximum relative difference of the hazard ratios was 3.5%. Covariates have the same effect on the cumulative incidence (estimated by the Fine–Gray model) and on the hazard (estimated by the cause-specific Cox) for THR and TKR data. Given 2 THR patients with the same characteristics except for fixation, results in Table 3 and and show that cemented fixation has a statistically significant protective effect on the cumulative incidence (and on the rate) of revision compared with uncemented. Age has a statistically significant protective effect on revision. The effect of ASA score and diagnosis is more prominent for the end-point death than for revision.
Discussion
Similarity of results on hip and knee replacement data
Clinically, the risk factors found in Tables 3 and 4 (see Supplementary data) are in line with previous research, with uncemented fixation, younger age, male sex, higher ASA score, and posttraumatic procedures associated with a higher THR revision risk, and younger age and posttraumatic procedures associated with a higher TKR revision risk (Prokopetz et al. Citation2012, Jasper et al. Citation2016). We focus here on the methodological aspects of our results. The outcomes of the cause-specific Cox regression and Fine–Gray regression are numerically very similar (). As explained in the methods section, such numerical similarity is expected when censoring is heavy. In the Dutch Arthroplasty Register data, censoring is very heavy indeed: there are 3,251 revisions and 5,813 deaths among the 138,234 transplanted hips, and 4,169 revisions and 5,610 deaths among the 139,070 transplanted knees. The low frequency of events is explained by the short amount of follow-up relative to the average survival of a hip or knee implant.
Implications for clinical interpretation
The similarity of the outcomes of both regression methods indicates that the answers to etiological and predictive questions are the same for the early follow-up phase. For example, TKR patients older than 70 years have a lower probability of revision than patients younger than 70 years (as we can conclude from the Fine–Gray regression with revision as outcome) and this is not just because they are more likely to die before experiencing revision (as we can conclude from the cause-specific Cox hazard ratio for revision). The same reasoning holds for the other covariates and outcomes.
Added value of reporting cause-specific Cox and Fine–Gray regression outcomes
The recommendation of Grambauer et al. (Citation2010) and Latouche et al. (Citation2013) is to report the outcome of both cause-specific Cox and Fine–Gray regression side by side, for all causes. When the results of the 2 analyses are not numerically close, different insights can be learned from each analysis. Cause-specific Cox allows for separate assessment of the relationship between each covariate and each hazard of interest (in this case, of revision and death) and may thus provide more insight into the mechanisms leading to failure. Fine–Gray regression yields in a sense a summary, indicating the association between a covariate and the cumulative incidence of revision. This direct relationship cannot be directly determined from cause-specific Cox coefficients, because the effect of a covariate on a hazard can be very different from the effect on the corresponding cumulative incidence. For example, if a coefficient resulting from a cause-specific Cox analysis is positive for revision but even larger for death, then the net effect on the cumulative incidence may actually be negative. Fine–Gray regression would indicate without further computations that the effect is negative, but does not reveal that this is because the high hazard of death prevents the occurrence of revision.
The benefits of both methods can be taken advantage of by presenting the outcomes of both analyses. While the benefits cannot be demonstrated on the data from the Dutch Arthroplasty Register, researchers analyzing data from older registries with longer follow-up may obtain additional insights by performing both cause-specific Cox and Fine–Gray regression. The cause-specific hazards model is more appropriate when etiological questions are of interest since it quantifies the event rate among individuals at risk of experiencing the event of interest (revision in this context). Fine–Gray is a regression model for the cumulative incidence function and it should be used when prediction is the focus.
Limitations
There are several limitations to this study. The data are observational, and thus no causal conclusions can be drawn from the analyses performed. The amount of follow-up is short relative to the average survival of each implant. Due to the scarcity of events, Fine–Gray and cause-specific Cox are numerically similar in all comparisons. While that is the point to which we would like to draw attention, we would like to emphasize that, as a rule, Fine–Gray and cause-specific Cox regression will yield different results. Finally, if the effect of 1 of the covariates is time-dependent, a more careful analysis is required. We refer to Gillam et al. (Citation2011) for discussion on this point.
Link to ignored bilaterality
As an aside, we remark on a connection between the observed similarity between cause-specific Cox regression and Fine–Gray regression, and the issue of incorporating bilateral patients in orthopedic studies. The impact of ignored bilaterality is commonly considered negligible (Ranstam et al. Citation2011). We would like to point out that the circumstances under which ignoring the presence of bilateral patients does not substantially affect the analyses are the same under which the outcomes of Fine–Gray regression and cause-specific Cox regression are numerically close: when there are few events, ignoring bilaterality is unlikely to affect the results (Robertsson and Ranstam Citation2003). Details concerning analysis in the presence of bilateral patients are discussed in Lie et al. (Citation2004) and Van der Pas et al. (Citation2017).
Recommendations for statistical analysis of arthroplasty registry data
For researchers faced with the choice between cause-specific Cox regression and Fine–Gray regression, we concur with the recommendations of Grambauer et al. (Citation2010) and Latouche et al. (Citation2013) to report the outcome of both Fine–Gray and cause-specific Cox regression, but add the recommendation to only do so when the results are not numerically similar. Numerical closeness of the Fine–Gray and cause-specific Cox regressions is expected in many arthroplasty registry studies, because the survival of hip and knee prostheses is generally high. If the results of the 2 analyses are indeed similar, then presenting 1 of them suffices, with a brief remark indicating that both analyses were performed. In case of longer follow-up, less similarity between the 2 regression methods is expected. Again, we emphasize that the interpretation of the results based on the 2 models is different and that the research question should guide the choice between the 2 models. We therefore caution that the recent statement made by Ranstam and Robertsson (Citation2017), based on simulated data, that cause-specific Cox is the best method for estimating relative revision risk, should not be interpreted as a guideline that cause-specific Cox is always the best option. Cause-specific Cox regression is most suitable for etiological questions, while Fine–Gray regression is more appropriate for prediction.
Supplementary data
Tables 3 and 4 are available as supplementary data in the online version of this article, http://dx.doi.org/10.1080/17453674.2018.1427314
SP and MF conceived and designed the study. SP and MF conducted the analysis, and all authors interpreted the results. SP drafted the first version of the manuscript. All authors helped in revising the manuscript and gave their final approval of the submitted version. All authors had full access to the data and take responsibility for the integrity of the data and the accuracy of the data analysis.
Acta thanks Ove Furnes and other anonymous reviewers for help with peer review of this study.
IORT_A_1427314_SUPP.PDF
Download PDF (25.3 KB)Related Research Data
- Aalen O O, Johansen S. An empirical transition matrix for non-homogeneous Markov chains based on censored observations. Scand J Stat 1978; 5: 141–50.
- Ambrogi F, Biganzoli E, Boracchi P. Estimates of clinically useful measures in competing risks survival analysis. Stat Med 2008; 27: 6407–25.
- Andersen P K, Geskus R B, de Witte T, Putter H. Competing risks in epidemiology: possibilities and pitfalls. Int J Epidemiol 2012; 41: 861–70.
- Beyersmann J, Scheike T H. Classical regression models for competing risks. In: Klein JP, van Houwelingen HC, Ibrahim JG, Scheike TH, editors. Handbook of survival analysis. Boca Raton, FL: CRC Press; 2013. pp. 157–177.
- Beyersmann J, Schumacher M. Letter to the Editor: Misspecified regression model for the subdistribution hazard of a competing risk. Stat Med 2007; 26: 1649–51.
- Fine J P, Gray R J. A proportional hazards model for the subdistribution of a competing risk. JASA 1999; 94: 496–509.
- Gail M H, Pfeiffer R M. On criteria for evaluating models of absolute risk. Biostatistics 2005; 6: 227–39.
- Gillam M H, Salter A, Ryan P, Graves S E. Different competing risks models applied to data from the Australian Orthopaedic Association National Joint Replacement Registry. Acta Orthop 2011; 82: 513–20.
- Grambauer N, Schumacher M, Beyersmann J. Proportional subdistribution hazards modeling offers a summary analysis, even if misspecified. Stat Med 2010; 29: 875–84.
- Holt J. Competing risks analyses with special reference to matched pair experiments. Biometrika 1978; 65: 159–65.
- Jasper L L, Jones C A, Mollins J, Pohar S L, Beaupre L A. Risk factors for revision of total knee arthroplasty: a scoping review. BMC Musculoskelet Disord 2016; 17: 182.
- Keurentjes J, Fiocco M, Schreurs B, Pijls B, Nouta K, Nelissen R. Revision surgery is overestimated in hip replacement. Bone Joint Res 2012; 26: 2389–430.
- Lacny S, Wilson T, Clement F, Roberts D J, Faris P D, Ghali A, Marshall D A. Kaplan–Meier survival analysis overestimates the risk of revision arthroplasty: a meta-analysis. Clin Orthop Relat Res 2015; 473: 3431–42.
- Latouche A L, Allignol A, Beyersmann J, Labopin M, Fine J P. A competing risks analysis should report results on all cause-specific hazards and cumulative incidence functions. J Clin Epidemiol 2013; 66: 648–53.
- Lie S A, Engesaeter L B, Havelin L I, Gjessing H K, Vollset S E. Dependency issues in survival analyses of 55 782 primary hip replacements from 47 355 patients. Stat Med 2004; 23: 3227–40.
- Porcher R. CORR Insights®: Kaplan–Meier survival analysis overestimates the risk of revision arthroplasty: a meta-analysis. Clin Orthop Relat Res 2015; 473: 3443–5.
- Prokopetz J J Z, Losina E, Bliss R L, Wright J, Baron J A, Katz J N. Risk factors for revision of primary total hip arthroplasty: a systematic review. BMC Musculoskelet Disord 2012; 13: 251.
- Puchner S E, Kutscha-Lissberg P, Kaider A, Panotopoulos J, Puchner R, Böhler C, Hobusch G, Windhager R, Funovics P T. Outcome after reconstruction of the proximal tibia: complications and competing risk analysis. PLoS One 2015; 10: e0135736.
- Putter H, Fiocco M, Geskus RB . Tutorial in biostatistics: competing risks and multi-state models. Stat Med 2007; 26: 2389–430.
- R Core Team. R: A language and environment for statistical computing. Vienna: R Foundation for Statistical Computing; 2016. Available from: https://www.R-project.org/.
- Ranstam J, Robertsson O. The Cox model is better than the Fine and Gray model when estimating relative revision risk from arthroplasty register data. Acta Orthop 2017; 88 (6): 578–580.
- Ranstam J, Kärrholm J, Pulkkinen P, Keijo M, Espehaug B, Pedersen A B, Mehnert F, Furnes O. Statistical analysis of arthroplasty data. II. Guidelines. Acta Orthop 2011; 82: 258–67.
- Robertsson O, Ranstam J. No bias of ignored bilaterality when analysing the revision risk of knee prostheses: analysis of a population based sample of 44590 patients with 55298 knee prostheses from the national Swedish Knee Arthroplasty Register. BMC Musculoskelet Disord 2003; 4: 1.
- Van der Pas S L, Nelissen R G H H, Fiocco M. Patients with staged bilateral total joint arthroplasty in registries: immortal time bias and methodological options. J Bone Joint Surg Am 2017; 99: e82(1-8).
- Van Steenbergen L N, Denissen G A W, Spooren A, van Rooden S M, van Oosterhout F J, Morrenhof J W, Nelissen R G H H. More than 95% completeness of reported procedures in the population-based Dutch Arthroplasty Register: external validation of 311,890 procedures. Acta Orthop 2015; 86: 498–505.
- Wang Y, Simpson J A, Wluka A E, Teichtahl A J, English D R, Giles G G, Graves S, Cicuttini F M. Relationship between body adiposity measures and risk of primary knee and hip replacement for osteoarthritis: a prospective cohort study. Arthritis Res Ther 2009; 11: R31.
- Wongworawat M D, Dobbs M B, Gebhardt M C, Gioe T J, Leopold S S, Manner P A, Rimnac C M, Porcher R. Editorial: estimating survivorship in the face of competing risks. Clin Orthop Relat Res 2015; 473: 1173–6.