
Abstract
Background and purpose — Spasticity is often regarded as a major cause of functional limitation in children with cerebral palsy (CP). We analyzed the spasticity development with age in the gastrosoleus muscle in children with CP.
Children and methods — This is a longitudinal cohort study of 4,162 children (57% boys) with CP born in 1990–2015, monitored using standardized follow-up examinations in the Swedish surveillance program for CP. The study is based on 57,953 measurements of spasticity of the gastrosoleus muscle assessed using the Ashworth scale (AS) in participants between 0 and 15 years of age. The spasticity was analyzed in relation to age, sex, and Gross Motor Function Classification System (GMFCS) levels using a linear mixed model. Development of spasticity with age was modeled as a linear spline.
Results — The degree of spasticity increased in most children over the first 5 years of life. At 5 years of age, 38% had an AS level of ≥ 2. The spasticity then decreased for 65% of the children during the remaining study period. At 15 years of age only 22% had AS ≥ 2. The level of spasticity and the rate of increase and decrease before and after 5.5 years of age were higher in children at GMFCS IV–V.
Interpretation — The degree of spasticity of the gastrosoleus muscle often decreases after 5 years of age, which is important for long-term treatment planning and should be considered in spasticity management.
Spasticity and muscle weakness are common manifestations of cerebral palsy (CP; Dev Med Child Neurol 2002; 44(9): 633-40.). The spastic CP subtypes represent 75–80% of the population with CP (Westbom et al. Citation2007). Himmelmann et al. (Citation2007) reported spasticity in 69% of children with dyskinetic CP. There are several definitions of spasticity. The most commonly used is probably the definition by Lance et al. (1980): “a velocity-dependent increase in tonic stretch reflexes (muscle tone) with exaggerated tendon jerks, resulting from hyperexcitability of the stretch reflex, as one component of the upper motor neuron syndrome.” Muscle weakness, present in all individuals with CP, has several etiologies: the CP-specific background, through inactivity, and as a consequence of interventions, i.e., muscle or tendon lengthening (Segal et al. Citation1989).
Spasticity may result in a limited range of active joint motion, with reduced gross and fine motor function and pain. However, spasticity may sometimes improve function by compensating for muscle weakness (Hicks et al. Citation2008).
Several studies have demonstrated that in children with CP the spasticity increases during the first years of life (Mutch et al. Citation1992, Kuban and Leviton Citation1994, Hägglund and Wagner Citation2008). A cross-sectional study using data from 547 children in southern Sweden showed that the degree of spasticity in the gastrosoleus muscle reached a peak at 4–5 years of age then decreased each year up to 12 years of age (Hägglund and Wagner Citation2008).
The Swedish surveillance program for individuals with CP (www.cpup.se) was initiated in 1994 in the south of Sweden. Since 2005, CPUP has been a national health care quality register approved by the National Board of Health and Welfare in Sweden. CPUP covers more than 95% of all individuals with CP in Sweden born in or after 2000 (Hägglund et al. Citation2005, Alriksson-Schmidt et al. Citation2017). CPUP comprises standardized repeated follow-up examinations, including measurement of spasticity according to the modified Ashworth scale (MAS) () (Bohannon and Smith Citation1987).
Table 1. The modified Ashworth scale (MAS)
The previous study from Hägglund and Wagner (Citation2008) included a cross-sectional analysis on a cohort from southern Sweden. Therefore we now analyzed the development of spasticity with age, sex, and gross motor function in the total population of children with CP in Sweden, including a longitudinal analysis.
Children and methods
Children with suspected CP are included in the CPUP program as early as possible, usually before 2 years of age. The diagnosis of CP is confirmed at 4 years of age by a neuropediatrician. Children without CP are then removed from the register. The proportion of children in CPUP without CP is less than 2% (Westbom et al. Citation2007). The definition of CP by Mutch et al. (Citation1992) was used in the early years and was replaced in 2007 with the definition proposed by Rosenbaum et al. (Citation2007). The child’s local physiotherapist classifies his/her gross motor function according to the Gross Motor Function Classification System (GMFCS) (Palisano et al. Citation2008). Children at GMFCS level I are examined once a year up to 6 years of age, then every second year. Those at GMFCS levels II–V are examined twice a year up to 6 years of age, then once a year. The examination includes measurement of muscle tone according to the MAS (Bohannon and Smith Citation1987). Measurement of tone in the gastrosoleus muscle is standardized and performed supine lying with hips and knees extended, described in a manual and recorded on a standard form (www.cpup.se).
In this study, we used all measurements of spasticity of the gastrosoleus muscle at 0–15 years of age in all children in CPUP born between January 1990 and March 2014 that were reported up to September 2016. For the analysis, MAS levels 1 and 1+ were combined into one category corresponding to the original Ashworth scale (AS) as there is a lack of evidence supporting an ordinal relationship between level 1 and level 1+ (Johnson 2001). Measurements from both legs of each child were included in the study, except for those children (21%) with unilateral spastic CP. For these, AS level was summed over the follow-up period and any side with a non-zero sum was subsequently chosen for inclusion. The analysis was performed using the total cohort including children treated with botulinum toxin injections and oral baclofen. Analyses were performed with and without the children treated with selective dorsal rhizotomy (SDR), intrathecal baclofen pump (ITB), and Achilles tendon (gastrosoleus) lengthening (TAL).
Statistics
First, the data were grouped in 1-year intervals and plotted in bar charts according to the last known GMFCS level and sex. The last GMFCS assignment was used for all previous evaluations. Second, to produce a parsimonious model for the somewhat complicated 3-level hierarchical structure of the study data, measurements from 1 leg in each child were chosen for the analysis. The selection was done randomly in those for whom both legs were included. The selected leg was used for all evaluations. For the data selected, a 2-level mixed effects model (Fitzmaurice et al. Citation2004) was fitted with levels for leg and measurement. Development of spasticity with age was modelled using a linear spline with a knot at the age of 5.5. The knot was chosen by means of searching a grid with half year-spacing and subsequent inspection of the likelihood of the resulting model. The knot that yielded the greatest likelihood was chosen for the analysis. The model also included a random intercept (i.e., the AS at the starting point of the follow-up), a random slope for the annual rate of change (ARC) before the age of 5 (ARC < 5.5) and a random slope for the annual rate of change from the age of 5.5 and beyond (ARC ≥ 5.5). The random effects covariance matrix was unstructured, allowing for estimation of all random effect and covariances.
The development of spasticity with age was estimated from the mixed model for each individual child. As a final step, the model was adjusted for differences between sexes and birth years. It also included interaction terms between GMFCS level, ARC < 5.5, and ARC ≥ 5.5 to evaluate the differences in AS development with age for different levels of gross motor function. The differences in ARC between GMFCS levels was tested by fitting 1 model including the GMFCS interaction terms, and 1 without, subsequently testing which model best fit the data, by use of a likelihood ratio test. Furthermore, in order to justify pooling of the data from unilateral cases with those of remaining CP types, an indicator variable was created to identify the unilateral cases. The indicator variable was then included in the final model both as an intercept and as an interaction term together with ARC variables to evaluate possible differences in development between unilateral cases and remaining study participants. As with GMFCS, the difference was evaluated using a likelihood ratio test. A p-value > 0.05 was interpreted as a lack of evidence of a difference in development between unilateral and remaining cases.
Our choice to treat the outcome scale as continuous is based on the general rule of thumb which states that an ordinal scale may approximate a continuous scale when it has 5 levels or more (Norman Citation2010). An important issue using this approach with the current data is that the distributional assumptions of the statistical model, which was developed for continuous outcome data, are fulfilled. To evaluate possible deviations from the model assumptions in terms of non-normal residual distribution, residuals on both levels were examined graphically. In order to evaluate the impact of possible deviations on study conclusions all models were compared with and without the use of Huber–White robust standard errors. To further evaluate the impact of the choice of scale on the study conclusions, a sensitivity analysis was performed comparing the results of our original model with those using a mixed effects logistic regression model (Fitzmaurice et al. Citation2004). Results were additionally compared with and without the use of weights to account for the random selection of one leg in most study participants. All models were fitted using the maximum likelihood approach (Fitzmaurice et al. Citation2004) in Stata v. 14 (StataCorp, College Station, TX, USA).
Ethics, funding, and potential conflicts of interest
The study was approved by the Medical Research Ethics Committee at Lund University (LU-433-99). Verbal consent to use the data for research was provided by all families participating in CPUP. The study was funded by Stiftelsen för bistånd åt rörelsehindrade i Skåne. The authors declare no conflict of interest.
Results
The study was based on 57,953 measurements in 4,162 children (2,381 boys, 1,781 girls). The distribution according to sex and the GMFCS is described in and the distribution of measurements related to age is described in (see Supplementary data). 65 children (1,584 measurements) had been treated with SDR, 67 (1,496 measurements) with ITB, and 430 (8,106 measurements) with TAL. There were 327 children (2,429 measurements) without reported GMFCS level. Most of these children were registered before the introduction of the GMFCS in 1999.
Table 2. Number of children according to sex and GMFCS level
Table 3. Number of measurements according to age and GMFCS level
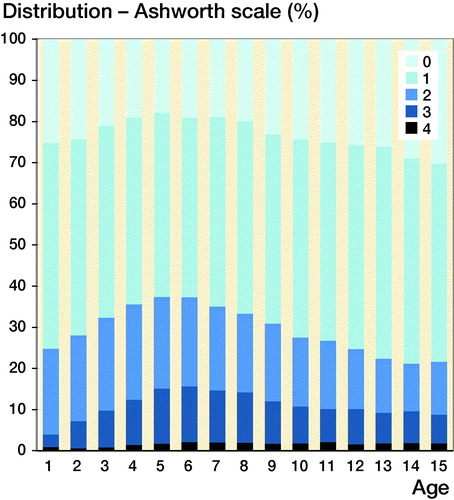
The cross-sectional data showed an increasing proportion of children with AS ≥ 2 up to 5 years of age, followed by a reduced proportion up to 15 years of age (). When those children treated with SDR, ITB, or TAL were excluded, the same pattern was seen, but the proportion of children with AS ≥ 2 was reduced from 38% to 35% at 5 years of age and was 22% and 23%, respectively, at 15 years of age. Boys and girls showed similar development.
Figure 1. Degree of spasticity of the gastrosoleus muscle according to the Ashworth scale relative to age in the total sample of 57,953 measurements in 4,162 children.
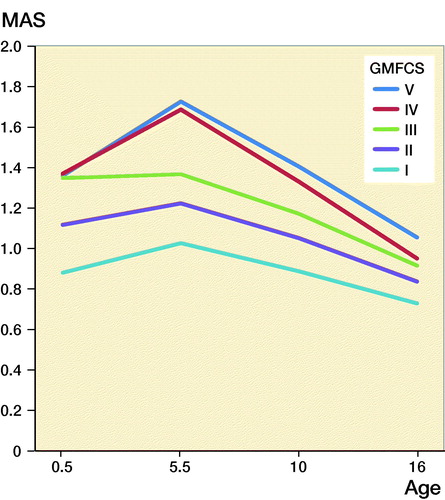
In a mixed model, excluding adjustment variables for sex and birth year, the intercept, i.e., the muscle tone at the starting point of the model, was higher for children at GMFCS levels III–V (1.36–1.37) than those at levels II (1.08) and I (0.85) (). The ARC < 5 was 0.04, (CI 0.03–0.05), which means that the muscle tone increased on average 0.20 AS levels during the period up to 5 years of age. This increase varied from 0.00 in children with GMFCS level III to 0.38 for those at GMFCS V. After 5 years of age the mean ARC ≥ 5 was –0.04 (CI –0.05 to –0.04), describing an average reduction in muscle tone of 0.4 AS levels up to 15 years of age (see ). The standard deviation of ARC < 5 was 0.20 and ARC ≥ 5 0.11 in the study population. The typical development of increasing muscle tone up to 5.5 years of age was estimated from the model to be seen in 57% of the population and decreasing muscle tone after 5 years of age in 68%.
Figure 2. Prediction of the development of spasticity with age in relation to GMFCS level, using a mixed-model analysis.
The results from the likelihood ratio test showed the variation in ARC with GMFCS level to be significant (p < 0.001). There was no significant difference in development between unilateral and remaining cases (p = 0.7).
The mean muscle tone was lower in girls and in children born later in the study period (, see Supplementary data). The differences were small but statistically significant (adjusted for age and GMFCS level).
Table 4. Results of the mixed model analysis
Discussion
Our main finding was that the degree of spasticity, as measured with the Ashworth scale, increased in most children during their first 5 years of life, followed by a decrease during the remaining follow-up period to 15 years of age. The intercept was higher, and the rate of increase and decrease were more pronounced, in children at higher GMFCS levels.
In the statistical analysis, all sensitivity analyses indicated that our conclusions were robust for the choice of analysis method (data not shown). We consequently concluded that our simple approach, without sampling weights or robust standard errors, was appropriate. However, as we chose to model the development with age assuming a constant ARC before and after 5.5 years of age, primarily for reasons of facilitating the statistical analysis, potential variation in the ARC with age may have influenced our results. For example, if the ARC peaked in the first few years of life, children included late in the study period may have been observed to have little or no increase in spasticity with age, making us underestimate the proportion of children with a positive ARC < 5.5. Indeed, the estimated proportion of children increasing before the age of 5.5 was less than those decreasing beyond the age of 5.5, which may appear to be contradictory. However, the question may be clarified by , showing the proportion of measurements in children at 5.5 years with any spasticity to be approximately 80%.
It is well known that children with CP often have low or normal muscle tone in the newborn period and then develop increasing spasticity in the first years of life (Mutch et al. Citation1992, Kuban and Leviton Citation1994). The decrease in spasticity found in this study after a peak at 5 years of age supports our previous findings from southern Sweden (Hägglund and Wagner Citation2008). As a parallel to this development several studies have shown an increase in spasticity over time after stroke or traumatic brain injury in adults (Wissel et al. Citation2013). Not uncommonly the spasticity progresses rapidly in these situations but then declines during the recovery stages (Naghdi et al. Citation2010). The initial development of spasticity after a stroke is hypothesized to be a positive development, suggesting that the nervous system is beginning to initiate repair mechanisms to restore muscle tone and movement (Li and Francisco Citation2015). The exact mechanisms of this process are unclear but are suggested to involve rearrangement and plasticity at both the spinal and cerebral levels. As the exact mechanism behind spasticity in CP are not fully known, it is possible also to assume a similar development of the spasticity in children with CP.
A previous study from our group, based on examinations of children in southern Sweden with CP during 1995–2006 (Hägglund and Wagner Citation2008), showed that 47% had AS ≥ 2 with a peak level at 4 years of age, compared with 38% with a peak level at 5 years of age in the present study. This is explained by the lower levels of spasticity found in the later birth cohorts (, see Supplementary data). The proportion of children in GMFCS IV and V was also lower in the later birth cohorts. This is consistent with findings from epidemiological studies of the CP panorama in western Sweden, which show a decreased rate of bilateral spastic CP and an increased frequency of unilateral spastic CP in recent years (Himmelmann and Uvebrant Citation2014). The mixed model we used compensates for the changes in AS and GMFCS distribution in the different birth cohorts.
When children treated with SDR, ITB, or TAL were excluded, the same trend of spasticity development was observed. The children treated with SDR or ITB represent only 3% of the population and the reduced spasticity after these treatments did not explain the overall decline in spasticity over time. Children treated with botulinum toxin A were included in the analyses. Many of these were treated more than 3 months before their examination. It cannot be excluded that some children treated with botulinum toxin have been reported with a lower muscle tone than they would have had without treatment. A study based on all children in CPUP in Sweden showed that about 20% had been treated with botulinum toxin A injected in the gastrosoleus muscle during the study period 2014–2015 (Franzen et al. Citation2017). The number of children treated with botulinum toxin A in the gastrosoleus muscle according to age at treatment showed the same pattern as the development of spasticity, with a peak at 4–6 years of age. Hence, because most treatments were done during the age period that registered the highest degree of spasticity, compensation for a possible treatment effect would more likely strengthen the pattern of increasing spasticity followed by decreasing spasticity with increasing age.
A spastic muscle will not stretch to the same degree as a muscle with normal tone. Therefore, spasticity may inhibit growth in the length of the muscle, resulting in the development of muscle contracture, with a decreasing range of joint motion (Rang et al. Citation1986). Both spasticity and contracture of the gastrosoleus muscle may result in toe walking. However, spasticity and contracture may also compensate for weakness of the gastrosoleus muscle. The combination of reduced muscle tone and increased body weight with age might result in a change from toe walking to a calcaneal or crouch gait with increased dorsiflexion of the ankle joint during mid-stance. As an effect functional gait can be compromised and a continuous deterioration in walking function in the adult with CP has been reported (Opheim et al. Citation2009). The pros and cons of spasticity and the need for spasticity-reducing treatment may thus vary with age.
The AS is the most widely used instrument for assessing spasticity. Some studies have shown problems with interrater reliability with the scale (Mutlu et al. Citation2008). However, a recent systematic review and meta-analysis concluded that inter- and intra-rater agreement was satisfactory (Meseguer-Henarejos et al. Citation2018). The reliability is slightly higher for the original scale, which was used in the present study (Mutlu et al. Citation2008). Low reliability would, in the absence of systematic errors, only increase the observed variation of the spasticity measurements in the population with increased confidence interval widths.
The validity of the AS has been analyzed in several studies (Scholtes et al. Citation2006). With AS it could sometimes be difficult to distinguish spasticity from contracture, especially at AS levels 3 and 4 (Alhusaini et al. Citation2010). Contractures of the gastrosoleus muscle, measured as a reduced range of foot dorsiflexion, usually increase with age (Nordmark et al. Citation2009). This increasing contracture could underestimate the decline in spasticity as measured with AS after 5 years of age. Contracture could, however, also to some extent contribute to the increased spasticity registered in children up to 5 years of age. The normally increasing degree of spasticity during the first years of life in children with CP is well known and has been confirmed in earlier studies (Mutch et al. Citation1992, Kuban and Leviton Citation1994, Hägglund and Wagner Citation2008).
A limitation in this study was that GMFCS levels were not reported for 327 children (8%), most of whom were followed before the publication of the GMFCS. The development of spasticity was not analyzed in relation to CP subtypes. In CPUP, classification of the CP subtype by a neuropediatrician is missing for about 20% of registrants. In a previous study from southern Sweden, where CP subtype was reported in all cases, children with the spastic and dyskinetic subtypes showed similar development of spasticity (Hägglund and Wagner Citation2008). The cohort of children included in the present study had been followed in CPUP for different lengths of time. This is compensated for in the model where each child’s follow-up time is treated separately.
In summary, spasticity, as measured using the Ashworth scale, increases in most children with CP up to 5 years of age followed by a decrease up to the age of 15 years. This information is important for long-term treatment planning. It also demonstrates the importance of control groups when analyzing spasticity-reducing treatments.
Study design: OL, GH, ERB, PW. Data collection: OL, GH, ERB. Data analysis: GH, PW. Manuscript preparation: OL, GH, ERB, PW.
Acta thanks Thomas Dreher and Freeman Miller for help with peer review of this study.
| Abbreviations | ||
| ARC | = | Annual rate of change |
| AS | = | Ashworth scale |
| CI | = | 95% confidence interval |
| CP | = | Cerebral palsy |
| CPUP | = | Swedish surveillance program for cerebral palsy |
| GMFCS | = | Gross Motor Function Classification System |
| ITB: | = | Intrathecal baclofen pump |
| MAS: | = | Modified Ashworth scale |
| SDR: | = | Selective dorsal rhizotomy |
| TAL: | = | Achilles tendon lengthening |
Supplemental Material
Download PDF (24.3 KB)Related Research Data
Reference
- Prevalence and characteristics of children with cerebral palsy in Europe. Dev Med Child Neurol 2002; 44(9): 633–40.
- Alhusaini A A, Dean C M, Crosbie J, Shepherd R B, Lewis J. Evaluation of spasticity in children with cerebral palsy using Ashworth and Tardieu scales compared with laboratory measures. J Child Neurol 2010; 25(10): 1242–7.
- Alriksson-Schmidt A I, Arner M, Westbom L, Krumlinde-Sundholm L, Nordmark E, Rodby-Bousquet E, Hägglund G. A combined surveillance program and quality register improves management of childhood disability. Disabil Rehabil 2017; 39(8): 830–6.
- Bohannon R W, Smith M B. Interrater reliability of a modified Ashworth scale of muscle spasticity. Phys Ther 1987; 67(2): 206–7.
- Fitzmaurice G M, Laird N M, Ware J H. Applied longitudinal analysis. Hoboken, NJ: Wiley; 2004.
- Franzen M, Hägglund G, Alriksson-Schmidt A. Treatment with Botulinum toxin A in a total population of children with cerebral palsy: a retrospective cohort registry study. BMC Musculoskelet Disord 2017; 18(1): 520.
- Hägglund G, Wagner P. Development of spasticity with age in a total population of children with cerebral palsy. BMC Musculoskelet Disord 2008; 9: 150.
- Hägglund G, Andersson S, Duppe H, Lauge-Pedersen H, Nordmark E, Westbom L. Prevention of dislocation of the hip in children with cerebral palsy: the first ten years of a population-based prevention programme. J Bone Joint Surg Br 2005; 87(1): 95–101.
- Hicks J L, Schwartz M H, Arnold A S, Delp S L. Crouched postures reduce the capacity of muscles to extend the hip and knee during the single-limb stance phase of gait. J Biomech 2008; 41(5): 960–7.
- Himmelmann K, Uvebrant P. The panorama of cerebral palsy in Sweden. XI. Changing patterns in the birth-year period 2003-2006. Acta Paediatr 2014; 103(6): 618–24.
- Himmelmann K, Hagberg G, Wiklund L M, Eek M N, Uvebrant P. Dyskinetic cerebral palsy: a population-based study of children born between 1991 and 1998. Dev Med Child Neurol 2007; 49(4): 246–51.
- Johnson G R. Measurement of spasticity. In: Johnson G R, Barnes M P, editors. Upper motor neurone syndrome and spasticity. Cambridge: Cambridge University Press; 2001. p. 79–95.
- Kuban K C, Leviton A. Cerebral palsy. N Engl J Med 1994; 330(3): 188–95.
- Lance J W. Spasticity: disorder of motor control Miami, FL: Symposia Specialists; Chicago: Year Book Medical Publishers; 1980.
- Li S, Francisco G E. New insights into the pathophysiology of post-stroke spasticity. Front Hum Neurosci 2015; 9: 192.
- Meseguer-Henarejos A B, Sanchez-Meca J, Lopez-Pina J A, Carles-Hernandez R. Inter- and intra-rater reliability of the Modified Ashworth Scale: a systematic review and meta-analysis. Eur J Phys Rehabil Med 2018; 54(4): 576–90.
- Mutch L, Alberman E, Hagberg B, Kodama K, Perat M V. Cerebral palsy epidemiology: where are we now and where are we going? Dev Med Child Neurol 1992; 34(6): 547–51.
- Mutlu A, Livanelioglu A, Gunel M K. Reliability of Ashworth and Modified Ashworth scales in children with spastic cerebral palsy. BMC Musculoskelet Disord 2008; 9: 44.
- Naghdi S, Ansari N N, Mansouri K, Hasson S. A neurophysiological and clinical study of Brunnstrom recovery stages in the upper limb following stroke. Brain Inj 2010; 24(11): 1372–8.
- Nordmark E, Hägglund G, Lauge-Pedersen H, Wagner P, Westbom L. Development of lower limb range of motion from early childhood to adolescence in cerebral palsy: a population-based study. BMC Med 2009; 7: 65.
- Norman G. Likert scales, levels of measurement and the “laws” of statistics. Adv Health Sci Educ Theory Pract 2010; 15(5): 625–32.
- Opheim A, Jahnsen R, Olsson E, Stanghelle J K. Walking function, pain, and fatigue in adults with cerebral palsy: a 7-year follow-up study. Dev Med Child Neurol 2009; 51(5): 381–8.
- Palisano R J, Rosenbaum P, Bartlett D, Livingston M H. Content validity of the expanded and revised Gross Motor Function Classification System. Dev Med Child Neurol 2008; 50(10): 744–50.
- Rang M, Silver R, de la Garza J. Cerebral palsy. In: Lovell W W, Wood R, editors. Pediatric Orthopaedics, 2nd ed. Philadelphia: JB Lippincott; 1986. p. 345–96.
- Rosenbaum P, Paneth N, Leviton A, Goldstein M, Bax M, Damiano D, Dan B, Jacobsson B. A report: the definition and classification of cerebral palsy April 2006. Dev Med Child Neurol Suppl 2007; 109: 8–14.
- Scholtes V A, Becher J G, Beelen A, Lankhorst G J. Clinical assessment of spasticity in children with cerebral palsy: a critical review of available instruments. Dev Med Child Neurol 2006; 48(1): 64–73.
- Segal L S, Thomas S E, Mazur J M, Mauterer M. Calcaneal gait in spastic diplegia after heel cord lengthening: a study with gait analysis. J Pediatr Orthop 1989; 9(6): 697–701.
- Westbom L, Hägglund G, Nordmark E. Cerebral palsy in a total population of 4–11-year-olds in southern Sweden: prevalence and distribution according to different CP classification systems. BMC Pediatr 2007; 7: 41.
- Wissel J, Manack A, Brainin M. Toward an epidemiology of poststroke spasticity. Neurology 2013; 80(3 Suppl 2): S13–19.