
Abstract
Background and purpose — The surgical treatment options for severe knee osteoarthritis are unicompartmental (UKR) and total knee replacement (TKR). For patients, functional outcomes are more important than revision rate. We compared the patient-reported outcome measures (PROMs) of both implant types using a large PROMs dataset.
Patients and methods — We analysed a propensity-matched comparison of 38,716 knee replacements (19,358 UKRs and 19,358 TKRs) enrolled in the National Joint Registry and the English National PROM collection programme. Subgroup analyses were performed in different age groups.
Results — 6-month postoperative Oxford Knee Score (OKS) for UKR and TKR were 38 (SD 9.4) and 36 (SD 9.4) respectively. A higher proportion of UKRs had an excellent OKS (≥ 41) compared with TKR (47% vs 36%) and a lower proportion of poor OKS (< 27) scores (13% vs. 16%). The 6-month OKS was higher in all age groups for UKR compared with TKR, with the difference increasing in older age groups. The mean 6-month EQ-5D score was 0.78 (SD 0.25) and 0.75 (SD 0.25) respectively. The improvement in EQ-5D resulting from surgery was higher for UKR than TKR both overall and in all age groups. All comparisons were statistically significant (p < 0.05).
Interpretation — UKR had a greater proportion of excellent OKS scores and lower proportion of poor scores than TKR. Additionally, the quality of life was higher for UKR compared with TKR. These factors should be balanced against the higher revision rate for UKR when choosing which procedure to perform.
The main treatments for severe knee arthritis that has failed to respond to nonoperative management are total knee replacement (TKR) and unicompartmental knee replacement (UKR). UKR offers advantages over TKR including reduced mortality and medical complications (Liddle et al. Citation2014), and a faster recovery, but the registries report several times higher revision rates (National Joint Registry Citation2018, Australian Orthopaedic Association Citation2019, New Zealand Joint Registry Citation2019). Approximately 50% of knees needing replacement are appropriate for UKR (Willis-Owen et al. Citation2009), yet current usage is only 10% given the higher revision rates (National Joint Registry Citation2018). Although there is some evidence of better functional outcomes for UKR compared with TKR, all previous studies are limited by sample size, particularly for the UKR arm (Baker et al. Citation2012, Liddle et al. Citation2015, Beard et al. Citation2019, Wilson et al. 2019).
In assessing risk, patients need more information than revision rate alone, which is the traditional metric for measuring joint replacement outcome (Goodfellow et al. Citation2010). In recent years there has been a drive towards more patient-directed outcomes. Goodman et al. (Citation2020) found that what mattered most to patients following a knee replacement was relief of pain, restoration of function, and improved quality of life.
We compared the functional outcomes and quality of life of matched TKRs and UKRs, both overall and in different age groups, using data from 3 national datasets.
Patients and methods
Data sources
We performed a retrospective observational study using National Joint Registry for England Wales and Northern Ireland and Isle of Man (NJR) records linked to the Hospital Episodes Statistics Admitted Patient Care records (HES-APC) database and England’s National Patient Reported Outcome Measures (PROMs) database. The NJR was established in 2003 and is now the world’s largest arthroplasty register (National Joint Registry Citation2018). HES-APC records is a database of all admission episodes for patients being admitted to an NHS hospital in England (NHS Digital Citation2020a). From approximately 2009 onwards, NHS-funded knee replacements as part of the PROMs programme have both preoperative and 6-month postoperative PROMs recorded (NHS Digital 2020b). These include the Oxford Knee Score (OKS) (Murray et al. Citation2007) and quality of life index EuroQol 5 Domain index (EQ-5D) (Group Citation1990, Devlin et al. Citation2010).
The choice of time intervals by the PROMs programme was a compromise between appropriate proximity to surgery (to provide timely feedback and to avoid influence of nonoperative factors) and sufficient follow-up for comparison whilst accounting for the postoperative recovery period. Research indicates most improvement in PROMs after joint replacement occurs in the first 6 months, with only minor improvement between 6 months and 1 year (Browne et al. Citation2013). Long-term studies of TKR and UKR have shown that PROMs remain relatively constant after this, at least up to the 10th postoperative year (Pandit et al. Citation2011, Breeman et al. Citation2013, Williams et al. Citation2013).
Data linkage
Between January 1, 2004 and December 31, 2018, 687,910 TKRs and 55,248 UKRs from the NJR dataset (National Joint Registry Citation2018) were successfully linked to the HES APC dataset (NHS Digital Citation2020a) with a full set of baseline demographic and surgical factors needed for matching. Bilateral knee replacements were excluded to allow data linkage. This dataset was merged with the HES PROMs dataset, which started collecting data from approximately 2009 onwards (NHS Digital 2020b). All preoperative PROMs needed to be completed within 3 months prior to surgery or at the latest 1 month postoperatively to be regarded as robust for inclusion. Cases were excluded if either no preoperative anxiety score was available or there was not both a preoperative and postoperative OKS. The demographics of these patients excluded are summarised in (see Supplementary data). There were 254,355 TKRs and 20,347 UKRs meeting the above criteria, making them eligible for inclusion (). Datasets were linked using pseudo-anonymised identification numbers.
Figure 1. Data flowchart of dataset cleaning and merging.
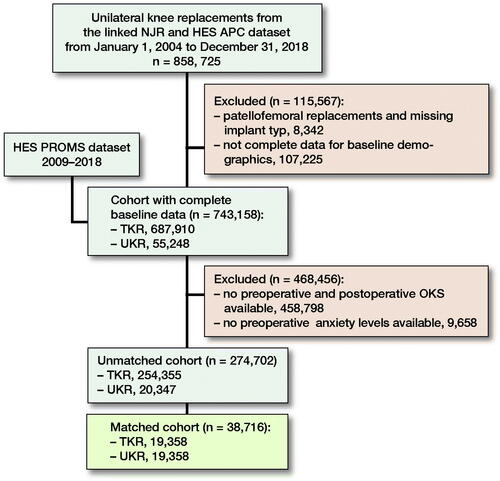
Table 1. Patients without PROMs data (n = 468,456) after linking NJR data to HES PROMs dataset. Values are count (%) unless otherwise specified
Propensity matching
There were substantial differences in baseline characteristics between TKR and UKR groups (). Logistic regression was used to generate a propensity score representing the probability that a patient received a UKR and were generated from patient demographics and surgical factors. All patient and surgical factors in were used for matching, apart from BMI, which had a large proportion of missing data. This is a well-recognised approach (Matharu et al. Citation2017, Matharu et al. Citation2018, Mohammad et al. Citation2020a, Citation2020b). Surgical factors included surgeon caseload, defined as the average number of primary knee replacements performed per year as described previously (Liddle et al. Citation2016, Mohammad Citation2020a). The algorithm used matched 1:1 on the logit of the propensity score with a 0.02-SD calliper width. Greedy matching without replacement was used given its superior performance for estimating treatment effects (Austin Citation2009a). Standardized mean differences (SMDs) were examined both before and after matching to assess for any imbalance between groups, with SMDs of > 10% suggestive of covariate imbalance (Austin Citation2009b). After matching, 38,716 knee replacements (19,358 TKRs and 19,358 UKRs) were included for analysis.
Table 2. Baseline characteristics before matching TKRs and UKRs. Values are count (%) unless otherwise specified
Outcomes of interest
Outcomes of interest were: (1) preoperative OKS and EQ-5D scores, (2) 6-month postoperative OKS and EQ-5D scores, and (3) difference in OKS and EQ-5D scores postoperatively and preoperatively. Subgroup analyses were performed in 4 different age groups as per the NJR (National Joint Registry Citation2018); < 55 years, 55–64 years, 65–74 years, and ≥ 75 years.
The OKS has 12 items relating to knee pain and function, presented as an overall score between 0 and 48 (Murray et al. Citation2007). Mean OKS scores are reported with the proportion attaining excellent (≥ 41), good (34–41), fair (27–33), and poor (< 27) results defined by Kalairajah et al. (Citation2005). Various estimates of the minimal clinically important difference (MCID) for the OKS have been made; this is considered to be between 3 and 5 points (Beard et al. Citation2015). The EQ-5D comprises 5 questions concerning mobility, selfcare, activities of daily living, pain, and anxiety/depression. These answers can be presented as a weighted overall index from 1 (perfect health) to –0.594 (worst possible state) (Group Citation1990, Devlin Citation2010).
Statistics
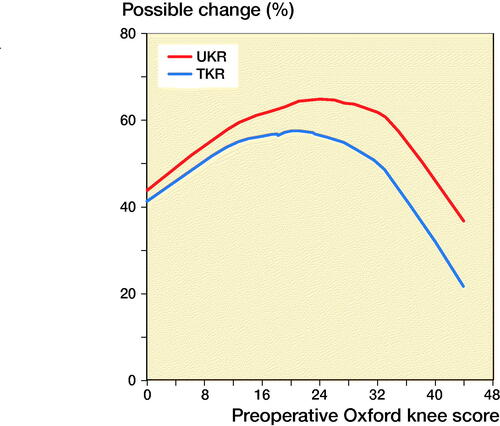
Given that PROMs scores were not normally distributed, appropriate nonparametric tests were used. To compare pre- and postoperative scores within TKR and UKR groups we used the Wilcoxon signed rank test. To compare TKR and UKR scores the Mann–Whitney test was performed. Locally weighted scatterplot smoothing (LOWESS) curves (Cleveland Citation1979) were plotted to explore the relationship between preoperative and postoperative PROMs. For clarity purposes the scatter points are suppressed in the plots presented. The percentage of the possible change (PoPC) was calculated as described previously (Kiran et al. Citation2014). This expresses the actual change attained as a percentage of the possible change, for example for a preoperative OKS of 20 with postoperative score of 40. The actual change is 20 points and the possible change is 48–20 = 28. Therefore the PoPC is 20/28*100 = 71.4%.
All statistical analyses were performed using Stata (Version 15.1; StataCorp, College Station, TX, USA) except propensity score matching, which was performed using R (Version 3.4.0; R Foundation for Statistical Computing, Vienna, Austria). P-values of < 0.05 were considered significant.
Ethics, funding, and potential conflicts of interest
This study was approved by the NJR Research subcommittee and had ethical approval from the South Central Oxford B Research Ethics Committee (19/SC/0292). The linkage of the datasets was approved by the Confidentiality Advisory Group (19/CAG/0054). Financial support has been received from Zimmer Biomet.
HRM was supported by the Henni Mester Scholarship at University College, Oxford University and the Royal College of Surgeons’ Research Fellowship. AJ was supported by the NIHR Biomedical Research Centre at the University Hospitals Bristol NHS Foundation Trust and the University of Bristol.
Results
The unmatched cohort consisted of 254,355 TKRs and 20,347 UKRs with several statistically significant baseline differences between groups (). The matched study group consisted of 38,716 knee replacements (19,358 TKRs, 19,358 UKRs), which were well balanced (). The distribution of the OKS scores is illustrated in .
Figure 2. Distribution of OKS in TKR and UKR groups: (A) preoperative and postoperative line graph; (B) preoperative histogram; (C) postoperative histogram.
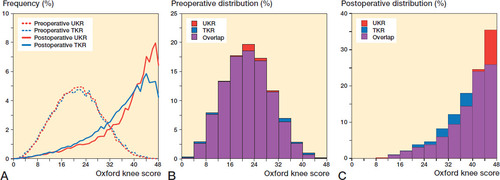
LOWESS curves showed as preoperative OKS increased as did the postoperative score, with similar gradients for both implants. A ceiling effect was visible for the higher preoperative scores (). For any given preoperative score, the postoperative score was higher for UKR than TKR. shows how the PoPC was influenced by preoperative score through LOWESS curves. For all preoperative scores the PoPC was greater for UKR than TKR. The higher the preoperative score the larger the differences.
Figure 3. LOWESS curve showing the relationship between preoperative and postoperative Oxford Knee Score for TKR and UKR groups.
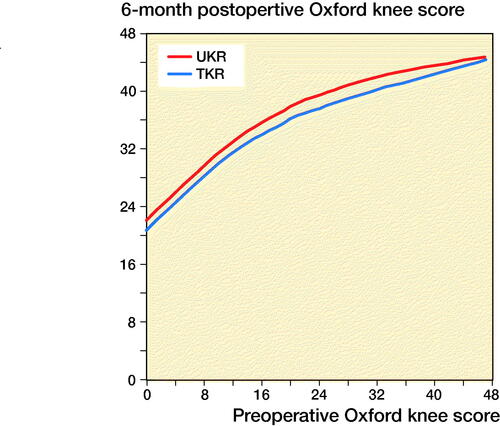
Figure 4. LOWESS curve of percentage of the possible change for TKR and UKR in relation to preoperative OKS.
The mean preoperative OKS for the TKR and UKR groups was similar, at 21 (SD 7.9) and 21 (SD 7.7). Both groups showed statistically significant improvements in their 6-month postoperative scores (p < 0.001) to 36 (SD 9.4) and 38 (SD 9.4) respectively. The UKR group had a statistically significantly higher (p < 0.001) 6-month postoperative score by 1.7 points. The TKR group gained 15 points (SD 9.8) postoperatively whereas the UKR group gained 17 points (SD 9.6), with the difference being statistically significant (p < 0.001) ().
Figure 5. Comparison of mean OKS in matched cohort of TKR and UKRs. Error bars represent SD.
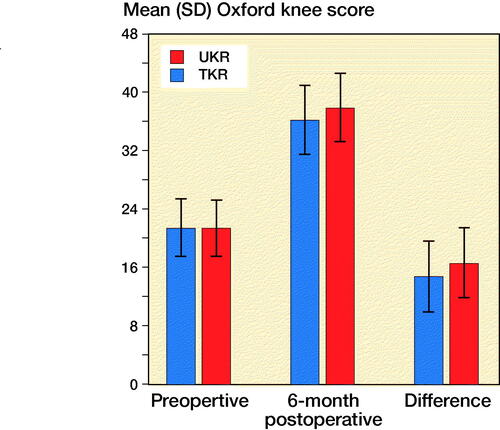
The UKR groups had a statistically significantly higher proportion of excellent OKS compared with TKR (47% vs. 36%, p < 0.001) 6 months postoperatively (). The UKR group had a statistically significantly lower proportion of poor scores than TKR at 6 months postoperatively (13% vs. 16%, p < 0.001) ().
Table 3. Proportion of OKS (Kalairajah et al. classification)
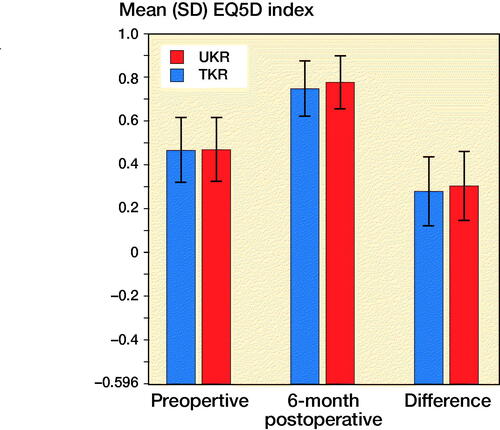
The mean preoperative EQ-5D index for the TKR and UKR groups was 0.47 (SD 0.30) and 0.47 (SD 0.30) respectively with this difference being non-statistically significant (p = 0.3). Both groups showed a statistically significant improvement in their 6-month scores (p < 0.001) to 0.75 (SD 0.25) and 0.78 (SD 0.25) respectively. The TKR group gained 0.28 (SD 0.32) points postoperatively whereas the UKR group gained 0.31 (SD 0.31) with the difference being statistically significant (p < 0.001) ().
Figure 6. Comparison of mean EQ-5D index in matched cohort of TKR and UKRs. Error bars represent SD.
Effect of age on PROMS in the matched cohort
Age groups were stratified into 4 groups as per the NJR: (1) < 55 years (2,569 TKRs, 2,763 UKRs); (2) 55–64 years (6,581 TKRs, 6,256 UKRs); (3) 65–74 years (7,415 TKRs, 7,182 UKRs); and (4) ≥ 75 years (n = 2,793 TKRs, 3,157 UKRs).
Preoperative OKS was similar between TKR and UKR across all age groups. Younger age groups had poorer OKS than older groups, reflecting the higher threshold to operate in younger patients (, see Supplementary data). For both TKR and UKR all age groups showed statistically significant improvements postoperatively compared with preoperatively (p < 0.001) (, see Supplementary data). UKR gained more points postoperatively compared with TKR across all age groups (p < 0.001), with this difference increasing with age (, see Supplementary data). The 6-month OKS was higher in all age groups for UKR compared with TKR (p < 0.001) with the difference increasing in the older age groups (, see Supplementary data).
Table 4. Pre- and postoperative OKS in different age groups for TKR and UKR groups
Preoperatively the proportions of poor, fair, good, and excellent OKS were similar between TKR and UKR for all age groups (, see Supplementary data). At 6 months postoperatively there was a greater proportion of excellent and a lower proportion of poor scores for UKR compared with TKR across all age groups (, see Supplementary data). The proportion of excellent scores was 6%, 12%, 12%, and 10% higher in UKR compared with TKR for the < 55 years, 55–64 years, 65–74 years, and ≥ 75 years groups respectively. The proportion of poor OKS scores was 3–4% lower in UKR compared with TKR across all age groups.
Table 5. Proportion of poor (< 27), fair (27–33), good (34–41), and excellent (≥ 41) OKS (Kalairajah et al. classification) in different age groups for TKR and UKR groups. Values are count (%)
Preoperatively the EQ-5D score was similar between TKR and UKR across age groups (, see Supplementary data). For both TKR and UKR younger age groups had poorer EQ-5D scores than older groups. For both TKR and UKR all age groups showed statistically significant improvements postoperatively compared with preoperatively (p < 0.001) although UKR gained more points postoperatively compared with TKR across all age groups (p < 0.001) except the < 55 group (p = 0.5) (, see Supplementary data). The 6-month EQ-5D was higher in all age groups for UKR compared with TKR (p < 0.001) (, see Supplementary data).
Table 6. Pre- and postoperative EQ5D index scores in different age groups for TKR and UKR groups
Discussion
This is the largest study comparing the PROMs of TKR and UKR and helps provide answers to outcome metrics patients find most important (Goodman et al. Citation2020). After matching, a substantially higher proportion of UKRs had an excellent OKS compared with TKR (47% vs. 36%) and a lower proportion of poor scores (13% vs. 16%). This is important, given that currently 1 in 5 patients who undergo a total knee replacement are dissatisfied with their knee replacement (Beswick et al. Citation2012, Price et al. Citation2018). This number would likely be lower if more patients suitable for UKR had UKR surgery, which by some estimates could be up to 50% (Willis-Owen et al. Citation2009).
The 6-month postoperative OKS of UKR was higher than TKR by 2 points. This difference is similar to the TOPKAT (Beard et al. Citation2019) randomised control trial, suggesting that it is a real difference. Although the magnitude of the difference is below the suggested MCID for the OKS, given the skewed nature of the outcome scores (), together with the ceiling effect of the OKS (Dawson et al. Citation2014), this does not mean that the difference is unimportant. Indeed, its importance is highlighted by finding that the relative risk (1.3) of having an excellent score is 30% higher following a UKR rather than a TKR and the relative risk (0.81) of having a poor score is 20% less following UKR. Additionally, for any given preoperative OKS, a greater PoPC postoperatively was observed for UKR than for TKR (). This was particularly marked in patients with higher preoperative OKS.
In all age groups except the < 55 years group, the average 6-month postoperative OKS was about 2 points greater with UKR than TKR and UKR were about 30% more likely to have an excellent OKS and 20% less likely to have a poor OKS. In the < 55 age group the difference in 6-month postoperative OKS between TKR and UKR groups was only 1.3 points. Also, in this age group UKR were 20% more likely to have an excellent outcome and 12% less likely to have a poor outcome. It is not clear why this is. It may be because the preoperative scores were much lower in this group, and, as can be seen in the graph comparing pre- and postoperative OKS (), with lower preoperative scores the difference between UKR and TKR is smaller. It may also be that in this age group more UKR patients had early stages of osteoarthritis (without bone-on-bone arthritis) and these patients tend not to do well (Kennedy et al. Citation2020a). Despite this, in all age groups UKR have better function than TKR, which justifies using UKR in all age groups. This is particularly important in the elderly as only 4% of knee replacements in patients older than 75 years are UKR (National Joint Registry Citation2018), when approximately one-third of knee replacements are appropriate for UKR (Kennedy et al. Citation2020b). Therefore approximately 10 times as many UKRs could be done in this age group.
This study has also shown UKR offers better 6-month quality of life with EQ-5D scores both overall and on age subgroup analyses. Overall and in all age groups the EQ-5D index was between 0.02 and 0.03 points higher for UKR compared with TKR. This is close to the lower limit of the predicted MCID for the EQ-5D index, which is considered to range between 0.03 and 0.54 points (Coretti et al. Citation2014). When determining quality of life improvement the index is summated annually, so, over the time period the devices are implanted, the differences are likely to be appreciable and well above the MCID.
Our results agree with those reported from Liddle et al. (Citation2015) who found that UKR had higher 6-month OKS and EQ-5Ds than matched TKRs. In contrast they are different from those of Baker et al. (Citation2012) who found no difference in the PROMs gained by UKR and TKR in an analysis adjusted for case-mix and preoperative score. However, there were only 505 UKRs in the Baker study, suggesting that this study was underpowered compared with the Liddle study (3,519 UKRs), which had about 7 times as many UKR, and our study, which had about 40 times as many UKR (n = 19,358).
This is the largest study comparing the PROMs of matched UKR and TKR and the first to perform analyses in different age groups. The main study strengths are that we used an unselected registry sample, which reduces the chances of selection bias. By linking datasets various confounding factors were matched, allowing fair comparison. The main limitation is that this is a retrospective study with 6-month postoperative scores with some evidence existing (Browne et al. Citation2013) of slight further increases (below the MCID) in OKS between 6 and 12 months postoperatively. However, most improvement in PROMs after joint replacement occurs in the first 6 months (Pandit et al. Citation2011, Breeman et al. Citation2013, Browne et al. Citation2013, et al.Williams Citation2013). Additionally, matching can reduce the generalisability of findings, but given we were able to match virtually all the UKR to TKR this is unlikely to be an issue. Finally, we were only able to match using variables collected in the databases. There could be unaccounted variables that could lead to some residual confounding.
Conclusion
Surgeons have traditionally made the decision on which implant to use based on relative revision rates; however, patients are much more concerned about functionality (Goodman et al. Citation2020). This study shows that UKR offers superior functional outcomes and quality of life across all age groups. Although the absolute mean difference in OKS is below the MCID, the likelihood of an excellent OKS is about 30% higher for UKR and the likelihood of a poor OKS is about 20% lower for UKR. We recommend that the findings of this study are discussed with patients alongside the increased risk of UKR revision to help patients make more informed decisions about their care.
HRM, AJ, and DWM designed the study. HRM and DWM analysed the data with statistical support from AJ. HRM, AJ, and DWM helped with data interpretation. HRM wrote the initial manuscript draft, which was then revised appropriately by all authors.
The authors would like to thank the patients and staff of all the hospitals in England, Wales, Northern Ireland and Isle of Man who have contributed data to the National Joint Registry. They are grateful to the Healthcare Quality Improvement Partnership (HQIP), the NJR Research Sub-committee, and staff at the NJR Centre for facilitating this work. The authors have conformed to the NJR’s standard protocol for data access and publication. The views expressed represent those of the authors and do not necessarily reflect those of the National Joint Registry Steering Committee or the Healthcare Quality Improvement Partnership (HQIP), who do not vouch for how the information is presented.
Acta thanks Margareta Hedström for help with peer review of this study.
Supplementary data
Tables 1 and 4–6 are available as supplementary data in the online version of this article, http://dx.doi.org/10.1080/17453674.2021.1956744
- Austin P C. Some methods of propensity–score matching had superior performance to others: results of an empirical investigation and Monte Carlo simulations. Biom J 2009a; 51(1): 171–84.
- Austin P C. Balance diagnostics for comparing the distribution of baseline covariates between treatment groups in propensity–score matched samples. Stat Med 2009b; 28(25): 3083–107.
- Australian Orthopaedic Association. Australian Orthopaedic Association National Joint Replacement Registry (AOANJRR). Hip, Knee & Shoulder Arthroplasty 2019.
- Baker P, Petheram T, Jameson S, Avery P, Reed M, Gregg P, Deehan D. Comparison of patient-reported outcome measures following total and unicondylar knee replacement. Bone Joint J 2012; 94(7): 919–27.
- Beard D J, Harris K, Dawson J, Doll H, Murray D W, Carr A J, Price A J. Meaningful changes for the Oxford hip and knee scores after joint replacement surgery. J Clin Epidemiol 2015; 68(1): 73–9.
- Beard D J, Davies L J, Cook J A, MacLennan G, Price A, Kent S, Hudson J, Carr A, Leal J, Campbell H. The clinical and cost-effectiveness of total versus partial knee replacement in patients with medial compartment osteoarthritis (TOPKAT): 5-year outcomes of a randomised controlled trial. Lancet 2019; 394(10200): 746–56.
- Beswick A D, Wylde V, Gooberman-Hill R, Blom A, Dieppe P. What proportion of patients report long-term pain after total hip or knee replacement for osteoarthritis? A systematic review of prospective studies in unselected patients. BMJ Open 2012; 2(1).
- Breeman S, Campbell M, Dakin H, Fiddian N, Fitzpatrick R, Grant A, Gray A, Johnston L, MacLennan G, Morris R. Five-year results of a randomised controlled trial comparing mobile and fixed bearings in total knee replacement. Bone Joint J 2013; 95(4): 486–92.
- Browne J P, Bastaki H, Dawson J. What is the optimal time point to assess patient-reported recovery after hip and knee replacement? A systematic review and analysis of routinely reported outcome data from the English patient-reported outcome measures programme. Health Qual Life Outcomes 2013; 11(1): 128.
- Cleveland W S. Robust locally weighted regression and smoothing scatterplots. J Am Stat Assoc 1979; 74(368): 829–36.
- Coretti S, Ruggeri M, McNamee P. The minimum clinically important difference for EQ-5D index: a critical review. Expert Rev Pharmacoecon Outcomes Res 2014; 14(2): 221–33.
- Dawson J, Beard D J, McKibbin H, Harris K, Jenkinson C, Price A. Development of a patient-reported outcome measure of activity and participation (the OKS-APQ) to supplement the Oxford knee score. Bone Joint J 2014; 96(3): 332–8.
- Devlin N J, Parkin D, Browne J. Patient–reported outcome measures in the NHS: new methods for analysing and reporting EQ–5D data. Health Econ 2010; 19(8): 886–905.
- Goodfellow J, O’Connor J, Murray D. A critique of revision rate as an outcome measure: re-interpretation of knee joint registry data. Bone Joint J 2010; 92(12): 1628–31.
- Goodman S M, Mehta B, Mirza S Z, Figgie M P, Alexiades M, Rodriguez J, Sculco P, Parks M, Singh J A. Patients’ perspectives of outcomes after total knee and total hip arthroplasty: a nominal group study. BMC Rheumatol 2020; 4(1): 3.
- Group T E. EuroQol—a new facility for the measurement of health-related quality of life. Health Policy 1990; 16(3): 199–208.
- Kalairajah Y, Azurza K, Hulme C, Molloy S, Drabu K J. Health outcome measures in the evaluation of total hip arthroplasties: a comparison between the Harris hip score and the Oxford hip score. J Arthroplasty 2005; 20(8): 1037–41.
- Kennedy J A, Palan J, Mellon S J, Esler C, Dodd C A, Pandit H G, Murray D W. Most unicompartmental knee replacement revisions could be avoided: a radiographic evaluation of revised Oxford knees in the National Joint Registry. Knee Surg, Sports Traumatol, Arthroscopy 2020a: 1–9.
- Kennedy J A, Mellon S J, Lombardi A V, Berend K R, Hamilton T W, Murray D W. Candidacy for medial unicompartmental knee replacement declines with age. Orthop Traumatol Surg Res 2020b; 106(3): 443.
- Kiran A, Hunter D J, Judge A, Field R E, Javaid M K, Cooper C, Arden N K, Committee ONMEUW. A novel methodological approach for measuring symptomatic change following total joint arthroplasty. J Arthroplasty 2014; 29(11): 2140–5.
- Liddle A D, Judge A, Pandit H, Murray D W. Adverse outcomes after total and unicompartmental knee replacement in 101 330 matched patients: a study of data from the National Joint Registry for England and Wales. Lancet 2014; 384(9952): 1437–45.
- Liddle A, Pandit H, Judge A, Murray D. Patient-reported outcomes after total and unicompartmental knee arthroplasty: a study of 14 076 matched patients from the National Joint Registry for England and Wales. Bone Joint J 2015; 97(6): 793–801.
- Liddle A D, Pandit H, Judge A, Murray D W. Effect of surgical caseload on revision rate following total and unicompartmental knee replacement. J Bone Surg Am 2016; 98(1): 1–8.
- Matharu G S, Judge A, Murray D W, Pandit H G. Trabecular metal acetabular components reduce the risk of revision following primary total hip arthroplasty: a propensity score matched study from the National Joint Registry for England and Wales. J Arthroplasty 2017; 33(2): 447.
- Matharu G S, Judge A, Murray D W, Pandit H G. Outcomes after metal-on-metal hip revision surgery depend on the reason for failure: a propensity score-matched study. Clin Orthop Relat Res 2018; 476(2): 245–58.
- Mohammad H R, Matharu G S, Judge A, Murray D W. Comparison of the 10-year outcomes of cemented and cementless unicompartmental knee replacements: data from the National Joint Registry for England, Wales, Northern Ireland and the Isle of Man. Acta Orthop 2020a; 91(1): 76–81.
- Mohammad H R, Matharu G S, Judge A, Murray D W. The effect of surgeon caseload on the relative revision rate of cemented and cementless unicompartmental knee replacements: an analysis from the National Joint Registry for England, Wales, Northern Ireland and the Isle of Man. J Bone Joint Surg Am 2020b; 102(8): 644.
- Murray D, Fitzpatrick R, Rogers K, Pandit H, Beard D, Carr A, Dawson J. The use of the Oxford hip and knee scores. Bone Joint J 2007; 89(8): 1010–4.
- National Joint Registry. National Joint Registry 15th Annual Report. National Joint Registry for England, Wales, Northern Ireland and Isle of Man; 2018.
- New Zealand Joint Registry. Twenty Year Report January 1999 to December 2018. New Zealand Joint Registry; 2019.
- NHS Digital. Hospital Admitted Patient Care Activity 2019-20. Accessed 4/10/2020; 2020a. Available from: https://digital.nhs.uk/data-and-information/publications/statistical/hospital-admitted-patient-care-activity/2019-20.
- NHS Digital. Patient reported outcome measures (PROMs). Accessed 4/10/2020; 2020b. Available from: https://digital.nhs.uk/data-and-information/data-tools-and-services/data-services/patient-reported-outcome-measures-proms.
- Pandit H, Jenkins C, Gill H, Barker K, Dodd C, Murray D. Minimally invasive Oxford phase 3 unicompartmental knee replacement: results of 1000 cases. Bone Joint J 2011; 93(2): 198–204.
- Price A J, Alvand A, Troelsen A, Katz J N, Hooper G, Gray A, Carr A, Beard D. Knee replacement. Lancet 2018; 392(10158): 1672–82.
- Williams D, Blakey C, Hadfield S, Murray D, Price A, Field R. Long-term trends in the Oxford knee score following total knee replacement. Bone Joint J 2013; 95(1): 45–51.
- Willis-Owen C A, Brust K, Alsop H, Miraldo M, Cobb J. Unicondylar knee arthroplasty in the UK National Health Service: an analysis of candidacy, outcome and cost efficacy. Knee 2009; 16(6): 473–8.