
ABSTRACT
Why do voters vote for new political parties? This article tests the microfoundations of why voters support new parties. We examine three perspectives: that citizens vote for new parties because the established parties stand distant from the citizens’ left-right position; that they vote for new parties because the existing parties ignore the issues that the citizens prioritize; or that they vote for new parties because the citizens are cynical about established parties in general. Based on an analysis of more than three decades of Dutch Parliamentary Election Surveys, we conclude that all three factors matter but that ideological distance is by far the strongest predictor.
Introduction
New parties play a vital role in maintaining a vibrant democracy. They function as thermometers for the quality of the political system: their success can be seen as an indicator that established political parties failed (Harmel and Robertson Citation1985). Established parties can fail in different ways: they may fail to focus on issues which voters prioritize (Hug Citation2001; Meguid Citation2005, Citation2008; Stoll Citation2011; Lowery et al. Citation2013), they may fail to offer the policies that voters desire (García-Díaz, Zambrana-Cruz, and Van Witteloostuijn Citation2013) or their way of doing politics may fuel political distrust (Tavits Citation2006; Lago and Martínez Citation2011; Sikk Citation2011).
These factors have been used to explain the aggregate entry rates and electoral support of new parties, but whether these factors matter for the electoral support for new parties at the micro (voter) level has largely remained underexplored. There have been many studies on why individual voters vote for specific new political parties or party families (Van der Brug Citation2003; Arzheimer and Carter Citation2006; Conti and Memoli Citation2015; Passarelli and Tuorto Citation2018; Vidal Citation2018), but these studies cannot be generalized to all new parties as they tend to emphasize the specific political opportunity structure that allows for the development of that specific party. This means that we are missing a crucial link in our understanding of the support for new parties: the micro-level assumptions of the theories of new party support have not yet been tested on new parties in general. Therefore, our main research question is: under what circumstances do voters vote for new parties?
In this paper, we theorize that voters will vote for new parties if they perceive that the latter address deficits in the party system. We focus on three deficits: positional incongruence with the policies offered by extant parties, a failure of established parties to emphasize issues deemed important by voters, and voter dissatisfaction with the quality of democracy. Since new parties have a valence disadvantage compared to established parties, we argue that these deficits are necessary for new parties to set themselves apart. In examining the three deficits, we compare the explanatory power: the Downsian proximity model, the issue competition model and the protest voting model.
As Barnea and Rahat (Citation2011) observe: what qualifies as a “new party” depends on one's research question. Pedersen (Citation1982) has proposed that there are different thresholds which one can employ to identify new parties: one of those is the threshold of representation, new parties lose their novelty once they have gained seats in parliament. We use that definition in this paper and define new parties as parties which have never had national parliamentary representatives and which are not the result of mergers with, or name changes of, parties which held national parliamentary seats in the past.
This article will have the following structure. The first section will discuss three potential drivers of support for new parties. We then explain why we selected the Netherlands as a pathway case. We will subsequently discuss our methods. After testing the hypotheses based on almost three decades of surveys, covering almost 10,000 respondents in eight elections, we will draw our conclusions.
Theory
This article centers on the notion that new parties are successful where established parties fail (Hauss and Rayside Citation1978; Hug Citation2001; Laroze Citation2017). Hug (Citation2001) conceptualizes the emergence of a new party as a strategic game between a group of citizens that decide whether or not to form a new party and the established parties. Starting a party costs time and money. Hence, citizens will only decide to contest the elections as a new party if established parties are unwilling to incorporate their policy demands (Kitschelt Citation1988, 209). Therefore, the primacy lies with the established party’s decision whether to accept or to reject the group’s demands. Integrating new demands is costly, and therefore, the established party will only integrate the demands if the group of citizens would pose a credible electoral threat if they were to run.
We propose that the insights from this model can be extended beyond new party formation. Specifically, we theorize that if established parties manage to incorporate the policy demands of a voter, that voter has no incentive to vote for a new party. Here we build on the idea that if two parties stand equally close, voters will support the one with the highest valence (Schofield Citation2003; Adams and Merrill Citation2009). Compared with established parties, new parties have a valence disadvantage: because of their newness, voters have no expectations about what to expect if the new party is elected. They will only succeed in attracting votes if they are able to offer a better alternative than the established parties. Footnote1 Thus, new party success depends on both characteristics of the new and established parties. In our analyses, we show how the manifesto of the new party relative to the established parties affects its support.
Below we will discuss the three areas where established parties can fail. Here we link specific kinds of failures with different theories put forth in the voting literature: proximity voting, issue voting and protest voting.
Distance
The notion that voters vote for a party on the basis of ideological proximity plays a central role in political science since Downs (Citation1957). His model assumes that the policy preferences of both voters and parties are situated along a left-right dimension. Voters will vote for the party that is closest to them on a left-right dimension (Enelow and Hinich Citation1984). This model has considerable empirical support (Westholm Citation1997; Blais et al. Citation2001).
Building on the proximity model, we expect that a large distance between a voter’s policy position and the policy positions of established parties motivates them to vote for new political parties. Hence, if the parties in parliament stand far away from a group of voters, these voters derive little utility from voting for the established parties. This echoes the political opportunity structure literature, which focuses on the electoral breakthrough of specific new parties or specific new party families. According to this literature, open space for new parties emerges if established parties converge ideologically. Political entrepreneurs may occupy this open space and will be rewarded by voters for doing so. This theory has been used to explain the electoral breakthrough of, and support for, left-libertarian parties (Kitschelt Citation1988), anti-establishment parties (Abedi Citation2002) and radical right parties (Kitschelt Citation1988; Rydgren Citation2004; Arzheimer and Carter Citation2006). In line with these findings, Spoon and Klüver (Citation2019) show that where parties converge, voters are more likely to vote for niche parties. This notion has also been incorporated in game-theoretical models of party competition (Osborne Citation2000). We propose that voters will support new parties when the distance between voters’ ideal point and the policy positions offered by established parties increases.
Distance Hypothesis: the greater the left-right distance between a voter and the political parties in parliament, the more likely it is that the voter votes for a new party.
Attention Deficit
The issue competition model redirects attention from policy positions to the saliency of issues. The idea is that voters cast their ballot for the party that is best able to handle the issues which they find important; that is the party that “owns” this issue. Hence, rather than offering distinct positions on the same dimension of political contestation, parties emphasize the issues that they “own” (Petrocik Citation1996; Bélanger and Meguid Citation2008).
According to Hug (Citation2001:, 87), the emergence of new issues plays an important role in explaining the entry rates and initial success of new parties more specifically. Following Hug’s theoretical lead, the mismatch between the public demand and political supply would lead to the entry of new parties has been popularized in the influential work of Meguid (Citation2005, Citation2008). She ascribes the electoral success of so-called niche parties to the fact that they manage to mobilize issues which cut across the left-right dimension and which were previously neglected by mainstream parties. Green parties, for instance, call attention to the environment. While she does not explain the initial electoral support for niche parties at the moment of their entry, Meguid (Citation2008) empirically shows that established parties can influence existing niche parties’ electoral success by emphasizing or downplaying their issues. This logic suggests that by pre-emptively addressing the issues of niche parties, established parties could also deter the entry of these niche parties. Hence, at the micro level, this would mean that if established parties fail to address the issues that voters prioritize, they risk to sway them towards new political parties.
Attention Deficit Hypothesis: the less attention political parties in parliament spend on the issue which a voter prioritizes, the more likely it is that voter votes for a new party.
Dissatisfaction
Thus far, the rationales behind new party support focused on the policy. Yet, in addition to offering different policies, valence models of electoral competition also stress that parties differ from one another on valence dimensions of politics such as integrity and competence (Schofield Citation2003; Adams and Merrill Citation2009). This echoes the logic of the protest-vote model, positing that voters do not just vote for parties because of shared policy positions and issue priorities, but that they could also consider their discontent with the political elite (Kselman and Niou Citation2011). Voting for parties outside the establishment, such as new parties, has often been understood as an act of voters with low political trust (Miller and Listhaug Citation1990; Bergh Citation2004; Bélanger and Aarts Citation2006). Therefore, the literature on aggregate new party success has often identified general political distrust as an important predictor (Harmel and Robertson Citation1985; Hug Citation2001; Tavits Citation2006; Lago and Martínez Citation2011; Sikk Citation2011). Sikk (Citation2011) shows that new parties can have the same policy positions as established parties and still gain support by attacking established parties on valence dimensions such as corruption. Therefore, we hypothesize that voting for a new party is associated with higher levels of political dissatisfaction.
Dissatisfaction Hypothesis: the more dissatisfied a voter is with politics, the more likely they are to vote for a new party.
Alternative explanations
In the analyses, we control for a number of factors derived from the Michigan approach to voting, which proposes that voters are socialized into voting for particular parties by their social group (Campbell, Gurin, and Miller Citation1954). In the Netherlands, the sociological approach to voting can be related to the social institutions of pillarization (Lijphart Citation1968), where voting was structured by class and religion. Non-religious people are more likely to vote for new parties than religious voters (Arzheimer and Carter Citation2009). During the era of pillarization, working class voters were socialized to vote for social-democratic parties. Hence, people who identify as working class are less likely to vote for new parties. We also included party identification in our models, as voters who feel less attached to a party are more likely to vote for a new party. The explanatory power of the sociological approach to voting has decreased markedly between the 1960s and 1980s (Irwin and Van Holsteyn Citation1989, Citation2008), as the behavior of younger voters was no longer structured by the same societal cleavages as their parents’ behavior. Therefore, people who are born more recently are more likely to vote for a new party.
We also include gender. We expect that women are less likely to vote for a new party, as women on average are more risk-averse (Eckel and Grossman Citation2008). Finally, we include education level without an explicit expectation of the direction of the relationship: on the one hand, V.O. Key argued (Citation1961, 304) that “education serve[s] to indoctrinate people into the more-or-less official political values of the culture”. On the other hand, Dalton (Citation2002) argues that the higher-educated are less loyal to established parties because of their better understanding of politics.
Country selection
This study focuses on the case of the Netherlands, as it qualifies as a pathway case (Gerring Citation2007, 238–239). Such a case is used when one wishes to delve deeper into the underlying mechanism of how a specific theoretical account influences the dependent variable. Here, we are interested in linking micro-level political dissatisfaction, ideological distance and deficit in attention to new party support. The notion that support for new parties is underpinned by political dissatisfaction, ideological distance and a deficit in attention is established at the macro level (Kselman and Niou Citation2011; Lowery et al. Citation2013; Spoon and Klüver Citation2019). Yet, a solid micro-level test of this account is absent so far. That is where a pathway case becomes useful.
By using a pathway case, one seeks to isolate the causal relationship of interest from other confounding variables: we know that the electoral system strongly affects the support for new parties (Cox Citation1997; Hug Citation2001; Tavits Citation2006; Lowery et al. Citation2010). By choosing a proportional electoral system that does not deter voters from voting for new parties, we isolate the micro-level relationships that we are interested in (ideological distance, open issues and political dissatisfaction) from this macro-level factor. The Netherlands elects its parliament in a single district without a threshold. To win a seat in the Dutch parliament, a party only needs to gain one seat (with 0.67% of the vote). Therefore, the extremely proportional electoral system in the Netherlands allows one to evaluate the effect of policy preferences and protest attitudes on new party support, isolated from the effect of the electoral system. Earlier studies have also relied on the Dutch case to study other determinants of new party support (Krouwel and Lucardie Citation2008; Lowery et al. Citation2013; Beyens, Lucardie, and Deschouwer Citation2016). By choosing a single country, we also keep other institutional factors constant. Table A1 in the Appendix lists the parties covered in our analysis.
Methods
We use almost three decades’ worth of data from the Dutch Parliamentary Election Study (DPES) to test our hypotheses (CBS Citation1989; SKON and Thomassen Citation1994; SKON et al. Citation1998, Citation2003, Citation2007, 2010, Citation2012; Van der Meer, Van der Kolk, and Rekker Citation2017).
Our dependent variable is voting for a new party. As discussed in the introduction, we define new parties as those who have never held representation in parliament. That is: the relevant threshold parties need to pass to move from new to “old” is the threshold of representation (Pedersen Citation1982). However, if these parties are mergers or name changes from parties which were previously represented in parliament, we do not code them as new parties. This is in line with studies on new parties, that argue that parties must be started without the help from existing parties to qualify as new (Hug Citation2001, 79–80).Footnote2
We do include splits from parties represented in parliament as new parties, as these do not receive help from established parties. The empirical findings differ depending on which definition of new party one uses. Therefore, we also run our analyses under a more restrictive, alternative operationalization of “new party”: there, we employ on the threshold of authorization and only code parties as new if it is the first time they participate in an election. Hence, extra-parliamentary parties which never had representation are not new under this definition. elucidates these differences. In practice, this implies that we see the left-wing Socialist Party (SP) as a new party in 1977 when it first contested the elections, but not between 1981 and 1994 when it attempted unsuccessfully to win seats.
Table 1. New party types.
To test the Distance Hypothesis (H1), we look at the absolute distance between an individual voter’s left-right position and the position of the most proximate established party.Footnote3 To determine where parties stand, we rely on voter placements, which reflect the individual subjective utility of voters (Westholm Citation1997).Footnote4 This may however lead to an endogeneity problem: the new party voters may be more likely to place the parties which they did not vote for far from their own position, in what is called a rationalization effect (Blais et al. Citation2001). Therefore, we test the robustness of our results based on two additional distance measures which, even though they may seem less reasonable theoretically, exogenize the party positions. Specifically, we constructed two measures that consider the distance between the respondent and the closest established party according to the average placement of parties by all respondents and political experts (Huber and Inglehart Citation1995; Bakker et al. Citation2015; Polk et al. Citation2017).Footnote5
To test the Attention Deficit Hypothesis (H2), we need to know which issues the voter prioritizes and which issues the parties prioritize. As for voters, every DPES since 1989 has included a question where respondents can indicate which issue they feel is “the most important national problem”. The answers that voters give were originally in string format. We have attached substantive codes to their answers using the coding scheme of the Comparative Agenda Project (CAP), which identifies 19 issues. Footnote6 We deliberately chose this scheme, as the Dutch election manifestos were already coded according to the same classification scheme (Green-Pedersen and Otjes Citation2019). All parties with parliamentary representation were included. We compare the party and voter data in two ways. The first approach follows the logic of the positional distance measure above. That is, the variable Maximum Attention reflects the share of attention for the voter’s most important issue by the party that prioritizes this issue the most. Hence, higher values entail a lower attention deficit. Second, we consider the average attention spent by all parties in the system on the voter’s most important issue, the variable Mean Attention. This measure thus captures the position of a voter’s most important issue on the party system agenda (Green-Pedersen and Mortensen Citation2010).Footnote7 To consider that parties of different size are likely to affect party system attention in different ways, we weight the parties’ issue attention scores according to their vote shares obtained in the previous election. In the Appendix, we consider alternative measures of issue attention incongruence. These include a measure that uses the attention parties have spent on the issue the voter prioritizes in their election manifestos for the previous elections, as well as operationalizations that go beyond only the first issue which respondents mention and also consider other issues they could indicate.
Regarding both the positional distance and the issue attention deficit measure, we also consider two slightly different approaches. Instead of just looking at the left-right position or issue emphases of the established parties, we can also compare this to the position and issue emphasis of the new party. That is, in case of party positions, we can look at the difference between the absolute distance to the new party and the absolute distance to the closest established party. A negative score implies that the new party stands further away, a positive score means the reverse and the measure equals zero if both stand equally close. By the same token, we can calculate the difference between (a) the attention that the new party spends on the issue and (b) the established party which emphasizes the respondent’s most important issue the most.
Lastly, to test the Dissatisfaction Hypothesis (H3), we measure political dissatisfaction with a two-item additive political cynicism scale. This measure of political dissatisfaction is available for the entire period.
As introduced above, we add seven control variables: We use the variables for binary gender,Footnote8 classFootnote9, religious self-identification, Footnote10 and education,Footnote11 as well as a polytomous cohortFootnote12 and party identification variables.Footnote13 We recode the cohort variable into a continuous variable where the oldest cohort (1903) is zero and the youngest cohort (1998) is 19. This taps into our expectation that new party voting linearly increases with cohort. An overview of the variables is shown in Table A2 in the Appendix, and Table A3 shows the correlations between them. We run multilevel logistic regressions in which voters are nested within elections. The Appendix also includes a standard (non-multilevel) logistic regression model.
Results
Below we will discuss the results of the regressions testing the hypotheses and consider extensions of these hypotheses. The Appendix contains a large number of robustness tests.
Regression results
presents the results of the regression analysis. We present two models which differ in how we operationalize the attention deficit for a voter’s most important problem. Model 1 taps into the attention level of the party that emphasizes the issue the most, while Model 2 focuses on the salience of the issue on the party system agenda.
Table 2. Multilevel logistic regression analyses.
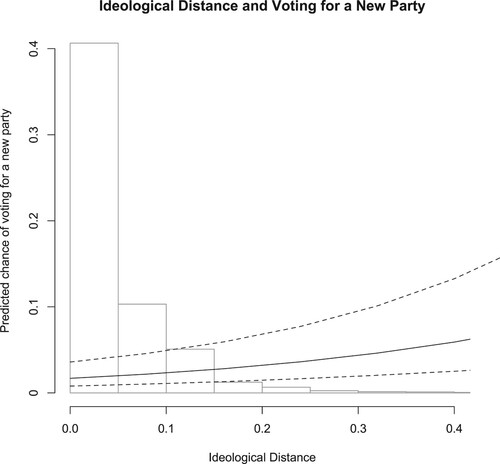
The Distance Hypothesis (H1) holds that voters are more likely to cast their ballot for a new party, the further away the established parties stand from the voter. We indeed find a significant effect of ideological distance. If we go from the mean distance (0.04) to the distance one standard deviation further (to 0.11), the chance to vote for a new party increases from 2.5% to 3.1% (a 23% increase). So, while overall the propensity to vote for a new party remains small (new party voting is a relatively marginal phenomenon), we find that ideological incongruence strongly increases its occurrence. illustrates this effect.
Figure 1. Ideological Distance and Voting for a New Party Predicted probability of voting for a new party with 95% confidence intervals. X-axis depicts the distance between a respondent and the closest established party. All positions were recalculated to a zero-to-one scale, even when scales with different distances had been used. X-axis cut at 0.4 although empirically the maximum value is 0.8, but only 48 cases (0.3%) are higher than 0.4. Based on Model 2. Confidence intervals reflect both the uncertainty in the coefficients and the random intercepts.
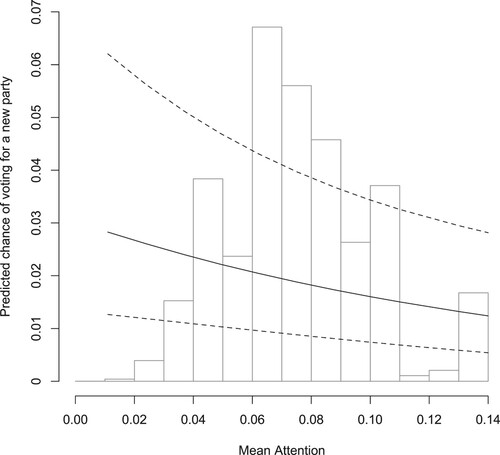
The Attention Deficit Hypothesis (H2) concerns attention incongruence: the idea is that those who prioritize issues which established parties fail to address are more likely to vote for new parties. As for our first measure, Maximum Attention, which only considers the issue attention of the established party that emphasizes the respondent’s issue the most, we find no effect. We do find an effect, based on our second measure, Mean Attention, that focuses on the saliency of the respondent’s issue on the party system agenda. If we move one standard deviation down from the average attention (from 0.08–0.03), the chance of voting for a new party increases from 2.5% to 3.0%; this is an increase of comparable size to the increase we saw for positional distance (a 17% increase). Footnote14 visualizes the effect.Footnote15
Figure 2. Mean Attention and Voting for a New Party. Predicted probability of voting for a new party with 95% confidence intervals. X-axis depicts the weighted mean attention that established party devote to the issue that voters prioritize. Based on Model 2. Confidence intervals reflect both the uncertainty in the coefficients and the random intercepts.
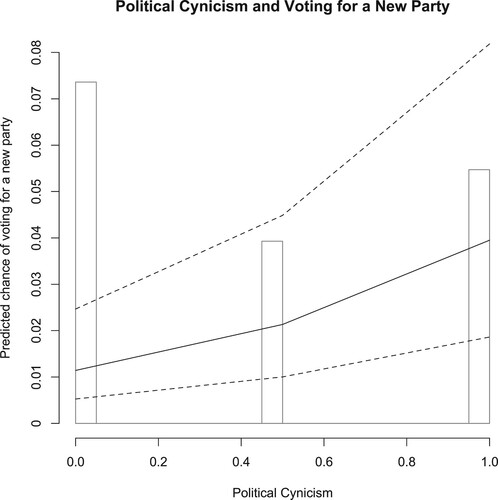
The Dissatisfaction Hypothesis (H3) posits that political distrust is what moves voters towards a new party. We find a strong and significant effect here, as shown in . If we go one standard deviation up from the average cynicism (from 0.44–0.88), the chance of voting for a new party increases from 2.3% to 3.9% (a 69% increase).
Figure 3. Political Cynicism and Voting for a New Party. Predicted probability of voting for a new party with 95% confidence intervals. Based on Model 2. Confidence intervals reflect both the uncertainty in the coefficients and the random intercepts.
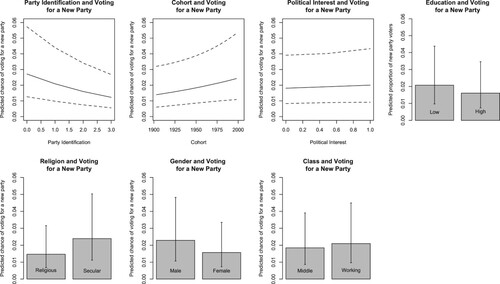
The results for the controls are shown in : voters who identify with a party are significantly less likely to vote for a new party. We find that secular voters are significantly more likely to vote for a new party than religious voters are. In turn, having a diploma of higher education decreases the chance that voters vote for new parties significantly. Next, we find that neither a person’s year of birth nor their social class matters. Finally, women are significantly less likely to vote for new parties than men.
Figure 4. Control variables Predicted chance of voting for a new party with 95% confidence intervals. Based on Model 2. Confidence intervals reflect both the uncertainty in the coefficients and the random intercepts.
Extensions
So far, we have assumed that electoral niches may emerge due to the behavior of established parties. This begs the question of whether new parties actually fill these niches, or whether voters are prepared to try any alternative if they experience incongruence with the mainstream. We can examine this by analyzing the effect of the difference in absolute distance between the left-right position of the new party and the closest established party. Similarly, in case of issue agenda mismatch, we can test whether new parties respond to the difference in attention between the new party on the one hand, and the closest established party or the party system average on the other hand. The DPES only asks respondents to evaluate the policy positions of new parties, if, based on election polls, they are expected to enter parliament. Therefore, this additional analysis is constrained to five relatively successful new parties (LPF, LN, PVV, FvD and DENK) in only three elections (2002, 2006, 2017).
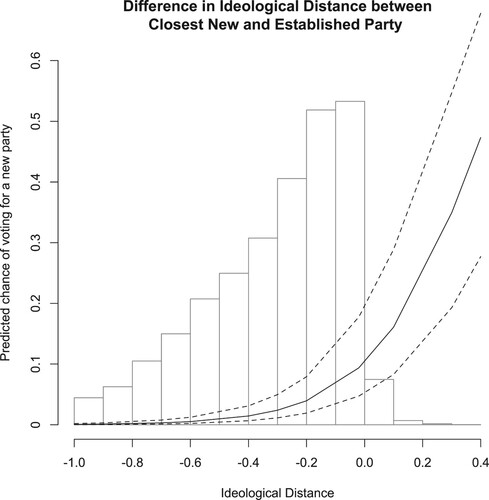
The difference in ideological distance between the closest new party and the closest non-new party is a strong and significant predictor of new party voting, as can be seen in . If respondents place an established party closer to themselves than a new party by more than a quarter of the scale, they have only a 3.6% chance of voting for a new party. Yet, if we move one standard deviation up (to where the new party and the established party stand roughly equidistant), the chance of voting for a new party increases to 11.4%. This is a sizable effect. Yet it is also notable that when the new and established party are equidistant, voters prefer the established party, showing the valance advantage of the established parties.
Figure 5. Difference in Ideological Distance between the Closest New and Established Parties. Predicted probability of voting for a new party with 95% confidence intervals. X-axis depicts the absolute difference between the respondent’s left-right distance to the closest new and the closest established party. Positive values imply a shorter distance to a new party and negative values imply a shorter distance to an established party. Based on Model A20. Confidence intervals reflect both the uncertainty in the coefficients and the random intercepts.
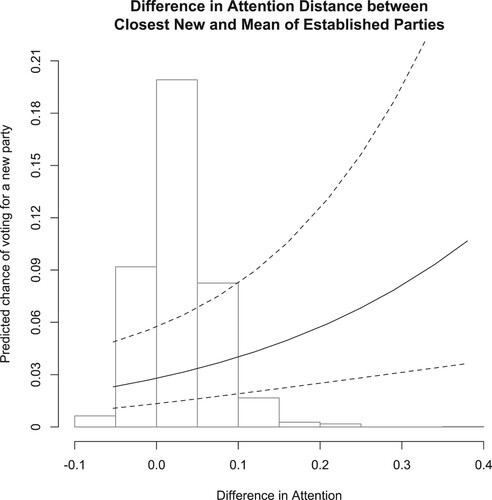
Similarly, the more the new party emphasizes the respondent’s most important issue in comparison with the established parties, the likelier it becomes that the respondent will vote for it. This can be seen in . The average “issue attention” distance between a new party and the weighted mean of the established parties is 0.03. Hence, on average, the attention that new parties devote to the respondent’s most important issue is 3 percentage points higher than the attention of established parties. At that point, a respondent has a 6.5% chance of voting for a new party. If we move one standard deviation up (to a difference in issue attention of 0.075), a respondent has a 7.5% chance of voting for a new party. This effect holds if we consider the mean of the party system instead of the issue attention of the established party which addresses the respondent’s most important issue the most.
Figure 6. Difference in Attention between the Closest New Party and Weighted Mean of Established Parties Predicted probability of voting for a new party with 95% confidence intervals. X-axis depicts the difference in attention devoted to the issue the voters prioritize between (1) the new party that spend most attention to it and (2) the weighted mean of established parties. Positive values imply that a new party spend more attention on the isue and negative values imply an established party spend more attention on the issue. Based on Model A20. Confidence intervals reflect both the uncertainty in the coefficients and the random intercepts.
All in all, we also find support for our hypotheses if we assume that new party voters consider the difference between the policies offered by new and established parties in terms of policy positions and issue emphases.
Conclusion
Where the study of new party support used to be occupied primarily with cross-country institutional differences (Hug Citation2001; Tavits Citation2006), recent research has turned towards more dynamic explanations new party support (Lago and Martínez Citation2011; Lowery et al. Citation2013; Spoon and Klüver Citation2019). Our study provides an important test of the microfoundations of these theories. Specifically, we theorize that voting for new parties is to a large extent connected with the failure of established parties and that new parties are rewarded for addressing deficits in the party system.
Firstly, voters who experience a greater ideological distance between themselves and the established parties are more likely to vote for a new party, in particular if they place this new party closer to themselves than the established parties. While the notion that incongruence between voters and established parties plays a major role in new party formation has been part of game-theoretical models of party competition (Downs Citation1957; Enelow and Hinich Citation1984), this idea has not been tested systematically (Osborne Citation2000; García-Díaz, Zambrana-Cruz, and Van Witteloostuijn Citation2013).
Secondly, we also confirm the Attention Deficit Hypothesis. Scholars like Hug (Citation2001), Lowery et al. (Citation2013), Stoll (Citation2011) and Meguid (Citation2008), each in their own way, theorize that the entry and success of new parties is linked to the emergence of new issues. Yet, thus far, robust micro-level evidence of this was lacking. We provide evidence for the claims made in the literature by means of more fine-grained measures capturing to what extend the political supply caters to the individual-level issue preferences of voters. Our evidence in favor of the Attention Deficit Hypothesis provides an important innovation to the literature of issue competition. So far, this literature has only found limited and conditional evidence for its effect on voting behavior (Van der Brug Citation2004; Bélanger and Meguid Citation2008; Lachat Citation2014). We find evidence that respondents are more likely to vote for a new party, the more their priorities differ from the party system agenda. So, overall, our results suggest that issue agenda mismatch is an important determinant of new party voting.
Thirdly, new party voting can be understood by the valence model of electoral competition (Schofield Citation2003; Adams and Merrill Citation2009). We find support that new parties attract support from voters who are dissatisfied with the way established politicians operate in general. So, each of our hypotheses is confirmed.
What is the relevance of our study beyond the borders of the Netherlands? We selected the Netherlands as a pathway case because we wanted to look at the microfoundations of new party success while keeping the dampening effect of a disproportional electoral system both constant and minimal. In countries with a more restrictive electoral system, we can expect voters to be more likely to vote strategically, which comes at the expense of new parties. However, that is not to say that the three factors identified here (distance to and dissatisfaction with established parties and open issues) are unlikely to play a role. While at the aggregate level, there may be less new party voting in disproportional systems, we can expect that individual voters who do vote for a new party are highly policy-driven (and voting for the new party because it better represents its ideological preferences) or very dissatisfied with the performance of established parties. These are the exact same mechanisms that we identify in this study.
Our study also has limitations. Firstly, to measure general political dissatisfaction, we used a two-item political cynicism scale. This indicator was available for the entire period. Other indicators that measure political trust or satisfaction with democracy are available for a shorter period. Further research may want to delve deeper into which indicator of political dissatisfaction drives new party support the most: political dissatisfaction, as we studied here (also see Vidal Citation2018), or other more complex indicators such as support for stealth democracy (Lavezzolo and Ramiro Citation2018) or voter-level populist beliefs (Akkerman, Mudde, and Zaslove Citation2014).
Secondly, the question of causality arises here: do new parties exploit existing dissatisfaction with democracy or do their electoral campaigns increase dissatisfaction (Van der Brug Citation2003)? Similar questions about causality also come to mind when looking at the measures of issue positions and salience: are these deficits between what voters want and what parties offer created by changing party platforms, changing voter preferences, or both (Spoon and Klüver Citation2019)? Future research may want to employ a panel design to get a grasp of these relationships.
Despite these limitations, our study was the first to test the full range of microfoundations of new party support on new parties in general.
Supplemental Material
Download MS Word (514.5 KB)Acknowledgements
The authors would like to thank Stijn Koenraads for his assistance in data collection and Niki Harringsma for his editorial assistance. This research was supported by Marc van de Wardt’s (completed) research grants from the Research Foundation Flanders FWO (Grant number: FWO16/PDO/198) and the Fund for Scientific Research Wallonia FNRS (Grant number: 28091302).
Disclosure statement
No potential conflict of interest was reported by the authors.
Additional information
Funding
Notes
1 Below we also prove this valence disadvantage empirically: if the new party stands equally close to the respondent as an established party, the respondent will hold a very strong preference for the established party.
2 We include voters who were classified as voting for “other”, as these could be extra-parliamentary parties.
3 We use a single-dimensional approach to the Dutch political space based on theoretical reasons and due to empirical constraints. The theoretical models we seek to test use are unidimensional. Moreover, one could employ a three-dimensional approach looking at an economic, migration and morality dimension. Party positions on these issues are only asked for half parties in parliament in the DPES, which means that we cannot apply the key logic of our paper, namely that the positions of all parties in parliament matters for the entry of new parties, not just the major ones. Moreover, the relevant migration-related questions have only been asked since 1994.
4 All positions were recalculated to a zero-to-one scale, even when scales with different distances had been used.
5 We link the election survey to the closest Expert Survey by year of the survey, choosing a later year if there are ties.
6 Answers that could not be coded in the CAP scheme are marked as missing data.
7 Parties’ issue emphases are derived from election manifestos presented in the same year as the voter survey (so the 2002 manifestos for the 2002 survey).
8 Measured by means of a binary gender variable.
9 The question was whether respondents are a member of religious denomination.
10 With a five-point class ladder reduced to a binary working-class variable.
11 With multi-step education ladders reduced to a binary higher education variable.
12 The lowest level of aggregation possible are five-year cohorts, such as those born between 1998-2003.
13 In four steps.
14 1Mean attention performs better than maximum attention because of theoretical and methodological reasons. Firstly, the mean attention measure reflects the party system agenda (Green-Pedersen and Mortensen Citation2010). It shows how much attention the party system as a whole devotes to the issue the voter prioritizes (Lowery et al. Citation2013). A small party that already spends considerable attention to the issue does not dissuade voters from voting for a new party. Secondly, it may be the case that if the party system attention is high, multiple parties spend attention on the issue, covering multiple perspectives on the issue (Meguid Citation2008). Thirdly, more than a quarter of the respondents who voted for a new party in 2002 voted for the anti-immigration List Pim Fortuyn (LPF). The exceptionally large support for this party is covered by random intercepts in the multilevel model. In a non-multilevel model (Table A5 in the Appendix models A9 and A10), the maximum attention is a significant driver of new party support, because the issue-driven LPF support is not explained by the random intercept.
15 In the Appendix, we look at alternative operationalizations, which all support the patterns found here. Firstly, if we determine the distance to the most proximate established party based on the average placements of parties by all respondents or by experts, we find effects of similar size (Table A6, models A13 and A14).
Secondly, (in Table A5, models A11 and A12), we look at our results if we only consider parties that compete in elections for the first time (that is applying the threshold of authorization). In that case, the same pattern is visible as the one that is presented in .
Thirdly, instead of looking at the first issue which respondents mention, we look at all of the issues they mention as important problems. For the mean attention, we take the average of these. For the Maximum Attention measure, we pick the lowest value out of the levels of attention that the party which spends the most attention to any specific issue devotes to said issue. As before, only the mean-based variable has a significant effect (Table A7, model A17 and A18).
Fourthly, instead of looking at the manifesto for the election the respondent voted in, we could look at the previous manifesto. In that case the analysis does not give significant results. This means that voters react to the priorities of parties expressed in the election they are voting in, not to older information (Table A7, model A21 and A22).
Fifthly, we look at models with interactions between key variables in two clusters (Table A8, models A23 to A28): one looking at the interaction between religion and party identification and our measures of interest and another looking at the interaction between ideological distance and attention. Adding these interactions does not markedly increase model fit.
Sixthly (Table A9, models A29 to A32), we look at models where we differentiate between support for new right-wing populist parties and other new parties. As new right-wing populist parties supply almost half of the new party voters, our results might show why voters vote for these parties instead of for new parties in general. Our results for “other” new parties (mainly of the left and centre) do not differ from those we present in the paper.
Finally, we look at models that include closely related variables (Table A10, models A33 and A34), specifically ideological distance and ideological extremism (that is distance from the centre) and maximum and mean attention. In these models the variables of interest (ideological distance and mean attention) do not perform different from the models we present in the paper.
References
- Abedi, A. 2002. “Challenges to Established Parties: The Effects of Party System Features on the Electoral Fortunes of Anti-Political-Establishment Parties.” European Journal of Political Research 41 (4): 551–583.
- Adams, J., and S. Merrill. 2009. “Policy-seeking Parties in a Parliamentary Democracy with Proportional Representation: A Valence-Uncertainty Model.” British Journal of Political Science 39 (3): 539–558.
- Akkerman, A., C. Mudde, and A. Zaslove. 2014. “How Populist are the People? Measuring Populist Attitudes in Voters.” Comparative Political Studies 47 (9): 1324–1353.
- Arzheimer, K., and E. Carter. 2006. “Political Opportunity Structures and Right-Wing Extremist Party Success.” European Journal of Political Research 45 (3): 419–443.
- Arzheimer, K., and E. Carter. 2009. “Christian Religiosity and Voting for West European Radical Right Parties.” West European Politics 32 (5): 985–1011.
- Bakker, R., C. de Vries, E. Edwards, L. Hooghe, S. Jolly, G. Marks, J. Polk, J. Rovny, M. Steenbergen, and M. Vachudova. 2015. “Measuring Party Positions in Europe: The Chapel Hill Expert Survey Trend File, 1999-2010.” Party Politics 21 (1): 143–152.
- Barnea, S., and G. Rahat. 2011. “‘Out with the old, in with the ‘‘New’’’: What Constitutes a new Party?” Party Politics 17 (3): 303–320.
- Bélanger, É., and K. Aarts. 2006. “Explaining the Rise of the LPF: Issues, Discontent, and the 2002 Dutch Election.” Acta Politica 41 (1): 4–20.
- Bélanger, É., and B. M. Meguid. 2008. “Issue Salience, Issue Ownership, and Issue-Based Vote Choice.” Electoral Studies 27 (3): 477–491.
- Bergh, J. 2004. “Protest Voting in Austria, Denmark, and Norway.” Scandinavian Political Studies 27 (4): 367–389.
- Beyens, S., P. Lucardie, and K. Deschouwer. 2016. “The Life and Death of New Political Parties in the Low Countries.” West European Politics 39 (2): 257–277.
- Blais, A., R. Nadeau, E. Gidengil, and N. Nevitte. 2001. “The Formation of Party Preferences: Testing the Proximity and Directional Models.” European Journal of Political Research 40 (1): 81–91.
- SKON, Brinkman, M., Van der Kolk, H., Aarts, C.W.A.M., and Rosema, M. (2007). Nationaal Kiezersonderzoek 2006. Enschede: DANS.
- Campbell, A., G. Gurin, and W. E. Miller. 1954. The Voter Decides. Santa Barbara: Praeger.
- CBS. 1989. Nationaal Kiezersonderzoek 1989. The Hague: DANS.
- Conti, N., and V. Memoli. 2015. “The Emergence of a New Party in the Italian Party System: Rise and Fortunes of the Five Star Movement.” West European Politics 38 (3): 516–534.
- Cox, G. W. 1997. Making Votes Count: Strategic Coordination in the World’s Electoral Systems. Cambridge: Cambridge University Press.
- Dalton, R. J. 2002. “The Decline of Party Identifications.” In Parties Without Partisans: Political Change in Advanced Industrial Democracies, edited by R. J. Dalton, and M. P. Wattenberg, 19–36. Oxford: Oxford University Press.
- Downs, A. 1957. An Economic Theory of Democracy. New York: Harper.
- Eckel, C. C., and P. J. Grossman. 2008. “Men, Women and Risk Aversion: Experimental Evidence.” Handbook of Experimental Economics Results 1: 1061–1073.
- Enelow, J. M., and M. J. Hinich. 1984. The Spatial Theory of Voting: An Introduction. Cambridge: Cambridge University Press.
- García-Díaz, C., G. Zambrana-Cruz, and A. Van Witteloostuijn. 2013. “Political Spaces, Dimensionality Decline and Party Competition.” Advances in Complex Systems 16 (6): 1350019.
- Gerring, J. 2007. “Is There a (Viable) Crucial-Case Method?” Comparative Political Studies 40 (3): 231–253.
- Green-Pedersen, C., and P. B. Mortensen. 2010. “Who Sets the Agenda and who Responds to it in the Danish Parliament? A new Model of Issue Competition and Agenda-Setting.” European Journal of Political Research 49 (2): 257–281.
- Green-Pedersen, C., and S. Otjes. 2019. “A Hot Topic?” Immigration on the Agenda in Western Europe. Party Politics 25 (3): 424–434.
- Harmel, R., and J. D. Robertson. 1985. “Formation and Success of new Parties: A Cross-National Analysis.” International Political Science Review 6 (4): 501–523.
- Hauss, C., and D. Rayside. 1978. “The Development of new Parties in Western Democracies Since 1945.” In Political Parties: Development and Decay, edited by L. Maisel and J. Cooper, 31–57. Thousand Oaks: SAGE Publications.
- Huber, J., and R. Inglehart. 1995. “Expert Interpretations of Party Space and Party Locations in 42 Societies.” Party Politics 1 (1): 73–111.
- Hug, S. 2001. Altering Party Systems: Strategic Behavior and the Emergence of new Political Parties in Western Democracies. Ann Arbour: University of Michigan Press.
- Irwin, G. A., and J. J. Van Holsteyn. 1989. “Towards a More Open Model of Competition.” West European Politics 12 (1): 112–138.
- Irwin, G. A., and J. J. Van Holsteyn. 2008. “Scientific Progress, Educated Guesses or Speculation? On Some Old Predictions with Respect to Electoral Behaviour in the Netherlands.” Acta Politica 43 (2-3): 180–202.
- SKON, Irwin, G. A., Van Holsteyn, J.J. M., and Den Ridder, J. M. (2003). Nationaal Kiezersonderzoek 2002-2003. Leiden: DANS.
- SKON, Kamp, M., Aarts, C.W.A.M., Van der Kolk, H., and Thomassen, J.J.A. (1998). Nationaal Kiezersonderzoek, NKO 1998. Leiden: DANS.
- Key, V. O. 1961. Public Opinion and American Democracy. New York: Alfred Knopf.
- Kitschelt, H. P. 1988. “Left-libertarian Parties: Explaining Innovation in Competitive Party Systems.” World Politics 40 (2): 194–234.
- Krouwel, A., and P. Lucardie. 2008. “Waiting in the Wings: New Parties in the Netherlands.” Acta Politica 43 (2-3): 278–307.
- Kselman, D., and E. Niou. 2011. “Protest Voting in Plurality Elections: a Theory of Voter Signaling.” Public Choice 148 (3-4): 395–418.
- Lachat, R. 2014. “Issue Ownership and the Vote: The Effects of Associative and Competence Ownership on Issue Voting.” Swiss Political Science Review 20 (4): 727–740.
- Lago, I., and F. Martínez. 2011. “Why New Parties?” Party Politics 17 (1): 3–20.
- Laroze, D. 2017. “Party Collapse and New Party Entry.” Party Politics. Published online ahead of print.
- Lavezzolo, S., and L. Ramiro. 2018. “Stealth Democracy and the Support for new and Challenger Parties.” European Political Science Review 10 (2): 267–289.
- Lijphart, A. 1968. The Politics of Accommodation. Berkeley: University of California Press.
- Lowery, D., S. Otjes, S. Gherghina, A. Van Witteloostuijn, G. Peli, and H. Brasher. 2010. “Unpacking LogM: Toward a More General Theory of Party System Density.” American Journal of Political Science 54 (4): 921–935.
- Lowery, D., A. van Witteloostuijn, G. Peli, H. Brasher, S. Otjes, and S. Gherghina. 2013. “Policy Agendas and Births and Deaths of Political Parties.” Party Politics 19 (3): 381–407.
- Meguid, B. M. 2005. “Competition Between Unequals: The Role of Mainstream Party Strategy in Niche Party Success.” American Political Science Review 99 (3): 347–359.
- Meguid, B. M. 2008. Party Competition Among Unequals: The Role of Mainstream Party Parties in Niche Party Success. Cambridge: Cambridge University Press.
- Miller, A. H., and O. Listhaug. 1990. “Political Parties and Confidence in Government: A Comparison of Norway, Sweden and the United States.” British Journal of Political Science 20 (3): 357–386.
- Osborne, M. J. 2000. “Entry-deterring Policy Differentiation by Electoral Candidates.” Mathematical Social Sciences 40 (1): 41–62.
- Passarelli, G., and D. Tuorto. 2018. “The Five Star Movement: Purely a Matter of Protest? The Rise of a new Party Between Political Discontent and Reasoned Voting.” Party Politics 24 (2): 129–140.
- Pedersen, M. N. 1982. “Towards a new Typology of Party Lifespans and Minor Parties.” Scandinavian Political Studies 5 (1): 1–16.
- Petrocik, J. R. 1996. “Issue Ownership in Presidential Elections, with a 1980 Case Study.” American Journal of Political Science 40: 825–850.
- Polk, J., J. Rovny, R. Bakker, E. Edwards, L. Hooghe, S. Jolly, E. Koedam, et al. 2017. “Explaining the Salience of Anti-Elitism and Reducing Political Corruption for Political Parties in Europe with the 2014 Chapel Hill Expert Survey Data.” Research and Politics, 1–9.
- Rydgren, J. 2004. “Explaining the Emergence of Radical Right-Wing Populist Parties: The Case of Denmark.” West European Politics 27 (3): 474–502.
- Schofield, N. 2003. “Valence Competition in the Spatial Stochastic Model.” Journal of Theoretical Politics 15 (4): 371–383.
- Sikk, A. 2011. “Newness as a Winning Formula for new Political Parties.” Party Politics 18 (4): 465–486.
- Spoon, J. J., and H. Klüver. 2019. “Party Convergence and Vote Switching: Explaining Mainstream Party Decline Across Europe.” European Journal of Political Research 58 (4): 1021–1042.
- Stoll, H. 2011. “Dimensionality and the Number of Parties in Legislative Elections.” Party Politics 17 (3): 405–429.
- Tavits, M. 2006. “Party System Change: Testing a Model of new Party Entry.” Party Politics 12 (1): 99–119.
- SKON and Thomassen, J. J. A. (1994). Nationaal Kiezersonderzoek 1994. Enschede: DANS.
- Van der Brug, W. 2003. “How the LPF Fuelled Discontent: Empirical Tests of Explanations of LPF Support.” Acta Politica 38 (1): 89–106.
- Van der Brug, W. 2004. “Issue Ownership and Party Choice.” Electoral Studies 23 (2): 209–233.
- SKON, CBS, Van der Kolk, H., Aarts, C.W.A.M., and Tillie, J. N. (2012). Nationaal Kiezersonderzoek 2010. Enschede: DANS.
- Van der Meer, T. W. G., H. Van der Kolk, and R. Rekker. 2017. Nationaal Kiezersonderzoek 2017. Amsterdam: DANS.
- Vidal, G. 2018. “Challenging Business as Usual? The Rise of new Parties in Spain in Times of Crisis.” West European Politics 41 (2): 261–286.
- Westholm, A. 1997. “Distance Versus Direction: The Illusory Defeat of the Proximity Theory of Electoral Choice.” American Political Science Review 91 (4): 865–883.