
 ?Mathematical formulae have been encoded as MathML and are displayed in this HTML version using MathJax in order to improve their display. Uncheck the box to turn MathJax off. This feature requires Javascript. Click on a formula to zoom.
ABSTRACT
Electoral competition is a cornerstone of representative democracies. However, measuring its extent and intensity constitutes a challenging task for the discipline. Based on multilevel conceptualizations, we discuss three different measures of political competition (electoral volatility, vote switching, and voters’ availability) and their relation to each other. We argue that electoral volatility and vote switching as indicators of electoral competitiveness tend to misestimate the degree of competition in multiparty systems. As an alternative, we propose focusing on the individual’s propensity to vote for different parties, i.e. electoral availability. Using data provided by the European Election Studies, we compare availability to electoral volatility and vote switching in the framework of necessary and sufficient conditions. Our regression results show that operationalizing electoral competitiveness based on voter availability – which is increasingly retrievable from cross-national voter surveys – helps to avoid type-II errors, i.e. identifying competitive elections as less or non-competitive.
Introduction
Electoral competition is one of the central concepts to describe and analyze the state of democratic (party) systems. Broadly speaking, most researchers see the competitive struggle for votes as the crucial mechanism that ensures the fulfillment of critical functions of representative democracies (Barry Citation1970, 99; Bartolini Citation2002). This literature links political competition to the concept of electoral vulnerability to explain political responsiveness: Electorally vulnerable politicians and parties, the argument goes, will be worried about how citizens react to their actions. As a consequence, they will constantly try to anticipate these reactions by acting responsively. In line with this, the empirical literature regards “vulnerability […] as being basically the same thing as competition” (Bartolini Citation2002, 102).
One core question of political research therefore relates to how we can measure political competition. Previous research has operationalized political competition by focusing on the dynamics of the election results of political parties. Hence, electoral volatility (Pedersen Citation1979) has frequently been used as part of the measure of the intensity of political competition within a given party system (e.g. Immergut and Abou-Chadi Citation2014; Kayser and Lindstädt Citation2015; Hübscher and Sattler Citation2017). Higher volatility levels – the argument goes – increase political parties’ vulnerability, which in turn contributes to higher levels of competitiveness (Przeworski and Sprague Citation1971). Following this assessment, individual-level vote switching can be regarded as a more detailed measure of electoral competitiveness. To give a simple example: If 100 voters of party A switch to party B and 100 voters of party B switch to party A, the net volatility equals zero. The result of many switching voters would be the same as if all voters stayed with their former party. Hence, the volatility measure would imply no competition between the two hypothetical parties, although voter transfers point to a competitive election.
Discussing the individual-level component of political competition, van der Eijk and Oppenhuis (Citation1991, 56-57) go a step further and argue that the “concept of electoral competition is, in its essence, dispositional in character. Consequently, the phenomenon of competition cannot be directly observed. Actual behaviour (i.e. party choice) cannot reveal its existence”. As a result, vote switching as a measure of electoral competition tends to ignore a crucial component of electoral competition: the voters’ possible inclination to vote for multiple parties. Thus, the sheer number of vote switchers gives us little information about how many voters considered switching from one party to another. Following Bartolini (Citation1999), we argue that electoral competition is primarily defined by the openness of voters to cast their vote for multiple political parties, i.e. their availability on the electoral market. “The availability of voters to switch their party/candidate allegiance is crucial because competition theory (…) assumes that a quota of voters, in large masses or in critical minorities, determines through their ‘potential’ defection the anticipated reactions of the elite and therefore their responsiveness to public opinion orientation” (Bartolini Citation1999, 461). The level of competition is thus contingent on potential vote switching, not on actual voting shifts.
In this research note, we propose to operationalize political competition and competitiveness based on the availability of a person’s vote for different political parties (Bartolini Citation1999). Put differently, if a person considers only one party as eligible and does not view any other party as a potential voting option, there is no competition for this person’s vote. However, supposing a person views several parties as a possible voting option, her ballot is highly contested independently of whether she ultimately decides to switch her vote or not. In practical terms, the availability measure thus helps researchers to avoid type-II errors, as electoral volatility and vote switching tend to identify elections as less competitive than when the availability of voters is examined.
We focus on the relation of electoral volatility, vote switching, and voter availability in the framework of necessary and sufficient conditions. represents this relationship: Only some available voters change their party choice and only a fraction of these vote switches translates into net volatility. Therefore, volatility is a subset of switching, which in turn is a subset of availability.
Figure 1. Set-theoretic relationship between volatility, switching, and availability. Source: Based on Bartolini (Citation1999, 467).
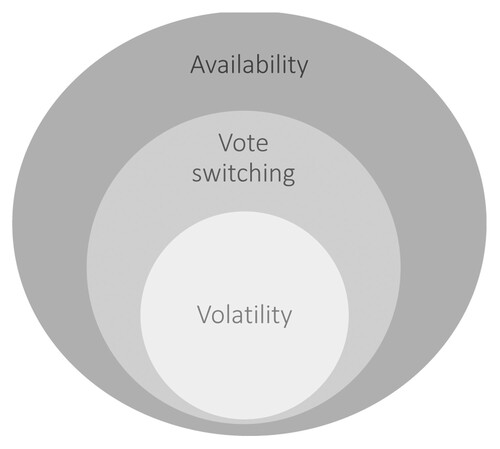
Our two guiding hypotheses for this research note are that vote switching is a necessary but not sufficient condition of volatility (H1) and that availability is a necessary but not sufficient condition of vote switching (H2).Footnote1
Reformulated in empirically observable terms (see also Tsebelis Citation1999), our first hypothesis implies that switching and volatility are positively correlated and that the variance of volatility increases with higher levels of switching. Whereas low levels of vote switchers always lead to low volatility levels, high levels of vote switching can lead to high or low levels of volatility – depending on the extent to which two-way flows cancel each other out. The same applies to our second hypothesis concerning the relationship between vote switching and availability: If availability is necessary but not sufficient for vote switching, both variables correlate positively. Moreover, the variance of switching increases with higher values of availability: high levels of availability can lead to high or low levels of vote switching.
In the next section, we use a cumulated dataset of the six European Election Studies (EES) and compare a measure of electoral availability to vote switching and volatility. Our analysis supports our guiding hypotheses. Based on these results, we propose focusing on the diversity of individual party preferences – the electoral availability of a citizen’s vote – to measure political competition. This approach directly captures the reasoning of those scholars attempting to assess the competitiveness of elections: Voters’ willingness to switch their vote choices is what makes a political situation competitive.
Data and operationalization
To measure individual-level availability, we rely on the operationalization proposed by Wagner (Citation2017). He suggests that a valid measure of an individual’s availability on the electoral market must meet the following criteria. First, if multiple parties feature similar utilities for an individual – i.e. if a voter has similar propensities to vote (PTVs) for various parties – her availability is relatively high.Footnote2 This person is undecided about who to vote for and is therefore approachable for different parties. This undecidedness or indifference occurs “if voters perceive little difference between alternatives” (Aarts and Wessels Citation2005, 78) because those alternatives yield similar utilities in the voters’ eyes. The opposite may result from high affective polarization, i.e. a situation in which “a citizen likes one party and dislikes all others” (Wagner Citation2020, 3). A PTV for one party of, say, 1 and a PTV for another party of 0.9 means higher availability than PTV scores of and
. Second, as a voter has (in most cases) only one vote, the measure should consider the differences of the PTVs of all parties to the most preferred party. Third, higher levels of individual PTVs imply a more intense competition for this individual’s vote. Ceteris paribus, the higher the respective PTVs, the higher the individual’s availability (if
and
the availability score should be higher than if
and
).
Satisfying these criteria, electoral availability calculates as follows:
(1)
(1) where
denotes voters,
stands for the propensity to vote for party i and
refers to the party the person has the highest inclination to vote for.Footnote3
denotes the number of parties between a voter chooses to cast her vote. The resulting measure ranges from 0 (available to only one party) to
(equally available to all parties in the party system). We take the average availability of all individuals within an election to estimate election level availability scores.Footnote4
Availability captures several dimensions that affect citizens’ party preferences. For instance, voters’ availability should be affected by the spatial proximity to political parties. Also, individuals’ propensities to vote for particular political parties makes it possible to consider voters’ utilities as the result of a multitude of further factors (e.g. issue salience, partisanship, leader evaluations, etc.). In contrast to vote switching, this measure does not only focus on voters’ availability to another party than the one they vote for. Instead, it is sensitive to the overall number of parties a citizen considers voting for. Consequently, votes in multiparty systems are, on average, more available than in two-party systems (cf. Wagner Citation2017, 516).
The second variable of interest is vote switching. Here, all voters whose retrospective and prospective vote choices differ at the time of the survey are considered vote switchers.Footnote5 In general, choosing questions of retrospective and future vote choices as a unit of analysis comes with survey-related and methodological problems (Dassonneville and Hooghe Citation2017). However, these issues are of less concern regarding our study as we do not aim to identify actual voting behavior. Instead, our argument refers to the conditional relationship between individual-level availability, vote-switching, and volatility. We measure the aggregate score as the share of vote switchers of the entire voting population.
Electoral volatility constitutes our third variable of interest. Here, we use the formula proposed by Pedersen (Citation1979):
(2)
(2) where i stands for parties,
denotes a party’s vote share, and t indicates elections. Parties’ vote shares have been calculated based on respondents’ retrospective and prospective vote choices. The resulting data can be found in the Appendix ().
We use a cumulated dataset of the European Election Study (EES), which covers 12 member countriesFootnote6 of the European Union from 1989 until 2014. Importantly, the data contains information on citizens’ retrospective/prospective vote choices and their propensity to vote scores. The EES is the only data set providing PTVs for multiple countries and multiple points in time, enhancing the generalizability of our analysis.Footnote7
Empirical analysis
Our analysis proceeds in two steps. First, we test whether the aggregate level of vote switching determines the level of electoral volatility, and second, whether vote switching is a function of individual-level availability. To do so, we regress electoral volatility on vote switching (Hypothesis 1) and vote switching on availability (Hypothesis 2). To control for country-specific factors, we employ a country fixed-effects regression approach. In a second step, we test whether the identified determinants are indeed necessary but not sufficient conditions of the dependent variables by analyzing the residuals of these regressions (Tsebelis Citation1999). However, it is worth mentioning that we do not aim to explain the variance in volatility per se. Instead, we follow an x-centered approach and are thus interested in the effect of one particular independent variable (Gerring Citation2001). Consequently, we do not include every covariate potentially relevant for explaining varying levels of volatility or vote switching. Before discussing our results, and show the bivariate relations of interest.
Figure 2. Scatter plot of volatility and vote switching, 1989-2014.
Note: Dotted line shows 45 degrees line. Dashed line shows bivariate regression line incl. 95% confidence interval.
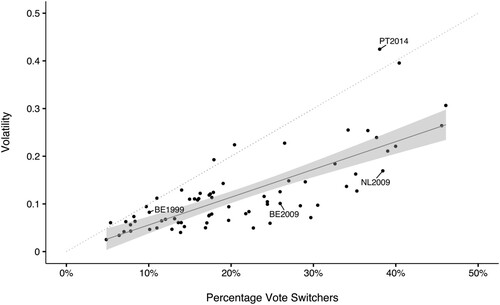
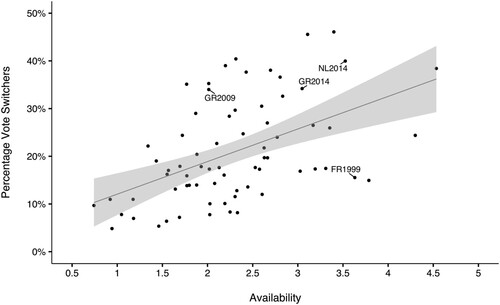
Figure 3. Scatter plot of vote switching and availability, 1989–2014.
Note: Dashed line shows bivariate regression line incl. 95% confidence interval.
The correlation between vote switching and volatility is about .77. The visual inspection of the scatter plot seems to support the first hypothesis. First, (nearly) all cases are below the 45 degrees line, which is a first indication that vote switching is a necessary condition of electoral volatility. Second, higher shares of vote switchers are associated with both higher and lower levels of volatility. At the same time, lower percentages of vote switchers always lead to lower levels of volatility. For example, the Netherlands in 2009 and Portugal in 2014 featured similar levels of vote switching (close to 40 percent). However, only in the latter case did this translate into the highest ever-observed volatility in this country (above .4). In contrast, most switching canceled out in the Netherlands, resulting in a volatility score below .2. In a similar vein, volatility reveals little information about the number of voters that switched their vote from one party to another. Belgium featured similar volatility levels in 1999 and 2009 (between .08 and .1). However, in 1999 the share of vote switchers was 10%, while 10 years later, it was 25%.
These discrepancies between volatility and vote switching lead to the triangular shape typical for necessary but not sufficient conditions, where empirical observations are closer to the regression line on the left-hand side than on the right-hand side, i.e. the residuals increase from low to high levels of vote switching. provides more systematic empirical evidence in favor of our first hypothesis.
Table 1. Testing hypothesis 1 – Vote switching as a necessary but not sufficient condition of electoral volatility
In model 1, we regressed electoral volatility on vote switching.Footnote8 Not surprisingly, there is a significant positive effect of aggregate switching on net volatility. The second model displays the results of a linear regression of the squared residuals (from the first model) on the vote switching variable (see Tsebelis Citation1999). According to our first hypothesis, the residuals should increase with higher shares of vote switchers. This argument is supported since the beta-coefficient is positive and statistically significant at the 1%-level. The residuals of model 1 indeed increase with higher levels of aggregate vote switching.
Model 1a excludes Portugal and Spain 2014, Greece 2009, and Germany 2004, as these cases are outliers according to Cook’s distance criterion. The results are only slightly weaker than in the original model. The Breusch–Pagan/Cook–Weisberg test for heteroscedasticity supports our hypothesis: the null hypothesis of constant error variance is rejected (p-value < 0.001). Consequently, we estimated the regression model with robust standard errors to correct for missing homoscedasticity (model 1b). Although the standard errors slightly increase in this model, the results remain substantively the same. Thus, the presented regression results support our first hypothesis on vote switching as a necessary but not sufficient condition of electoral volatility.
Next, we turn to the relationship between vote switching and availability. As shows, the more available the electorate is, the higher is the share of vote switchers. The bivariate correlation is about .50. Again, we find a triangular shape in the distribution of empirical observations, with observations closer to the regression line on the figure's left-hand side. Lower levels of availability are associated with lower levels of vote switching, but higher availability levels might lead to either higher or lower levels of vote switchers. Comparing France in 1999 and the Netherlands in 2014, we see that both cases show nearly identical aggregated availability scores of about 3.5, while at the same time, the number of switchers differs considerably. Whereas in the Netherlands, 40% of the voters intended to change their party vote from the last to the next election, only about 15% in France had this intention. Conversely, the elections in Greece in 2009 and 2014 show the same amount of vote switchers (34%). But whereas the availability of the Greek electorate in 2014 was relatively high (3.1), it was comparatively low in 2009 (2.0). Vote switching thus overestimates voters’ loyalty in Greece in 2014, therefore underestimating the vulnerability of political parties.
Mirroring , displays the results of the OLS regressions of vote switchers on availability. Once again there is a positive and significant impact of aggregate availability on the level of vote switching (also after excluding four outliers: Italy 1999 and 2004, Ireland 2009, and France 2014 – model 1a). Again, the positive test for heteroscedasticity, together with the results of model 2, confirms our expectation that the residuals increase with higher levels of availability. Thus, the results support our second hypothesis: Higher levels of mean availability in an election are a necessary but not sufficient condition for higher levels of vote switching.Footnote9
Table 2. Testing hypothesis 2 – Availability as a necessary but not sufficient condition of vote switching
In Appendix B, we provide results on the relationship between vote switching and availability based on like-dislike scales provided in the Comparative Study of Electoral Systems (CSES). These models confirm our main finding. The availability measure proposed in this article is thus applicable to widely available post-election studies.
Conclusion
Measuring the intensity of political competition constitutes a central task of political science to answer pressing questions concerning the current working of democracy. Volatility and vote switching are often a part of indicators of electoral competitiveness, and often these measures are precisely the appropriate measure, depending on the research question and design in place. For instance, if one’s research question focuses on the actual number of voters a party has won from other parties, vote switching represents the appropriate approach. However, we have shown that vote switching and electoral volatility might produce type-II errors if used as a measure of electoral competitiveness: While the votes of some citizens are available to multiple parties, only some of these voters actually switch their party choice, and only a subset of this switching translates into volatility. As a result, one might classify an election as non-competitive based on the inspection of net volatility, although the electorate was, in fact, highly available. In this research note, we argued that taking electoral competition to the individual level by focusing on the multiplicity of individual party preferences is helpful for a better understanding of political competition. More concretely, voter availability allows us, if the data is available, to identify varying levels of competition even if no differences in aggregate vote switching or volatility are observable.
Using availability as a measure of political competition comes with various additional advantages related to data collection issues. In contrast to vote switching, availability does not suffer potential problems of biased responses derived from recall questions (van Elsas, Miltenburg, and van der Meer Citation2016; Dassonneville and Hooghe Citation2017).Footnote10 Moreover, vote switching tends to disregard the growing number of non-voters due to biases introduced by social desirability and sampling procedures (Blais and Rubenson Citation2013). We believe that using the proposed availability measure helps us to overcome this unfavorable feature. Next, using the index of availability enables us not only to measure competitiveness in a given election (as the volatility and vote switching measures do) but also during the whole electoral cycle.
Although individual-level data on voters’ party utilities have been scarce in the past, national and cross-national election studies increasingly include questions on individuals’ propensities to vote. Based on this trend, we are optimistic that scholars can use individual-level data in the future if their research interest refers to electoral competition and, therefore, to voters’ availability. Thus, this paper presents a first step towards a better understanding of electoral competition and its valid measurement.
Future research should further focus on the implications of voter availability, as it is easily applicable to more fine-grained constellations of party competition. For instance, availability allows focusing on how many voters of one particular party are open to vote for other political parties. In the past, much research has focused on vote margins and citizens’ vote intentions to operationalize politicians’ vulnerability, and thus the competitiveness of elections (see, e.g. Kuklinski Citation1977; Griffin Citation2006; Hobolt and Klemmensen Citation2008). The concept of voter availability allows for a more detailed understanding of at which point parties need to fear for their survival in office. Next, future work will further deal with the role of voters’ availability as a precondition of voters’ decision to switch their votes. Employing patterns of voter availability in pre-election studies and linking them to vote switching will open a more detailed and comprehensive understanding of political competition.
One additional feature of the availability measure is that – in contrast to vote switching and volatility – it does not automatically increase with the emergence of new parties. It only reflects the rise of new parties if voters consider voting for them and do not abandon their vote propensity for already existing parties. Due to this, the availability measure is easily applicable in the context of less stable, mostly young democracies. We therefore believe that voter availability constitutes a fruitful pathway for the literature dealing with the evolution of party systems (see, e.g. Sikk Citation2005; Tavits Citation2008).
Disclosure statement
No potential conflict of interest was reported by the author(s).
Notes
1 It is worth mentioning, however, that we do not apply a strict understanding of necessary and sufficient conditions. A narrower definition of necessary/sufficient would imply that there are no deviant cases, i.e. no cases with low availability and moderate or high levels of vote switching. Against the background of possible measurement error in the data, we will outline our (more stochastic-oriented) usage of the terms below.
2 The corresponding survey question reads as follows: “How probable is it that you will ever vote for the following parties?” Answers range from 0 (not at all probable) to 10 (very probable). For our purposes, we recoded all PTVs to range from zero to one. Note that in earlier election studies, the numbers ranged from 1 to 10. The rescaling to 0–1 still allows for comparison.
3 Naturally, the party the person has the highest propensity to vote for is not included in the n parties mentioned in the equation.
4 We also calculated the median to take care of potentially influential outliers (cf. ). We thank the anonymous reviewer for raising this point. Additionally, we estimated the models restricting the individual-level sample to voters only (cf. ). Neither specification changed the results significantly.
5 We therefore do not consider non-voters in the following analyses. Note that in elections with highly fluctuating voter turnout, volatility can increase despite moderate levels of vote switching. The depth of documentation of non-voters in the surveys used, however, does not allow for further investigation of this possibility. We thank one anonymous reviewer for making us aware of this point.
6 The dataset contains information on Belgium, Denmark, France, Germany, Greece, Ireland, Italy, Luxembourg, Portugal, Spain, the Netherlands, and the United Kingdom.
7 PTVs do relate to actual voting decisions (cf. van der Eijk et al. Citation2006). In 2014, 76 percent of the voters reported vote choice for the party with the highest PTV in the last national election and 88 percent planned to do so in the next national election. Using European Election data implies considering the second-order nature of these elections (e.g., Giebler and Wagner Citation2015). However, potential distortions due to the second-order nature should equally apply to all three measures. As we are interested first and foremost in the relationship between volatility, vote switching, and availability, the second-order nature of the elections does not affect the substance of our results.
8 Although including survey year dummies to the regression model risks overfitting the model, we did so in a robustness test. Additionally, we added variables controlling for the timing of the European Election Study within the national election cycles However, controlling for these time variables does not change the substantial interpretation of our empirical results (see table A.1 in the Appendix).
9 We also analyzed the relationship between volatility and availability. As expected, availability constitutes a necessary but insufficient condition of volatility. See and as well as in the Appendix. As an additional robustness test, we estimated the relationship without online panel election studies (Italy, Belgium, Ireland, and the Netherlands in 2004). Here, response patterns (e.g., straight lining) might bias the measurement of citizens’ availability. However, the results (not presented here) remain the same once we drop these cases.
10 Note that, at the same time, the collection of citizens’ PTV scores is less costly than collecting panel data which would give us a less biased picture of voters’ switching behavior.
11 The following countries are included in the analysis: Austria, Belgium, Brazil, Bulgaria, Taiwan, Croatia, Czech Republic, Denmark, Estonia, Finland, Germany, Greece, Hungary, Iceland, Israel, Italy, Latvia, Montenegro, the Netherlands, New Zealand, Norway, Portugal, Slovakia, Slovenia, South Africa, Spain, Sweden, Switzerland, Uruguay.
12 As in the main text, outliers were excluded following Cook’s Distance criterion. We also exclude elections with unreasonably high switching scores (above 60%) as we expect errors in the party coding provided by CSES. This includes Bulgaria (2001), Israel (2006 and 2013), Latvia (2010), Poland (2001 and 2005), Romania (2004), and Serbia (2012).
References
- Aarts, Kees, and Bernhard Wessels. 2005. “Electoral Turnout.” In The European Voter. A Comparative Study of Modern Democracies, edited by Jacques Thomassen, 63–83. Oxford: Oxford University Press.
- Barry, Brian. 1970. Sociologists, Economists and Democracy. Chicago: University of Chicago Press.
- Bartolini, Stefano. 1999. “Collusion, Competition and Democracy: Part I.” Journal of Theoretical Politics 11 (4): 435–470.
- Bartolini, Stefano. 2002. “Electoral and Party Competition: Analytical Dimensions and Empirical Problems.” In Political Parties – Old Concepts and New Challenges, edited by Richard Gunther, José Ramón-Montero, and Juan J. Linz, 84–110. Oxford: Oxford University Press.
- Blais, André, and Daniel Rubenson. 2013. “The Source of Turnout Decline: New Values or New Contexts?” Comparative Political Studies 46 (1): 95–117.
- Dassonneville, Ruth, and Marc Hooghe. 2017. “The Noise of the Vote Recall Question: The Validity of the Vote Recall Question in Panel Studies in Belgium, Germany, and the Netherlands.” International Journal of Public Opinion Research 29 (2): 316–338.
- Gerring, John. 2001. Social Science Methodology. A Criterial Framework. Cambridge: Cambridge University Press.
- Giebler, Heiko, and Aiko Wagner. 2015. “Contrasting First- and Second-Order Electoral Behaviour: Determinants of Individual Party Choice in European and German Federal Elections.” German Politics 24 (1): 46–66.
- Griffin, John D. 2006. “Electoral Competition and Democratic Responsiveness: A Defense of the Marginality Hypothesis.” The Journal of Politics 68 (4): 911–921.
- Hobolt, Sara Binzer, and Robert Klemmensen. 2008. “Government Responsiveness and Political Competition in Comparative Perspective.” Comparative Political Studies 41 (3): 309–337.
- Hübscher, Evelyn, and Thomas Sattler. 2017. “Fiscal Consolidation Under Electoral Risk.” European Journal of Political Research 56 (1): 151–168.
- Immergut, Ellen M., and Tarik Abou-Chadi. 2014. “How Electoral Vulnerability Affects Pension Politics: Introducing a Concept, Measure and Empirical Application.” European Journal of Political Research 53 (2): 269–287.
- Kayser, Mark Andreas, and René Lindstädt. 2015. “A Cross-National Measure of Electoral Competitiveness.” Political Analysis 23 (2): 242–253.
- Kuklinski, James H. 1977. “District Competitiveness and Legislative Roll-Call Behavior: A Reassessment of the Marginality Hypothesis.” American Journal of Political Science 21 (3): 627–638.
- Pedersen, Mogens N. 1979. “The Dynamics of European Party Systems: Changing Patterns of Electoral Volatility.” European Journal of Political Research 7 (1): 1–26.
- Przeworski, Adam, and John Sprague. 1971. “Concepts in Search of Explicit Formulation: A Study in Measurement.” Midwest Journal of Political Science 15 (2): 183–218.
- Sikk, Allan. 2005. “How Unstable? Volatility and the Genuinely new Parties in Eastern Europe.” European Journal of Political Research 44 (3): 391–412.
- Tavits, Margit. 2008. “On the Linkage Between Electoral Volatility and Party System Instability in Central and Eastern Europe.” European Journal of Political Research 47 (4): 537–555.
- Tsebelis, George. 1999. “Veto Players and Law Production in Parliamentary Democracies: An Empirical Analysis.” American Political Science Review 93 (3): 591–608.
- Van Der Eijk, Cees, and Erik V. Oppenhuis. 1991. “European parties' performance in electoral competition.” European Journal of Political Research 19 (1): 55–80.
- van der Eijk, Cees, Wouter van der Brug, Martin Kroh, and Mark Franklin. 2006. “Rethinking the Dependent Variable in Voting Behavior: On the Measurement and Analysis of Electoral Utilities.” Electoral Studies 25 (3): 424–447.
- van Elsas, Erika J., Emily M. Miltenburg, and Tom W.G. van der Meer. 2016. “If I Recall Correctly. An Event History Analysis of Forgetting and Recollecting Past Voting Behavior.” Journal of Elections, Public Opinion and Parties 26: 253–272.
- Wagner, Aiko. 2017. “A Micro Perspective on Political Competition: Electoral Availability in the European Electorates.” Acta Politica 52 (4): 502–520.
- Wagner, Markus. 2020. “Affective Polarization in Multiparty Systems.” Electoral Studies. doi:10.1016/j.electstud.2020.102199.
Appendices
Replication material is available in Harvard Dataverse at https://dataverse.harvard.edu/dataset.xhtml?persistentId=doi:10.7910/DVN/1LYGLD.
Appendix A: Robustness tests and data
Table A.1. Results for Tables 1 and 2 with country and time dummies including time to control for second-order effects
Figure A.1. Scatter plot of volatility and availability, 1989-2014
Note: Dashed line shows bivariate regression line incl. 95% confidence interval.
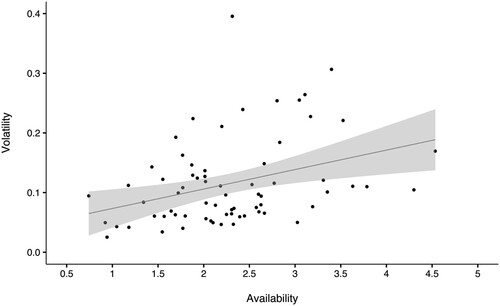
Table A.2. Testing the implication from hypotheses 1 and 2 – Availability as a necessary but not sufficient condition of volatility
Table A.3. Results for Table A2 including time to control for second-order effects
Table A.4. Data
Table A.5. Testing hypothesis 2 – Availability as a necessary but not sufficient condition of vote switching: median availability instead of mean availability
Table A.6. Testing hypothesis 2 – Availability as a necessary but not sufficient condition of vote switching: availability calculated without nonvoters in the last national election
Appendix B: Replication with CSES data
We replicated our results on the relationship between vote switching and availability based on like-dislike scales provided in most post-election surveys. We use the CSES Integrated Module Dataset, which covers elections around the world since the early 1990s. In contrast to the European Election Studies, CSES provides like-dislike scores for the most relevant political parties in a particular election. One advantage of the CSES data is that the country set goes beyond highly established West European party systems. If we find similar effects as provided in the main model, while including elections from countries such as Brazil, Israel, Uruguay, South Africa, or New Zealand, this should strengthen the external validity of our findings.
The corresponding survey question reads as follows:
“I’d like to know what you think about each of our political parties. After I read the name of a political party, please rate it on a scale from 0 to 10, where 0 means you strongly dislike that party and 10 means that you strongly like that party. If I come to a party you haven’t heard of or you feel you do not know enough about, just say so.”
Making use of CSES data might affect the internal validity of the measurement of political competitiveness. First, voters’ judgment on the likeability of particular political parties might differ from the propensity to vote for the same party. Consider the following example: A voter positions herself to the left of center of a particular party system and is closely aligned with a social democratic party. Consequently, she will only vote for this party. However, she might like other leftist parties as she prefers a leftist coalition government. At that point, not only the propensity to vote and like-dislike scores for the other leftist parties will differ from each other. The corresponding availability score will also be higher if we make use of like-dislike scales. At the same time, availability scores might be biased in the other direction. Imagine that a voter is critical of all political parties in a party system and indicates low likeability scores for all parties. Nevertheless, the voter might indicate higher propensities to vote for particular parties as he considers voting a civic duty. In that case, estimates based on like-dislike scores will underestimate the resulting availability.
Second, CSES provides a broad collection of post-election surveys. It is important to note that voters’ evaluation of parties' likeability might be affected by the election results or following coalition talks themselves. Hence, post-election bias possibly affects the measurement.
Third, CSES includes numerous elections that took place in non-democratic settings. We exclude those elections that are classified as “partly free” or “not free” according to the Freedom ranking provided by Freedom House (Albania, Hong Kong, Thailand, the Philippines, and Turkey).Footnote11 Moreover, we also exclude elections in highly unstable party systems, i.e. elections in which at least three out of the six most successful political parties did not contest the previous election (Poland 2011 and Slovenia 2011). The emergence of new parties (but also the formation of electoral alliances) increases aggregate vote switching independent of voters' actual availability. In these cases, vote switching can no longer be regarded as a function of availability.
shows the results if vote switching is regressed on the availability scores derived from CSES’s like-dislike scores.Footnote12 By and large, our main findings are confirmed. Availability has a positive and significant effect on vote switching. Moreover, the effect of availability on the first regression's residuals is also positive and statistically significant.
Table A.7. Results for availability derived from like-dislike scales (CSES)