
 ?Mathematical formulae have been encoded as MathML and are displayed in this HTML version using MathJax in order to improve their display. Uncheck the box to turn MathJax off. This feature requires Javascript. Click on a formula to zoom.
ABSTRACT
Election forecasting is a growing enterprise. Structural models relying on “fundamental” political and economic variables, principally to predict government performance, are popular in political science. Conventional wisdom though is these standard structural models fall short in predicting individual blocs’ performance and their applicability to multiparty systems is restricted. We challenge this by providing a structural forecast of bloc performance in Ireland, a case primarily overlooked in the election forecasting literature. Our model spurns the economic and performance variables conventionally associated with structural forecasting enterprises and instead concentrates on Ireland’s historical party and governance dynamics in the vein of testing whether these patterns alone offer solid predictions of election outcomes. Using Seemingly Unrelated Regression (SUR), our approach, comprising measures of incumbency, short-term party support, and political and economic shocks, offers reasonable predictions of the vote share performance of four blocs: Ireland's two major parties, Fianna Fáil and Fine Gael, Independents, and the Left bloc combined across 20 elections spanning 60 years.
Introduction
"The best qualification of a prophet is to have a good memory".
George Saville, Marquis of Halifax, English Statesman.
There are three principal means of predicting elections: markets, polls, and models. Markets are based on investors – people placing bets on elections through bookmakers (Gallagher Citation2008; Rosenbaum Citation1999) or buying stocks in markets like The Iowa Electronic Market (e.g. Erikson and Wlezien Citation2008; Kou and Sobel Citation2004). Polls involve a seemingly representative sample of voters being asked who they intend to vote for, with these intentions aggregated and serving as a guide to the outcome. Another dimension of this approach is citizen forecasting (e.g. Murr Citation2016; Lewis-Beck and Skalaban Citation1989). Instead of relying on vote intention, it focuses on who citizens think will win. The third approach – structural models - relies on so-called fundamental indicators to predict. Primarily, it focuses on incumbent governments’ performance and is often referred to as “The Iowa Model”, in homage to the scholars who devised it (Lewis-Beck, Belanger, and Fauvelle-Aymer Citation2008). It posits government performance is a function of political economic variables – government satisfaction and/or leader popularity – macro measures usually gleaned from representative citizen surveys, short-term economic performance indicators, and longevity in office. Models have proved robust in foretelling government performance in several states (e.g. Aichholzer and Willmann Citation2014; Bellucci Citation2010; Dassonneville, Lewis-Beck, and Mongrain Citation2017; Nadeau and Lewis-Beck Citation2020; Quinlan and Lewis-Beck Citation2021; Norpoth and Gschwend Citation2010; Abramowitz Citation2008; Lewis-Beck and Tien Citation2008, Citation2020).
Models have principally concentrated on estimating government performance in elections. This approach is suited to predicting in two-party/bloc systems. But in multiparty systems the outgoing government's performance is only one element of the story. To gain a better insight into election outcomes, we need to know how individual blocs perform regardless of incumbency status. Some argue estimates of individual bloc performances from models are unworkable with a 2015 (Walther Citation2015, 2) article concluding: “pure structural models are difficult to apply in the multiparty context. To accurately forecast the results of all parliamentary parties it appears necessary to include some kind of polling data in the model.” In this contribution, we challenge this premise somewhat. While some modeling forays have estimated individual actor performance (e.g. Mongrain Citation2021; Jérôme, Jérôme-Speziari, and Lewis-Beck Citation2017; Stegmaier and Williams Citation2016), most have employed a synthetic approach when doing so – i.e. combining models and opinion polls. Our paper is in the modeling tradition but with a twist – a structural model prediction of bloc performance which spurns any measure of public opinion (e.g. leader or government satisfaction or issue saliency) or recent economic performance. With this Political History Model, our goal is in the vein of the Marquis of Halifax's sentiment that prophets need “a good memory”, as we explore whether polities’ historical party, governance, and institutional dynamics alone offer a reasonable guide to actors’ electoral prospects. Our contribution eschews the conventional structural approach of many by estimating the performance of multiple actors. And we apply it to Ireland, a relatively underexplored case when it comes to election forecasting (exception Quinlan and Lewis-Beck Citation2021).
Our objective is not to purely offer a structural forecasting model of bloc performance in Ireland, novel as that is. Just as critical is establishing if a polity's medium and longer-term structural forces can offer reliable guidance on future elections. Political commentary often assumes particular patterns of behavior repeat themselves or have longevity. For example, aphorisms like governments tend to lose special elections or parties having a ceiling or base level of support, to particular historical events, like German reunification in 1990, or the introduction of the Voting Rights Act in the USA in 1965, are assumed to have enduring implications for the vote. Our goal is to see if such dynamics alone can assist us in constructing a reasonable prediction model of actor performance in future elections.
Ireland offers the ideal testing ground for a model-inspired bloc forecast. It shares many advanced democracies’ trademarks – a multi-party system, coalition governments the norm, and increased electoral volatility. Yet, until recently, Ireland was a beacon of stability with the party system dominated by two parties – Fianna Fáil and Fine Gael, mirroring the situation of other democracies where dominant parties have been losing support. Ireland also stands out for its use of the single transferable vote (STV).
We use Seemingly Unrelated Regression (Zellner Citation1962) which allows us to model support of Fianna Fáil, Fine Gael, Independents (an essential bloc in Ireland – see Weeks Citation2016) and a combination of leftist parties (Left bloc). We demonstrate with appropriate lead time, the Political History Model provides credible estimates of these four blocs’ performance in Irish general elections between 1951 and 2020, although the model admittedly performs better in some contests than others and accurately forecasts some blocs better (Fianna Fáil/Independents) than others (Fine Gael/Left). The model’s parsimony, its replicability, and its sufficient lead-in time are all pluses (Lewis-Beck Citation2005). Coupled with its reasonable accuracy, these dynamics alone have some value in the election forecasting arena in Ireland.
Theory
The traditional structural forecasting model
Model forecasting has its roots in the United States (Abramowitz Citation2008; Cuzán and Bundrick Citation1999; Lewis-Beck and Rice Citation1992) and France (e.g. Lewis-Beck Citation1995). Modelers assume elections are plebiscites on incumbent government performance (Tufte Citation1975) and their fortunes will be determined by economic and political performance during their term of office. This strategy's main attraction vis-à-vis opinion polls or markets is modelers work from a theoretical framework. Modelers focus on indicators known to correlate with vote and expect voters to be retrospective (Key Citation1966; Fiorina Citation1981) playing “gods of vengeance and reward” (Key Citation1964, 568). Consequently, voters are more likely to reward incumbent administrations for a sound economy but punish them for a poor economy (Dassonneville and Lewis-Beck Citation2019; Lewis-Beck and Stegmaier Citation2000), to re-elect governments led by popular leaders (Bellucci Citation2010; Norpoth and Gschwend Citation2010), and to punish incumbents the longer they remain in office (Abramowitz Citation2008; Dassonneville, Lewis-Beck, and Mongrain Citation2017; Quinlan and Lewis-Beck Citation2021).
While the traditional structural model has a decent record in forecasting government performance in elections cross-nationally (Aichholzer and Willmann Citation2014; Bellucci Citation2010; Dassonneville, Lewis-Beck, and Mongrain Citation2017; Nadeau and Lewis-Beck Citation2020; Norpoth and Gschwend Citation2010; Quinlan and Lewis-Beck Citation2021), it has drawbacks. Its applicability to multiparty systems is less straightforward. Take, for example, the 2020 Irish general election. The government suffered losses, but the main feature of this election was the surge of support for the Left encapsulated by advances for Sinn Féin and the Greens, traditionally smaller players. In sum, traditional models often fall short in multiparty systems. In response, some modelers have embraced a synthetic approach combining models with vote intention from opinion polls. Initially, these forecasts concentrated on government performance (Lewis-Beck and Dassonneville Citation2015a, Citation2015b). More recently, synthetic models have embraced predictions of individual blocs (e.g. Mongrain Citation2021; Walther Citation2015; Stegmaier and Williams Citation2016). While these approaches have strong merit, all of these endeavors include measures of public opinion and most do not embrace a consistent theoretical specification in estimating individual blocs, complicating the development of parsimonious models. We challenge the narrative structural models are infeasible in multiparty systems and test whether historical–political indicators offer a means of estimating bloc support in multiparty systems.
The political history model
The political history model adopts the perspective: “Life can only be understood backwards; but it must be lived forwards” (Kierkegaard Citation1843). There exists in political science strong lineage in highlighting the importance of history in understanding current events (e.g. Pierson Citation2000). Incorporating a historical dimension in a forecasting model is not itself new (e.g. Keilis-Borok and Lichtman Citation1981; Abramowitz Citation2008). What is novel is shunning any measure of public opinion or economic conditions in the run-up to the contest and instead relying only on historical–political indicators. Considering the traditional structural approaches applied in Britain, France, Germany, and the United States (e.g. Abramowitz Citation2008; Norpoth and Gschwend Citation2010; Lewis-Beck and Tien, Citation2008, Citation2020; Lewis-Beck Citation1995), most incorporate short-term measures into their models. Be it an economic indicator like GDP growth or unemployment in the months or year before the contest or measures tapping public sentiment on government satisfaction, prime ministerial approval, or leader popularity in the three to twelve months before the vote. Similar approaches have been applied in polities where the tradition of structural election predictions is less developed, like Austria, Denmark, Italy, Japan, the Netherlands, Spain, and Turkey (Aichholzer and Willmann Citation2014; Bellucci Citation2010; Dassonneville, Lewis-Beck, and Mongrain Citation2017; Lewis-Beck and Tien Citation2012; Magalhães, Aguiar-Conraria, and Lewis-Beck Citation2012; Nadeau and Lewis-Beck Citation2020; Toros Citation2011). We depart from this existing scholarship as our mission is to test whether polities’ historical party, governance, and institutional dynamics alone can help us forecast bloc support and to move beyond the government/opposition dichotomy.
Detractors may charge this is a bold effort in a world where electoral volatility is not unknown (e.g. Gallagher, Laver, and Mair Citation2011). Yet, this overlooks the inertia time affords us, especially in political systems that, at the bottom, have been relatively stable. At the micro-level, consider the lasting quality of attachment that characterizes the politics of many individuals in mature Western democracies. At the macro level, ponder the still long lives of leading actors. We recognize these patterns have weakened over time. Nevertheless, enduring predispositions among individuals remain a force to be reckoned with, and volatility remains the exception than the norm. Simply put, we appreciate counterforces exist, expressed in forecasting errors and the fluctuating error term across time. However, econometrically, most of these error processes are simple, first-order autoregressive ones. Consequently, they shall be subject to straightforward statistical correction (Gujarati and Porter Citation2009, 417).
Critics might allege the historical model favors stability over change and making a forecast relying on history alone neglects particular conditions at election time. There is legitimacy to the first point – a model relying solely on historical patterns may induce conservative estimates which needs to be borne in mind when assessing the forecast. The latter issue maps to whether medium or long-term against short-term determinants are more influential in understanding electoral outcomes. We do not claim that short-term dynamics are unimportant and the literature has demonstrated their value in the forecasting enterprise. Instead, we assume campaign effects will likely cancel each other out (Lewis-Beck and Tien Citation2008, p.233) and any independent impacts accruing from such occurrences will be captured in the model's error term. Moreover, our initiative with this paper is to establish what forecasting potential long-term structural variables alone can yield. It is worth noting, however, models that rely on short-term factors have weaknesses too. Take polling approaches and their notable misses in several contests – e.g. the 2015 British election (Sturgis Citation2016) or the 2019 Australian election (Hurst Citation2020). These prognostications relied on short-term close to the contest measures. Structural and synthetic models, also using short-term measures, have fallen short too. Consider the 2017 German Federal election. The respected Chancellor Model (Norpoth and Gschwend Citation2017), which had an outstanding reputation for correctly calling the government's performance in German Federal elections, fell wide of the mark. The miss was primarily attributable to the emphasis the model places on short-term leader popularity, with the so-called Schulz Effect in full swing when the prediction was made but which had diminished by polling day. The critical point is even well-traveled forecasting endeavors relying on short-term predictors can fall victim to misses, implying an emphasis on short-term factors is not a prediction panacea.
One of the challenges of developing a forecasting model for individual blocs consists of the lack of a consistent theoretical framework. Conventional modeling predictions base themselves on the notion of retrospective evaluations of government performance. Extending this to individual actors is problematic given that “to estimate the support of many players in a multiparty system, neglects this logical link between results and responsibility” (Walther Citation2015, 5). This overlooks a burgeoning literature addressing the mechanisms of ongoing party support, regardless of incumbency status, resting on the view satisfaction with government and parties may be, at least partially, products of distinct processes (Plescia and Kritzinger Citation2017; Söderlund Citation2008; Williams, Stegmaier, and Debus Citation2017). For example, the responsibility attributed to a minor party in a ruling coalition may be different from that assigned to the Prime Minister's party. Naturally, responsibility attribution takes on a different character if a party sits in opposition (Angelova, König, and Proksch Citation2016; Debus, Stegmaier, and Tosun Citation2014; Fisher and Hobolt Citation2010). While these considerations are coming to be addressed in the vote-popularity function literature (Stegmaier, Lewis-Beck, and Park Citation2017), they have yet to take centre stage in aiding election prediction (a notable exception is Mongrain Citation2021). We accept the challenge here, drawing on theories of lagged bloc support, the costs of ruling, and political and economic electoral shocks.
We first assume support for any bloc will in part be a function of the general support for it in the system recently. This supposition rests principally on the idea of partisan loyalties – citizens forming stable attachments to parties - which influences political behavior long-term, including the vote (Campbell, Converse, and Stokes Citation1960). This dynamic has been recognized by several other forecasting enterprises (e.g. Mongrain Citation2021; Norpoth and Gschwend Citation2010). That said, there is evidence partisanship in many advanced democracies is waning (Dalton and Wattenberg Citation2000). Ireland is a case in point. From substantial levels of party identification in the late 1970s, this has dropped off (Marsh et al. Citation2008). Moreover, we accept other dynamics besides partisanship may influence support. In recognition, we adopt the notion of short-term popular support, whereby the aggregate distribution of bloc support in the two most recent electoral contests – the previous general election and most recent midterm election (in Ireland's case the local elections) – provides a safe baseline for estimating a bloc’s enduring support.
The political science literature continuously shows there is a cost to ruling (e.g. Cuzán Citation2015; Wlezien Citation2016; Nannestad and Paldam Citation2002). Being in government means parties take decisions increasing the possibility of alienating certain groups and creating electoral enemies – a “waiting in the long grass” effect. Holding office also means actors’ screw ups will be highlighted, perhaps more than their successes, which too can cost them votes (Nannestad and Paldam Citation2002). Research highlights actors in government often stray from the median position of voters in favor of narrow ideological goals, resulting in lost votes (Wlezien Citation2016). Whatever the root mechanism the expectation is holding office will result in a party losing votes.
Allowing for some dynamism to a historical-driven model is propitious as we know party systems can evolve and there has been an increase in voter volatility (Dassonneville, Blais, and Dejaeghere Citation2015; Drummond Citation2006). Our response is to model political and economic shocks. Broadly speaking a shock is an event that significantly transforms or alters processes and expectations in the system (Nannestad and Paldam Citation1994). The idea is they have no impact before they occur but a profound effect after. Shocks can be classified as changes in supply or demand and they can be short-term, or long-term fundamentally altering the rules of the game (Goertz and Diehl Citation1995). Given our interest in history, long-term alterations principally interest us.
There is a rich literature exploring political shocks (e.g. Goertz and Diehl Citation1995), economic disturbances on cleavages (Gourevitch Citation1986; Kriesi et al. Citation2008), and electoral behavior and voter preferences (Ahlquist, Copelovitch, and Walter Citation2020; Hernandez and Kriesi Citation2016; Malhotra and Margalit Citation2010; Margalit Citation2019). Its inclusion in forecasting models is relatively novel (an exception is Quinlan, Schnaudt, and Lewis-Beck Citation2022) and arguably provocative. Skeptics may charge shocks are, by their very nature, random occurrences that can’t be projected in advance, yielding their value for forecasting nil. We acknowledge some shocks are unforeseen and cannot be modeled ex-ante. Such occurrences are known for decreasing the reliability of econometric models. Yet, even when such shocks occur, they can have profound consequences on predicting. Take a well-traveled set of model parameters that have forecast elections relatively well. An unexpected event intrudes, which causes these parameters to alter. If this is not subsequently incorporated into the well traveled model ex-post, future ex-ante forecasts could be biased. Thus, models based primarily on history require flexibility and the need to incorporate these incidences.
But not all shocks fall into this category. Some, especially economic ones, and importantly their consequences, can be foreseen, and crucially their impacts on the electoral performance of actors hypothesized based on theory. Given that elections happen every few years, unless these events occur too close to polling day, there is sufficient opportunity to incorporate them into ex-ante forecast models. In simple terms, some shocks will be known in advance and theory can guide us in determining whether the shock will be likely to impact the performance of the actors we are seeking to prognosticate about.
But what shocks might matter? Shocks that re-orientate the rules of the game are certainly worthy of consideration. Fianna Fáil's decision to enter coalition in 1989 with the Progressive Democrats (PDs) was a new departure. Until 1989, the game's rules had been Fianna Fáil against the rest. However, having failed to obtain an overall majority for the fifth consecutive election, Fianna Fáil abandoned this so-called “core principle”. It marked a significant shift – no longer Fianna Fáil against everyone else. Since then, every Irish government has comprised a coalition. This development undoubtedly contributed to the Irish party system embracing multipartyism, moving from a predominant to a moderate pluralist party system (see Farrell Citation1999). Theoretically, it increased the electoral appeal of actors from the left and Independents because no longer was Fine Gael the only option for them of achieving government and influence. Consequently, it made Fine Gael less electorally appealing as the idea that these actors could only achieve influence or power with Fine Gael was laid to rest. Note, however, that Fianna Fáil’s entry into coalition was unanticipated pre the 1989 vote. Its implications only became apparent afterward. Hence is only modeled from contests from 1992 onwards.
Another shock deserving of consideration is a profound economic disturbance – so weighty that it resulted in outside intervention from monetary institutions like the IMF and the EU. In Ireland, the Global Financial Crisis (GFC), beginning in 2008 fits the bill. The incumbent government led by Fianna Fáil (who had been in power uninterrupted for almost eleven years when it hit) was held responsible and took the brunt of voter frustration (Marsh and Mikhaylov Citation2012). It was massacred in the 2011 contest, dropping from 41.5% of the vote to 17.4%, losing 58 of its 78 seats, and for the first time in a general election since September 1927 failing to achieve the most votes and seats. This economic blow signaled the end of Fianna Fáil’s political dominance, an effect rippling through the electorate. It represents a downward demand shock – a substantial shift away by the consumer from the economic good (i.e. Fianna Fáil). Importantly from a forecasting perspective, this shock occurred well in advance of the 2011 poll. There was ample evidence, eighteen months out from the 2009 local and European elections Fianna Fáil were suffering electorally, as economic voting theory would have assumed. Here we have a shock we can incorporate in advance of the contest with a theoretical foundation.
To recapitulate our argument in equation terms, we assume that bloc support can be estimated structurally in what we call the Irish Political History Model, expressed as follows:
(1)
(1)
Research strategy
Case
Ireland has a reputation for being sui generis in comparative politics. Traditionally, the party system has stood aside from many European democracies, lacking ideological cleavages, instead having its roots in the independence of the state in 1921, and the subsequent Irish Civil War (1922-'3). Ireland’s use of the single-transferable-vote (STV) also makes it standout. STV is conventionally classified as a quasi-proportional system (Farrell and McAllister Citation2000).
The tag of uniqueness applied to Ireland has been challenged (e.g. Marsh et al. Citation2008) and overlooks essential characteristics. Ireland is an advanced democratic European nation, the fifteenth oldest democracy globally, and has had consecutive democratic elections since 1922. It is a parliamentary system with multiple parties, coalition governments the norm for the past thirty years, thus boasting many of the hallmarks of other European democracies. It is a system that has historically been underpinned by stability. For forecasting, such persistence should bode well. Yet, over the past thirty years, Ireland has also witnessed a transformation of its party system due to shocks. Recent elections have been characterized by high volatility and significantly lower levels of partisanship (Marsh et al. Citation2008), mirroring patterns elsewhere. In sum, our focus on Ireland, with its familiar patterns, yet diversity with its use of STV and political and economic shocks, can bring new insights to election forecasting.
Data, variable operationalization, and methods
We have compiled data for twenty lower house Irish general elections from 1951 to 2020. The election data come from Sinnott (Citation1995) and the web database Irelandelection.com (2020). For the opinion poll comparative analysis, we source the data from the Irish Opinion Poll Indicator (Louwerse and Mueller Citation2020).
It would be a stretch to assume a historically derived structural model can account for all actors in a system, especially new parties, where historical information to make a forecast will be limited. Nevertheless, to provide a meaningful step forward in the forecasting enterprise, it is crucial to predict some of the meaningful actors currently vying for office. Here we focus our attention on four blocs: Fianna Fáil, Fine Gael, Independents, and a combination of leftist parties (the Left bloc).
Fianna Fáil and Fine Gael have held center stage over the past 90-years. Under the study period, both obtained the highest and second-highest vote shares in every election except for 2011 and 2020. All Irish Prime Minister's (Taoisigh) have come from either Fianna Fáil (8) or Fine Gael (6), with both parties always the largest bloc in every Irish government since 1951–2020 (Fianna Fáil have been in 19 governments while Fine Gael have been in 8). In this period, both Fianna Fáil and Fine Gael have occupied over 80 percent of the cabinet portfolios and have achieved a combined mean first preference vote of 71.3% and an average 76.5% of seats (see Figures A1 and A2, Appendix A).
The focus on Independents is novel in election prediction. Non-party candidates are usually not prevalent in most advanced democracies (Weeks Citation2016). Yet Independents have been prominent in Irish politics – for example, in the 2020 general election, 19% of candidates contesting were Independents (Houses of the Oireachtas Citation2020). On electability, Weeks (Citation2016, 582) observed “in the post-war period there have been 114 independent MPs elected to the Dáil … 59 times the proportion elected in Britain and 32 times that in the US, 10 times in Canada and 5 times the Australian ratio”. Additionally, they have played a role in determining government: for example, between 2016 and 2020, Independents served in cabinet.
The final bloc we estimate is a composite of left-wing parties (see Table A2 for a list included in this estimate by election year). Observations somewhat determined our choice. Left-wing actors have tended to come and go in the Irish system. Scholars have noted the lefts’ weakness, at least vis-à-vis its European counterparts (Sinnott Citation1995). As our method relies on historical observations, we run into the challenge of lacking sufficient cases to estimate separate models for each. Nonetheless, the real puzzler from a forecasting perspective is the Labor Party, another a long-term player in the Irish system. Looking at its support over time (see Figure A7), we discover beyond its tanking in the 2016 contest and surges in 1992 and 2011, the party’s support follows little discernable pattern (a similar pattern is noted for the FDP in Germany too - see Quinlan, Schnaudt, and Lewis-Beck Citation2022). Hence our decision to include Labor in the left bloc.
We use Seemingly Unrelated Regression (SUR, Zellner Citation1962), a standard procedure when estimating multiple actors in election forecasting (e.g. Stegmaier and Williams Citation2016; Mongrain Citation2021; Jérôme, Jérôme-Speziari, and Lewis-Beck Citation2017; Quinlan, Schnaudt, and Lewis-Beck Citation2022). It allows us to calculate models separately for Fianna Fáil, Fine Gael, Independents, and the left bloc combined, but concurrently, acknowledging support levels are inter-related. Thus, the parameters of each single equation consider information provided by the other equations, leading to more efficient estimates.Footnote1 It also results in within-sample estimates of vote share summing to 100%.
Our dependent variable is the first preference vote share for a bloc.Footnote2 We have four independent variables.Footnote3 The first measures short-term bloc support, which we operationalize by averaging the vote share in the previous general election with the bloc's performance in the most recent local election.Footnote4 We capture government incumbency with a dichotomous variable classifying whether a bloc was in government or not. Finally, we measure shocks with two dummy variables. The first captures Fianna Fáil’s entry to the coalition fray – with all elections from 1992 onwards scored 1 and those before 0. The second classifies the Global Financial Crisis (GFC) and its ripple effect with contests from 2011 onwards scored 1 and those before 0. Summary statistics, variable operationalizations, and additional analyses are in Appendixes A-C.
Empirical analysis
Within-sample performance
There are four principal criteria for judging an electoral forecast (Lewis-Beck Citation2005). Replicability and parsimony are the first two. Our models perform well on these – the data are widely available and therefore replicable, and the models contain four independent predictors specified in a straightforward equation. Third, for a forecast to be valuable, it must have adequate lead-time. Our approach conforms to this sine qua non as the parameters can be estimated in advance of the contest, and certainly at the minimum of three months before polling day, ensuring the forecast will not be immaterial. Finally, the El Dorado of forecasting is accuracy, which the rest of the analysis is devoted to.
details our SUR models. The slope estimates broadly align with our theoretical assumptions. We see there is a cost to governing for all blocs, reflected in the negative and statistically significant coefficients. Short-term bloc support is positively related and statistically significant at conventional levels (p < 0.05) for Fine Gael, Independents, and the Left bloc – the more support they have in the system, the higher their expected vote in the subsequent election. For Fianna Fáil, the coefficient is negative – an artifact of the GFC shock variable. As hypothesized, the shocks influence bloc support. On average, Fianna Fáil becoming coalitionable corresponds to declines in Fianna Fáil and Fine Gael backing and increases in support for Independents and the Left. The GFC shock had particularly negative consequences for Fianna Fáil to the benefit of Independents and the Left.
Table 1. Political History Model: Seemingly unrelated regression models explaining vote share of Fianna Fáil, Fine Gael, Independents, and the Left bloc as a function of government incumbency, short-term popular support, and shocks in Irish elections 1951–2020.
But how accurate are these models? The R2 for Fianna Fáil and Left bloc are encouraging – 0.981 and 0.919 respectively. For the Independents, it is nearly as robust – 0.86. However, the Fine Gael fit is modest – 0.646. For the models’ average forecasting error, two metrics are relevant – the within-sample mean absolute error (MAE) and the Root Mean Square Error (RMSE) for each bloc, the latter indicating how much prediction error we could expect, on average, if we used the model to forecast other elections (Lewis-Beck and Lewis-Beck Citation2015, 38–39). The Fianna Fáil model performs best on both – a within-sample MAE of 0.891 and an RMSE of 1.220. This is followed by the Independents model – an MAE of 1.144 and an RMSE of 1.387, followed by the Left bloc (MAE 1.661; RMSE = 2.173). The errors are notably higher for the Fine Gael model – MAE of 2.475; RMSE = 3.030.
An additional step in judging these predictions’ authenticity is to explore the within-sample forecasts. Our results are presented in graphical form in Appendix C. For Fianna Fáil (Figure C1, Appendix C), the results are encouraging. On twelve occasions (∼60% of cases), the prognosis is within 1-point of the result. Only once is the forecast off beyond conventional margins of error (i.e. 3-pts–1977 = 3.49), with no significant misses (i.e. errors <5-points). For Fine Gael (Figure C2), the forecasts are more variable. On eleven occasions, the result is with 3-points. However, the remaining predictions are outside conventional margins of error with the 2011 election the largest within-sample error at 5.3-points. For Independents (Figure C3), all 20 of the estimates fall within 3-points of the result, with half of these within 1-point. For the Left bloc (Figure C4), three quarters of observations are within 3-points of the result, with half within 1-point. Four elections however fall outside 3-points – 2020 the biggest miss at 5-points.
Out-of-sample diagnostics
The within-sample testing helps set the forecasting stage. But they are only a rehearsal and sometimes can be overly optimistic. The crucial tests of accuracy are those aimed at predicting elections outside the given sample. The RMSE metrics from are relatively encouraging, suggesting the models' forecasting ability are reasonable. How would the models do if predictions were derived for particular elections not included, i.e. spatially or temporally apart from the original sample?
Inevitably, venturing outside the complete sample will lead to more error. But what out-of-sample tests to perform? Lewis-Beck (Citation2005, 165) notes pre-2004 the scarcity of out-of-sample accuracy indices described by many forecasting enterprises beyond reportage of the adjusted R2, the mean absolute error, and the SEE. The choices of out-of-sample tests are also inconsistent across the literature. In response, we take an eclectic approach, performing three: jackknife, step-back, and one-step-ahead approaches respectively.
Our first test is the jackknife (leave one out) approach. It involves omitting one election at a time from the analysis, re-estimating the models based on the remaining 19 contests, followed by forecasting the omitted election. We devise and compare the estimate with the result, yielding an error calculation for that year. Additionally, we can compute a jackknife out-of-sample mean absolute error (MAE) by averaging all individual errors generated, and a jackknife median absolute error (MedAE), each giving us an overall estimation of the model's projection potential for elections outside our range of data. It allows election forecasters, who usually are dealing with modest n of observations (here we have 20) to use as much data as possible but still yield projections for contests not within the original sample. Little wonder it is the standard and most widely reported out-of-sample technique by election prognosticators (e.g. Dassonneville, Lewis-Beck, and Mongrain Citation2017; Bellucci Citation2010; Aichholzer and Willmann Citation2014; Magalhães, Aguiar-Conraria, and Lewis-Beck Citation2012; Mongrain Citation2021; Hanretty Citation2021; Lewis-Beck and Tien Citation2016).
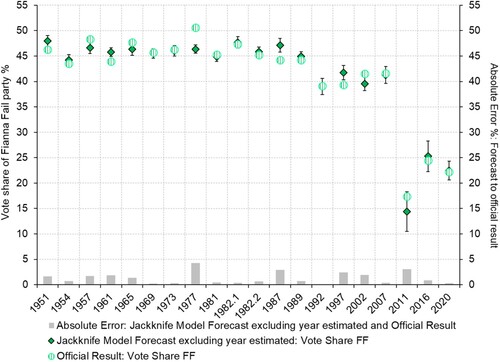
We start with which displays the jackknife estimates for Fianna Fáil vote share for each election in which we drop from the estimation the election for which the vote share is predicted. For 11 contests (∼55%), our jackknife estimates are within 1-point of the result. For 8 of the remaining 9, they are within 3-points – thus 95% of the absolute forecast errors fall within 0-3pts of the result. The biggest miss is the 1977 election (4.2-points off). The mean absolute error (MAE) for the jackknife approach is 0.914, while the largest MAE from this procedure, considered an approximation of maximum likely error (Lewis-Beck Citation2005, 153) is 1.061.
Figure 1. Out-of-sample forecasts of Fianna Fáil vote share (diamonds) using a jackknife approach compared with official results of 20 Irish general elections 1951–2020 (circles) with vertical bars from diamonds representing 95% confidence intervals associated with estimates. Note: Grey bars are the absolute error between the forecast and official result.
For Fine Gael, the mean absolute error from the jackknife approach is higher at 2.520, with the largest error 2.737. In Figure C5 (Appendix C), the individual jackknife forecasts for each election are more variable than those for Fianna Fáil. The predictions for half the elections fall within the conventional error of 3-points of the result. But there are some significant misses (<5-pts) – 6 (∼30%) in total. The 2011 prediction is 10-points off the result, the February 1982 prognosis is 8-points out, and the 2020 forecast is 6.4-points off. Thus, the model is much less solid in its predictions of Fine Gael.
For Independents, the jackknife MAE is 1.158 and the largest MAE is 1.298. Looking at the individual elections, 19 of the 20 predictions (∼95%) fall within 3-points of the result, the big miss being 1951 (3.3-points, see Figure C6). For the Left bloc, the jackknife average MAE is 1.684 and the largest MAE is 1.823. For 14 contests (∼70%), the prediction falls within 3-points of the result (see Figure C7). However, there are some large misses too – 2016 and 2020 are cases in point, where the prediction errors are 6.1 and 7.9-points respectively. Still, overall, the jackknife error estimates for the Independents and the Left bloc are less than for Fine Gael. Taking stock of the jackknife errors for all four blocs, we discover relatively moderate error occurs (MAE range 0.91–2.52).
Second, following Nadeau, Lewis-Beck, and Belanger (Citation2010, 15), we perform two observation omission procedures (a form of step-back analysis). First, we delete the first two observations (1951 and 1954) and use the remaining cases (1957-2020) to predict out-of-sample summary statistics and forecasts for the 1951 contest. We call this process First-Two-Observation-Deletion. Second, we remove the final two observations (2016 and 2020) and compute out-of-sample statistics for all elections and a prognosis for the 2020 elections – Last-Two-Observation-Deletion. What this uncovers is greater error in more recent forecasts than in earlier predictions. The absolute forecast error for the 1951 prognosis is between 1.2–2.9-points of the result for each bloc. But for the 2020 contest, while for three of the four actors, the absolute prediction error is within 3.6-points, the approach underestimates the performance of the Left by 7-points, a significant miss.
Our third diagnostic is one-step-ahead predictions (Lewis-Beck Citation2005, 153–154). It involves estimating the model on the time series up to a particular year, then predicting the next election's vote share. For example, the 2020 vote share estimations are based on elections from 1951-2016. While this tactic helps highlight influential observations and is theoretically ideal as it mimics the ex-ante situation a forecaster faces, the approach is disadvantaged by the small sample sizes limiting how many predictions can be conducted and the representativeness of the sample used for estimation. We anticipate this method will yield larger errors than the previous two procedures as they use more information and take into account the near entire historical period, while the one-step-ahead approach, based on fewer observations, is stricter and potentially more unstable due to fewer observations.
Our one-step-ahead approach is based on contests from 1981 onwards. We detail our results in Tables C5–C8 in Appendix C. For Fianna Fáil (Table C5), the average MAE from this procedure is 5.777, with the largest MAE at 8.541, noticeably higher than the jackknife procedure. If we assess the individual point forecasts for nine of the twelve contests (∼75%), the prognosis is within 3-points of the result. Still, the estimates were significantly out for two of the remaining three (1992 and 2011), coinciding with the shocks themselves. Thus, as expected, the one-step-ahead predictions are more varied and significantly less concrete.
For Fine Gael, the average MAE is 3.034 and the largest error MAE is 3.482. However, the one-step ahead point prognoses are much less accurate and disappointing. More than half the time the misses are in excess of 5-points, with particularly large errors in 1992, 2011, and 2016 (see Table C6). A pattern is clear: predicting the performance of Fine Gael is challenging, at least when relying on historical and institutional parameters.
More encouragingly, for Independents, the average MAE from the one-step-ahead procedure is 1.671 and the largest error MAE is 2.094, the smallest of all four blocs for this procedure. Looking at individual elections (Table C7), four of the one-step-ahead estimates are within 1-points and 9 (∼75%) are within 3-points of the result. Finally, for the Left bloc, the one-step-ahead average MAE is 3.241 and the largest error MAE is 4.758. For individual contests (see Table C8), overall 50% of the point estimates fall within 3-points, but for the remaining 50% fall beyond that, with substantial misses occuring in 1992, 2011 (coinciding with the shocks), and 2020, where the vote in all cases was underestimated.
Taken as a whole, the out-of-sample estimates as we might expect produce more error. The Fianna Fáil and Independent models perform best overall and can be depended on to forecast a bloc share within a few points of the result. Nevertheless, the Fine Gael projections are consistently the least impressive, especially for the one-step-ahead procedures. These analyses show political history has some limitations in forecasting particular blocs.
Comparison with polls
In assessing the robustness of this approach, we compare it to the opinion polls, long the go-to prediction method in Ireland. Due to data availability, we test opinion polls' veracity from elections for 1987 onwards and only for Fianna Fáil and Fine Gael. We take opinion poll estimates at T-6 months from the contest, a standard forecasting time-span. We contrast that with our political history model overall and with a specification only including elections from 1987–2020 (see Tables C9-10, Appendix C). We discover for Fianna Fáil, the political history model outperforms the opinion polls at T-6. It has a lower within-sample MAE, fits better to the data, and most importantly has a lower RMSE, pointing to its superior out-of-sample forecasting ability. This conclusion is sustained by the jackknife MAE comparison where the political history model outperforms the opinion polls.
For Fine Gael, the situation is mixed. The opinion polls at T-6 perform better, but only marginally outperform the political history model in terms of fit (adjusted R2 of 0.54–0.48) and RMSE of (3.396 versus 2.973). This finding is confirmed by the out-of-sample jackknife estimates – the polls at T-6 perform marginally better with a smaller MAE – 2.19–2.55 for the political history model. The analysis highlights how Fine Gael is the most challenging bloc to estimate no matter the forecasting method, something which needs to be borne in mind for future prognostications - Fine Gael support is unstable. Yet, there is evidence the political history model can hold its own against the traditional forecasting tool in Ireland and thus has some value, at least in terms of predicting Fianna Fáil support.
Conclusion
Structural election forecasting models have traditionally relied on predicting government performance based on short-term dynamics like economic conditions and leader and government popularity. Forays in estimating the performance of individual actors in multiparty systems have relied on synthetic approaches incorporating traditional political-economic measures with vote intention from opinion polls. In this contribution, we take a different tack. We investigate whether a country’s historical party and governance dynamics alone can provide reasonable estimates of predicting individual actor performance. We apply this political history model to Ireland, a polity that has received little attention from structural election forecasters (exception is Quinlan and Lewis-Beck Citation2021).
The model, focusing on short-term party support, incumbency status, and political and economic system shocks, shows promise, proving reasonably accurate in predicting the vote share of four blocs in the Irish system across 20 general elections between 1951 and 2020. Concerning Fianna Fáil and Fine Gael, the two traditional big players, we demonstrate the model performs at least as well or better with appropriate lead time compared with the conventional method of forecasting employed in Ireland – opinion polls. Our findings show historical and institutional dynamics in themselves have value in foretelling future election performance and deserve a hearing.
Nevertheless, reliance on historical patterns has limits and the political history model is not an elixir. We discover the models’ accuracy is more robust for earlier contests and the errors have been beyond acceptable standards in some more recent elections. The 2020 election was a particular challenge, where the opinion polls, with sufficient lead time, fell wide of the mark, (Quinlan and Lewis-Beck Citation2021), while the out-of-sample estimates from the political history model overestimated Fine Gael and underestimated the Left. As Hanretty (Citation2021, 1674) notes, it speaks to forecasters’ difficulty of accurately predicting elections when the electoral environment is incredibly volatile. This is a challenge for all forecasting endeavors, as the recent misses of most polling (with sufficeint lead-time) and structural forecasts of the 2021 German Federal election illustrate. Still, it has particular resonance for models provisory to long-established patterns. Further, we acknowledge while the method is well suited to capturing Fianna Fáil and Independents' support, it has significantly more variability in prognosticating on Fine Gael especially, which has emerged as especially challenging to forecast – although this method is not alone in having difficulty in predicting their support, with the opinion polls suffering on that score too.
Yet, this analysis shows sufficient evidence to consider the political history model moving forward. The approach is in its infancy and has not gone through the paces of an ex-ante forecast of an Irish election. Consequently, there is likely scope for improvement, which further observations will enable us to do. Our work should be considered a seed for future efforts. Still, this research has demonstrated historical and institutional dynamics have potential in helping us understand what electoral dynamics may be forthcoming in Ireland.
Supplemental Material
Download MS Word (1.2 MB)Acknowledgements
The authors acknowledge the support of the GESIS-Leibniz Institute for the Social Sciences for a visit by Quinlan to the University of Iowa in spring 2020 and the funding assistance of the Deutsche Forschungsgemeinschaft (DFG, German Research Foundation; Project number 491156185) which enables this contribution to be published open access. We appreciate the helpful critique and encouragement from the editor and several anonymous reviewers. We thank Deirdre Tinney for additional feedback and proofreading. As ever, all remaining errors are ours.
Disclosure statement
No potential conflict of interest was reported by the author(s).
Notes
1 For robustness, we estimated ordinary least squares (OLS) models for each bloc (see Table C1, Appendix C). We discover no significant deviations from the results reported in-text.
2 We also tested whether the model adequately forecasts seat share (see Table C2, Appendix C). Arguably, seat share is even more relevant as vote and seat shares in STV are not always in sync and it is seat share which ultimately decides the government. We discovered the seat share model estimates are encouraging for three blocs – Fianna Fáil (R2 = 0.93; within-sample MAE = 2.122 & RMSE = 2.696); Independents (R2 = 0.84; within-sample MAE = 1.087 & RMSE = 1.499); and the Left bloc (R2 = 0.91; within-sample MAE = 2.012 & RMSE = 2.472). For Fine Gael it is less encouraging (R2 = 0.46; within-sample MAE = 3.687 & RMSE = 4.597). Given the Fine Gael vote share model performs substantially better than the seat share model, and the vote share and seat share models of the other three blocs are broadly in tandem, we retain our focus in-text on predicting first preference vote share.
3 We explored how the models fare compared to a naïve model using vote share in the previous general election as the sole predictor. It shows the political history models perform stronger (see Table C3, Appendix C).
4 For robustness, we tested the impact of vote share in the previous election and vote share in the previous second-order election as separate predictors (see Table C4, Appendix C). Broadly speaking, this specification produces similar results to those reported in-text. This procedure produces slightly more promising estimates for Fine Gael and the Left specification, but less promising for Fianna Fáil and Independents. For parsimony reasons, we favor the model reported in-text.
References
- Abramowitz, A. 2008. “Forecasting the 2008 Presidential Election with the Time-for-Change Model.” PS: Political Science and Politics 41: 691–695.
- Ahlquist, J., M. Copelovitch, and S. Walter. 2020. “The Political Consequences of External Economic Shocks: Evidence from Poland.” American Journal of Political Science 64: 904–920.
- Aichholzer, J., and J. Willmann. 2014. “Forecasting Austrian National Elections: The Grand Coalition Model.” International Journal of Forecasting 30: 55–64.
- Angelova, M., T. König, and S. O. Proksch. 2016. “Responsibility Attribution in Coalition Governments: Evidence from Germany.” Electoral Studies 43: 133–149.
- Bellucci, P. 2010. “Election Cycles and Electoral Forecasting in Italy, 1994–2008.” International Journal of Forecasting 26: 54–67.
- Campbell, A., Miller Converse, and D. Stokes. 1960. The American Voter. New York, NY: Jon Wiley & Sons.
- Cuzán, A. 2015. “Five Laws of Politics.” Political Science and Politics 48: 415–419.
- Cuzán, A. G., and C. M. Bundrick. 1999. “Fiscal Policy As a Forecasting Factor in Presidential Elections.” American Politics Quarterly 27 (3): 338–353. doi:10.1177/1532673X99027003004.
- Dalton, R. J., and M. Wattenberg. 2000. Parties Without Partisans: Political Change in Advanced Industrial Democracies. Oxford: Oxford University Press.
- Dassonneville, R., A. Blais, and Y. Dejaeghere. 2015. “Staying With the Party, Switching or Exiting? A Comparative Analysis of Determinants of Party Switching and Abstaining.” Journal of Elections, Public Opinion, and Parties 25: 387–405.
- Dassonneville, R., and M. S. Lewis-Beck. 2019. “A Changing Economic Vote in Western Europe? Long-Term vs. Short-Term Forces.” European Political Science Review 11: 91–108.
- Dassonneville, R., M. S. Lewis-Beck, and P. Mongrain. 2017. “Forecasting Dutch elections: An initial model from the March 2017 legislative contests.” Research & Politics.
- Debus, M., M. Stegmaier, and J. Tosun. 2014. “Economic Voting Under Coalition Governments: Evidence from Germany.” Political Science Research and Methods 2: 49–67.
- Drummond, A. J. 2006. “Electoral Volatility and Party Decline in Western Democracies: 1970–1995.” Political Studies 54: 628–647.
- Erikson, R. S., and C. Wlezien. 2008. “Are Political Markets Really Superior to Polls as Election Predictors?” Public Opinion Quarterly 72: 190–215.
- Farrell, D. M. 1999. “Ireland: A Party System Transformed?.” In Changing Party Systems in Western Europe, edited by D. Broughton, and M. Donovan, 30–47. London: Pinter.
- Farrell, D. M., and I. McAllister. 2000. “Through A Darkly Glass? Understanding the World of STV.” In Elections in Australia, Ireland and Malta Under the Single Transferable Vote, edited by S. Bowler, and B. Grofman, 17–36. Ann Arbor, MI: University of Michigan Press.
- Fiorina, M. P. 1981. Retrospective Voting in American National Elections. New Haven CT: Yale University Press.
- Fisher, S., and S. B. Hobolt. 2010. “Coalition Government and Electoral Accountability.” Electoral Studies 29: 358–369.
- Gallagher, M. 2008. “The election as horse race: betting and the election.” How Ireland Voted 2007: The Full Story of Ireland’s General Election.
- Gallagher, M., M. Laver, and P. Mair. 2011. Representative Government in Modern Europe (5th revised edition). McGraw-Hill.
- Goertz, G., and P. F. Diehl. 1995. “The Initiation and Termination of Enduring Rivalries: The Impact of Political Shocks.” American Journal of Political Science 39: 30–52.
- Gourevitch, P. 1986. Politics in Hard Times: Comparative Responses to International Economic Crisis. New York, NY: Cornell University Press.
- Gujarati, D. N., and D. C. Porter. 2009. Basic Econometrics. 5th ed. New York, NY: McGraw Hill.
- Hanretty, C. 2021. “Forecasting Multiparty by-Elections Using Dirichlet Regression.” International Journal of Forecasting 37: 1666–1676.
- Hernandez, E., and H. Kriesi. 2016. “The Electoral Consequences of the Financial and Economic Crisis in Europe.” European Journal of Political Research 55: 203–224.
- Houses of the Oireachtas. 2020. “33rd Dáil General Election February 2020 Election Results.” Dublin, IE: Houses of the Oirechtas – Dail Eireann. Accessed August 31, 2021. https://www.oireachtas.ie/en/elections/.
- Hurst, D. 2020. “Opinion Poll ‘Failure’ at Australian Federal Election Systematically Overrepresented Labor.” November 10. Accessed September 5, 2021. https://www.theguardian.com/australia-news/2020/nov/11/opinion-poll-failure-at-australian-federal-election-systematically-over-represented-labor.
- Jérôme, B., V. Jérôme-Speziari, and M. S. Lewis-Beck. 2017. “The Grand Coalition Reappointed but Angela Merkel on Borrowed Time.” PS: Political Science and Politics 50: 683.
- Keilis-Borok, V., and A. Lichtman. 1981. “Pattern Recognition Applied to Presidential Elections in the United States, 1890- 1980: The Role of Integral Social, Economic, and Political Traits.” Proceedings of the National Academy of Sciences of the United States of America 78: 7230–7234.
- Key, V. O. 1964. Politics, Parties and Pressure Groups. New York, NY: Thomas Y Cromwell.
- Key, V. O. 1966. The Responsible Electorate. Cambridge, MA: The Bellknap Press of Harvard University Press.
- Kierkegaard, S. 1843. “Søren Kierkegaards Skrifter - Journalen JJ:167.“ Copenhagen, DK: Søren Kierkegaard Research Center. Accessed September 2, 2021. https://homepage.divms.uiowa.edu/~jorgen/kierkegaardquotesource.html.
- Kou, S., and M. E. Sobel. 2004. “Forecasting the Vote: An Analytical Comparison of Election Markets and Public Opinion Polls.” Political Analysis 12: 277–295.
- Kriesi, H., et al., ed. 2008. West European Politics in an Age of Globalization. Cambridge: Cambridge University Press.
- Lewis-Beck, M. S. 1995. “Comparaison de Prevision des Elections Présidentielles en France et aux Etats-Unis.” Journal de la Société de Statistique de Paris 136: 29–45.
- Lewis-Beck, M. S. 2005. “Election Forecasting: Principles and Practice.” British Journal of Politics and International Relations 7: 145–164.
- Lewis-Beck, M. S., É. Bélanger, and C. Fauvelle-Aymar. 2008. “Forecasting the 2007 French Presidential Election: Ségolène Royal and the Iowa Model.” French Politics 6 (2): 106–115. doi:10.1057/fp.2008.2.
- Lewis-Beck, M. S., and R. Dassonneville. 2015a. “Comparative Election Forecasting: Further Insights from Synthetic Models.” Electoral Studies 39: 275–283.
- Lewis-Beck, M. S., and R. Dassonneville. 2015b. “Forecasting elections in Europe: Synthetic models.” Research & Politics.
- Lewis-Beck, C., and M. S. Lewis-Beck. 2015. Applied Regression: An Introduction. Sage.
- Lewis-Beck, M. S., and T. W. Rice. 1992. Forecasting Elections. CQ Press.
- Lewis-Beck, M. S., and A. Skalaban. 1989. “Citizen Forecasting: Can Voters see Into the Future?” British Journal of Political Science 19 (1): 146–153.
- Lewis-Beck, M. S., and M. Stegmaier. 2000. “Economic Determinants of Electoral Outcomes.” Annual Review of Political Science 3: 183–219.
- Lewis-Beck, M. S., and C. Tien. 2008. “The Job of President and the Jobs Model Forecast: Obama for '08?” PS: Political Science & Politics 41 (04): 687–690. doi:10.1017/S1049096508081262.
- Lewis-Beck, M. S., and C. Tien. 2012. “Japanese Election Forecasting: Classic Tests of a Hard Case.” International Journal of Forecasting 28: 797–803.
- Lewis-Beck, M. S., and C. Tien. 2016. “The Political Economy Model: 2016 US Election Forecasts.” PS: Political Science and Politics 49: 661–663.
- Lewis-Beck, M. S., and C. Tien. 2020. “The Political Economy Model: A Blue Wave Forecast for 2020.” PS: Political Science and Politics 54 (1): 59–62.
- Louwerse, and S. Mueller. 2020. “Irish Polling Indicator.” Accessed August 17, 2021. https://pollingindicator.com.
- Magalhães, P. C., L. Aguiar-Conraria, and M. S. Lewis-Beck. 2012. “Forecasting Spanish Elections.” International Journal of Forecasting 28: 769–776.
- Malhotra, N., and Y. Margalit. 2010. “Short-term Communication Effects or Longstanding Dispositions? The Public’s Response to the Financial Crisis of 2008.” Journal of Politics 72: 852–867.
- Margalit, Y. 2019. “Political Responses to Economic Shocks.” Annual Review of Political Science 22: 277–295.
- Marsh, M., and S. Mikhaylov. 2012. “Economic Voting in a Crisis: The Irish Election of 2011.” Electoral Studies 31: 478–484.
- Marsh, M., R. Sinnott, J. Garry, and F. Kennedy. 2008. The Irish Voter. Manchester: Manchester University Press.
- Mongrain, P. 2021. “10 Downing Street: Who’s Next? Seemingly Unrelated Regressions to Forecast UK Election Results.” Journal of Elections, Public Opinion, and Parties 31: 22–32.
- Murr, A. 2016. “The Wisdom of Crowds: Applying Condorcet’s Jury Theorem to Forecasting US Presidential Elections.” International Journal of Forecasting 31: 916–929.
- Nadeau, R., and M. S. Lewis-Beck. 2020. “Election Forecasts: Cracking the Danish Case.” International Journal of Forecasting 36: 892–898.
- Nadeau, R., M. S. Lewis-Beck, and E. Belanger. 2010. “Electoral Forecasting in France: A Multi-Equation Solution.” International Journal of Forecasting 26: 11–18.
- Nannestad, P., and M. Paldam. 1994. “The VP-Function: A Survey of the Literature on Vote and Popularity Functions After 25 Years.” Public Choice 79: 213–245.
- Nannestad, P., and M. Paldam. 2002. “The Cost of Ruling: A Foundation Stone for two Theories.” In Economic Voting, edited by H. Dorussen, and M. Taylor, 17–44. London: Routledge.
- Norpoth, H., and T. Gschwend. 2010. “The Chancellor Model: Forecasting German Elections.” International Journal of Forecasting 26: 42–53.
- Norpoth, H., and T. Gschwend. 2017. “Chancellor Model Predicts a Change of the Guards.” PS: Political Science and Politics 50: 686–688.
- Pierson, P. 2000. “Increasing Returns, Path Dependence, and the Study of Politics.” American Political Science Review 94: 251–267.
- Plescia, C., and S. Kritzinger. 2017. “Retrospective Voting and Party Support at Elections: Credit and Blame for Government and Opposition.” Journal of Elections, Public Opinion, and Parties 27: 156–171.
- Quinlan, S., and M. S. Lewis-Beck. 2021. “Forecasting Government Support in Irish General Elections: Opinion Polls and Structural Models.” International Journal of Forecasting 37 (4): 1654–1665.
- Quinlan, S., C. Schnaudt, and M. S. Lewis-Beck. 2022. “Forecasting Bloc Support in German Federal Elections: A Political-History Model.” PS: Political Science & Politics 55 (1): 91–96. doi:10.1017/S1049096521000998.
- Rosenbaum, M. 1999. “Betting and the 1997 British General Election.” Politics 19: 9–14.
- Sinnott, R. 1995. Irish Voters Decide: Voting Behavior in Elections and Referendums Since 1918. Manchester: Manchester University Press.
- Söderlund, P. 2008. “Retrospective Voting and Electoral Volatility: A Nordic Perspective.” Scandinavian Political Studies 31: 217–240.
- Stegmaier, M., M. S. Lewis-Beck, and B. Park. 2017. “V-P Functions: A Review.” In The Sage Electoral Handbook, edited by K. Arzheimer, J. Evans, and M. S. Lewis-Beck, 608–630. Thousand Oakes, CA: Sage Publications.
- Stegmaier, M., and L. Williams. 2016. “Forecasting the 2015 British Election Through Party Popularity Functions.” Electoral Studies 41: 260–263.
- Sturgis, P., et al. 2016. “Report of the Inquiry Into the 2015 British General Election Opinion Polls.” London, UK: The British Polling Council and the Market Research Society. Accessed September 5, 2021. https://benjaminlauderdale.net/files/papers/PollingInquiryReport.pdf.
- Toros, E. 2011. “Forecasting Elections in Turkey.” International Journal of Forecasting 27: 1248–1258.
- Tufte, E. 1975. “Determinants of the Outcomes of Midterm Congressional Elections.” American Political Science Review 69: 812–826.
- Walther, D. 2015. “Picking the Winner(s): Forecasting Elections in Multiparty Systems.” Electoral Studies 40: 1–13.
- Weeks, L. 2016. “Why Are There Independents in Ireland?” Government and Opposition 51: 580–604.
- Williams, L., M. Stegmaier, and M. Debus. 2017. “Relaxing the Constant Economic Vote Restriction: Economic Evaluations and Party Support in Germany.” Party Politics 23: 286–296.
- Wlezien, C. 2016. “Policy (Mis) Representation and the Cost of Ruling: U.S. Presidential Elections in Comparative Perspective.” Comparative Political Studies 50: 711–738.
- Zellner, A. 1962. “An Efficient Method of Estimating Seemingly Unrelated Regressions and Tests for Aggregation Bias.” Journal of American Statistical Association 57: 348–368.