
Abstract
Variable Message Signs (VMS) are implemented at varying locations of the expressway. In this study, we compared the drivers’ attention allocation to a ‘drive safely’ message on several VMS gantries that were located at six sections of typical expressway conditions in Qatar. We investigated how the expressway drivers perceive the VMS when implemented in different driving conditions (e.g. higher truck or car density) and surrounding environments (landmarks, buildings, bridges, exits, etc.). Besides, it was studied whether the driver’s attention to the speedometer and the side mirrors was influenced. The eye-tracking data of seventy-nine drivers from the State of Qatar was analyzed, while driving in a driving simulator. It was found that a higher truck density on the expressway before the VMS location would lead to a delayed time-to-first-fixation and a lower fixation count to the VMS. The results of an ANOVA revealed that the expressway environment did not influence the drivers’ average fixation duration to the speedometer and side mirrors when encountering the VMS. Therefore, no interfering effects must be expected for ‘drive safely’ messages at VMS locations with varying expressway traffic and surrounding conditions.
1. Introduction
Variable Message Signs (VMS) are an essential part of the driver information system. Road authorities can display different messages on the VMS panels to inform drivers about special events, e.g. when an incident or traffic situation occurs that requires intervention. Else the VMS usually remains blank. Alternatively, VMS can also be used for displaying informative messages (e.g. road guidance, awareness or advertisement) regardless of whether an incident or unusual condition has occurred. As per the standard guidelines, a piece of data information that can be utilized by the motorists to make an appropriate decision is called ‘unit of information’ (Banerjee et al., Citation2019; CDOT, Citation2005). For instance, a VMS showing an alertness pictogram and the instruction to drive safely involves two units of information. A driving simulator study from the Netherlands found that displaying traffic irrelevant messages on VMSs might not interfere with traffic management if provided in a format that is in accordance with the ergonomic guidelines of VMS (Harms et al., Citation2019). However, most literature suggests that displaying advertisements and other driving-irrelevant information on VMSs might reduce the long-term effectiveness of VMS compliance if they are overused for irrelevant messages (Thomas & Charlton, Citation2020). Also, drivers may tend to ignore the VMS entirely if safety campaigns or other non-traffic-related messages are displayed over a longer time. For instance, a computer-based expressway simulation study was conducted in Germany to investigate the impact of supplementary information provided to drivers. The study found that the supplementary signs had no negative impact on drivers’ responses and reaction time to the main signs. The study suggests that drivers use effective attentional strategies and are not distracted by supplementary information (Metz & Krüger, Citation2014). Besides, the VMS can also display more general driving-related messages, such as ‘drive safely’ before a traffic incident has even occurred. Over the last few years, the safety messages (e.g. drive safely) are frequently displayed on VMS panels on expressways in the State of Qatar. The safety message has no specific reference to a hazard but is aimed at improving the driver’s general attention to the driving task and surroundings when driving at high-speed expressway roads. Therefore, VMS can help influence the driver’s expectations about emerging problems and optimally remind drivers about safety practices and knowledge of the current road and traffic situation (Underwood et al., Citation2003). However, it remains speculative whether there are measurable benefits in terms of road safety. So far research has shown that drivers do not remarkably slow down when encountering non-traffic related messages (Haghani et al., Citation2013) and that drive safely messages on VMS are ineffective in influencing driving behaviour (e.g. Miller et al., Citation1995), particularly if the VMS contains fewer units of information (Banerjee et al., Citation2019). On the other hand, another line of research confirmed that general safety messages on VMS do increase the driver’s attention and alertness to the driving task and the surrounding context, which is beneficial for traffic safety because responses to real incident messages will be faster (e.g. Jamson’s, Citation2007, Harms et al., Citation2019). Furthermore, feedback regarding the difficulties of the driving task can be obtained by checking the driving speed, the lateral position and the blind spot in the mirrors (Fuller, Citation2005). The integration of the VMS into the surrounding environment, where some features and objects (such as roadside buildings, bridges and traffic conditions) are already the focus of attention, can influence the driver’s attention allocation to the VMS (Most & Astur, Citation2007) and possibly to in-vehicle instruments (side mirrors, speedometer).
Eye trackers are usually employed to measure drivers’ visual attention through eye fixations that focus on a specific area in the visual scene while driving (Reinolsmann et al., Citation2022; Robbins et al., Citation2019). The drivers’ attention allocation to the road environment has already been investigated in the literature. This includes research on how drivers inspect rural and urban roadway types (e.g. Underwood et al., Citation2003), the impact of traffic conditions on the driver’s supervisory responsibilities of the vehicle (Jamson et al., Citation2013), the impact of infrastructural distractors, and weather conditions on drivers’ eye movements (Vetturi et al., Citation2020) and the impact of different VMS types (gantry vs cantilever) on drivers’ eye fixations (Reinolsmann et al., Citation2018). Therefore, surrounding expressway environment may facilitate to which extent drivers attend to a message displayed on the VMS (Campbell et al., Citation2012). Particularly, the monotonous rural expressway environment contributes to a decreased attention level among drivers (Engström et al., Citation2005). Well-designed icons on VMS have proven to draw drivers’ attention more quickly and improve understanding (Campbell et al., Citation2012).
Research has confirmed that drivers manage competing driving tasks by selectively fixating their eyes on the most important and salient areas or targets according to their experience, expectations and the immediate driving demands (Deng et al., Citation2016; Underwood et al., Citation2003).Age seems to be a relevant factor in attentional studies. For instance, in a laboratory study conducted by Fancello et al. (Citation2021) it was reported that the perception and understanding rates of VMS messages among young and elderly drivers start to decrease at driving speeds of 80 km/h as compared to middle aged drivers.
Costa et al. (Citation2018) used an eye tracker in an instrumented vehicle to measure drivers’ eye fixations to road signs in the traffic scene. They found that road signs were correctly identified from a shorter distance thantheir visibility distance. Moreover, the median fixation duration of the road signs was 137 milliseconds with a positively skewed distribution of the fixation durations. Research suggests that impacts on attention and perception are more robust in eye movement measures than in driving performance measures (Garrison & Williams, Citation2013). According to that study, eye movements are more sensitive to specific changes in the type of information being processed, whereas driving performance measures are mainly concerned with hazard responses to changing conditions rather than the attentional shifts to specific characteristics of the situation. Moreover, drivers’ glances towards new information in the driving scene are unlikely to result in a dangerous situation if the glance was directed voluntarily (Garrison & Williams, Citation2013).This study aims to investigate, which attention-related effects to a VMS in varying expressway traffic and surrounding conditions can be expected and whether drivers’ attention to the speedometer and the side mirror check will be impacted, while passing the VMS safety message.
2. Objective and research questions
A typical rural expressway in Qatar was selected as the geographical context since a vast network of VMS has been installed for traffic operations by the Qatar Ministry of Transport and Communications in the past few years. If not employed, the VMS can be deactivated, or safety messages could be displayed to influence driver’s situation awareness on the expressway. The multicultural and diverse driver population residing in Qatar (Soliman et al., Citation2018; Timmermans et al., Citation2019; Citation2020) has been included in the study to investigate the driver’s perception of VMS-based ‘drive safely’ messages at different stretches of the Doha Expressway. Therefore, this study was conducted to test drivers’ attention allocation to the VMS, the side mirrors, and the speedometer when passing varying rural expressway contexts that are characterized by specific roadside objects and traffic conditions. The drivers’ eye fixations to the VMS were recorded with an eye tracker while driving in a simulation. The frequency and duration of glances directed towards the VMS and sub-sequentially to in-vehicle areas were investigated when passing the VMS. The VMS was implemented for six different rural driving environments with varying traffic composition. Since it was aimed to investigate the impact of the VMS on drivers’ attention under everyday driving conditions, no additional hazards were integrated in the scenarios. The following research questions were formulated:
How long did it take drivers to notice the VMS in the surrounding expressway conditions?
How often did drivers look at the VMS in the different driving scenarios?
How long was the first eye fixation duration and the average eye fixation to the VMS?
Do the driving scenarios influence the drivers’ average eye fixation duration to the in-vehicle components (e.g. speedometer and side mirrors) and the VMS when considering the drivers’ age?
3. Methodology
3.1. Driving simulator
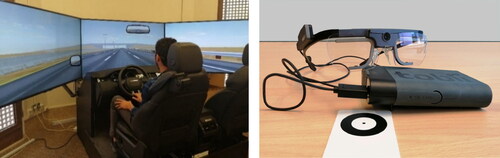
The medium-fidelity driving simulator at the Qatar Transportation and Traffic Safety Center (QTTSC) of Qatar University was used to study drivers’ attention while driving in different expressway environments (see ). The driving simulator consists of a fixed-base Range Rover cockpit car and three large screens with 135° of the horizontal field of view, a resolution of 5760 × 1080 pixels, and a 60 Hz refresh rate with STISIM Drive® 3 interface. The driving simulator at Qatar University has been validated by Hussain et al. (Citation2019) for speed perception and actual speed among drivers in Qatar. The drivers’ speed choices in the driving simulator used in the present study were comparable to driving in an instrumented vehicle. The driving simulator is capable of collecting 67 different parameters (Almallah et al., Citation2020; Hussain et al., Citation2020).
Figure 1. Equipment used in the experiment.
3.2. Eye-tracking
The Tobii Pro Eye Tracking Glasses 2 (see ) were used to investigate drivers’ eye fixations to the driving environment. The wearable eye-tracking glasses make it possible to move the head freely and contain a high-definition camera and microphone embedded in the middle of the glasses for recording the audio-visual scene in front (resolution of 1920 × 1080 pixels, at 25 frames per second [s]). The audio-visual recording is stored on a recording unit that connects to the glasses. The participant’s eye gaze behaviour is tracked and recorded via four sensors with a 100 Hz sampling rate (Tobii Pro AB, Citation2020). According to Tobii Pro AB (Citation2017), the system offers a precise and consistent time accuracy of as low as to the millisecond with 99% and 92% gaze detections for small gaze angles (≤ 15°) and large gaze angles (>15°). The participant is seated 1 m from the driving simulator screen, which corresponds approximately to the same distance between the driver and the calibration card, which was used to calibrate the gaze direction for every driver individually. The accuracy of the collected eye-tracking data was checked before every test drive by asking the participant to look at a particular stimulus and comparing the real stimuli position with the measured gaze position on the Tobii Pro glasses controller screen. A recalibration was eventually done if the participant’s gaze position slightly deviated. The eye-tracking system calculates continuous gaze points that are visualized as an additional layer in the video recording. Further analyses were conducted in Tobii Pro Lab through video-based screenshot mapping.
3.3. Scenario development
The expressway environment and real road conditions in the State of Qatar were replicated in the driving simulator. For this purpose, the Qatar Highway Design Manuals (Qatar MOTC, Citation2015) were consulted and video footage of the rural segments of the Doha Expressway were recorded to estimate the traffic density near the outskirts of Doha and in the North of Qatar. Based on the video footage we estimated free flow driving conditions for the rural expressway with a speed limit of 120 km/h and considered an increase of 40% in traffic density near the outskirts with vehicles maintaining similar speeds. This was done to improve the realism of the scenarios while decreasing the risk of simulation sickness (Almallah et al., Citation2021). shows the infrastructural elements of the typical expressway environment from the Doha expressway. The rural expressway geometry was standardized according to the highway guidelines. The rural environment in Qatar is characterized by a wide, sandy and flat desert topology. Still, the environmental variables such as roadside buildings (e.g. Ikea), bridges, the surrounding vehicles and traffic conditions can vary along the Qatar expressway. Additional variables such as weather conditions were not included in this study, because it was aimed to investigate the visual impact of local infrastructural objects and other vehicles on drivers’ attention allocation under normal (sunny and dry) weather conditions. The screenshots in show the simulated driving environment and an overview of the driver’s eye glances to the simulated surrounding.
Figure 2. Control expressway scenario with the real and simulated driving environment.
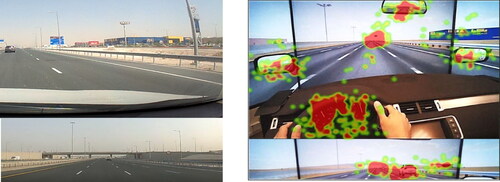
The heat map colours represent the total attention allocation of the drivers to the expressway infrastructure and the in-vehicle instruments recorded by an eye tracker. In this regard, the red areas represent where attention was most concentrated, yellow represents relatively less attention allocation, green represents least attention, and no colour indicates no attention (Garcez de Oliveira Padilha et al., Citation2021). The observation targets shown in the expressway scene are infrastructural objects such as roadside buildings, an Ikea landmark, a motorway exit, a bridge, and vehicles on the road. All observation targets were present in a baseline scenario of the expressway drive when the VMS gantry was not implemented yet (). Besides, eye gazes to observational in-vehicle targets were recorded, such as to the side and rear mirrors and the speedometer. Therefore, the results of the eye gazes to the in-vehicle targets could be compared between the control scenario and the test scenarios with VMS implementation.
3.4. Procedure
Once the study was approved by the ethical commission of Qatar University, drivers were recruited via information leaflets, and circular emails. To reach a broader sample of the driver population in Qatar, the sampling method was further extended using social media platforms and professional networking events. Drivers were also recruited via institutes operating in the field of transport and construction in Qatar. The participants were required to have a Qatar driving licence and at least two years of driving experience. Prior to the experiment, participants had to sign a consent form and received general information about the procedure of the research and the possible risk of simulation sickness in a driving simulator. First, a pre-test questionnaire including demographics and questions about the driving experience was presented. Afterward, the participants were introduced to the driving simulator. All participants completed one practice drive to get familiar with the driving controls and the simulation screen. In the next step, the eye-tracking system Tobii Pro Glasses 2 was calibrated for every individual to make sure that the eye-tracking camera tracked the drivers’ eye fixations to the surroundings. The participants were not informed about the purpose of the experimental drives and solely received the instruction to follow the traffic rules and drive as they would normally do. All drivers started with one control scenario followed by six randomized test drives with VMS implemented in different situations. The entire experiment was completed after 45 min and no financial compensation was offered to the participants.
3.5. Driving scenarios
A conventional VMS with a bilingual text-based safety message and a standardized warning pictogram were applied in the test conditions according to local and international VMS harmonization guidelines. depicts the VMS that was displayed on an overhead gantry implemented at different locations of the Doha Expressway.
Figure 3. VMS with a general safety message.

The exact position of the environmental objects in the scenery before and after the VMS were defined according to guidelines of Margison (Citation2008) for the location of VMS, which defines the following principles: 1) VMS should not obscure or interrupt views of a landscape or landmark, from properties and from the road. 2) VMS should not block important vistas in the landscape and 3) VMS should be positioned to minimize clusters. Following these principles, the natural and built character of the rural expressway environment was taken into account and several VMS locations before and after an IKEA landmark, in the vicinity of a bridge and buildings were set to be tested. In all scenarios the visibility distance of the VMS was defined at 500 m. Given that these VMS implementation options correspond to the VMS implementation guidelines, no significant impact on the driving behaviour was expected. However, it was expected that these varying VMS locations would have an impact on drivers’ attention allocation to the VMS and the surrounding environment. For this purpose, all test drives were randomized among the participants to avoid order effects. The typical traffic conditions and environmental/infrastructural elements on the Doha expressway were replicated in seven simulated scenarios ranging between 5 km till 7 km. Six test drives (see ) include the varying expressway conditions with VMS implementation (see ).
Table 1. Overview of VMS test scenarios (without control condition) and the surrounding features.
3.6. Analysis
The drivers’ overt eye movements and fixations can measure the information intake, which is primarily dependent on the available focus of attention (Porter, Citation2011). These eye fixations most often reflect the fact that the brain is processing the fixated information. Several studies include eye-tracking parameters to measure drivers’ visual attention through eye fixations, which are relatively stable moments when the drivers’ eyes focus on something in the environment (Porter, Citation2011, Robbins et al., Citation2019).
Parameters of visual processing are, for instance, the number of eye fixations as well as the average fixation duration on a VMS. Shorter eye fixation durations indicate that the information can be extracted easily. Thus, the average fixation duration is a measure of the depth of visual processing (Andrychowicz-Trojanowska and Uniwersytet Warszawski, 2018). The time to the first fixation is measured from the farthest distance when the VMS became visible at the horizon. Therefore, the fixation distance can influence the driver’s time to process and react to a change in the environment (Costa et al., Citation2018). The first fixation duration represents the time that the eye fixates the area for the first time from a distance. The eye-tracking parameters that have been extracted from the areas of interest in the simulation are listed in .
Table 2. Overview of the gaze parameters.
For the detailed analysis of the eye-tracking data, we have replaced the outliers that exceeded three standard deviations of the parameter mean of a scenario by the median value. Afterwards, an analysis of variance (ANOVA) was carried out to analyze the impact of the six VMS scenarios on the gaze parameters. The significance level indicated by the ANOVA analysis is the alpha term which must be conventionally less than 0.05 (95% significance).
4. Results
4.1. Participants
The eye-tracking data was collected from 80 participants. Data of one participant was excluded due to recording errors leaving the sample with 79 participants. The sample consisted of 80% male drivers and 20% female drivers, which fairly represents the gender composition of registered drivers in Qatar (Timmermans et al., Citation2020). The participants’ age ranged from 18 to 65 years, with a mean of 30.9 years, which is close to the median age of the population residing in Qatar (worldpopulationreview.com). Thirty-six percent of the participants hold a high school diploma, whereas 64% of the participants reported having a higher degree diploma. Most participants were either fully employed (48%) or students (41%). For 73.8%, the participants’ driving experience in Qatar after obtaining a valid Qatar driving licence was under 2 years, which can be explained by the high number of expatriates staying only temporarily in Qatar. The average driven km per year were fairly evenly distributed among the three exposure categories. Among the drivers, 47.5% wore prescription glasses or contact lenses, whilst the other 52.5% did not (see ).
TABLE 3. Demographics of sample (n = 79).
4.2. Time to first fixation on VMS
A univariate ANOVA revealed that the time to the first fixation on the VMS was significantly influenced by differences between the scenarios when measured from a 500 m visibility distance to the VMS (F(5,294) =17.68, α < 0.001, η2= 0.23). clearly shows that VMS scenario 5 with additional surrounding trucks leads to the longest average delay (mean: 5.52 seconds, StD: 5.06 seconds, median: 4.37 seconds) until drivers look at the VMS for the first time. This indicates that the VMS is less conspicuous from the 500 m appear distance when the surrounding trucks obstructed the view.
Figure 4. Time to first fixation on VMS (median and interquartile range).
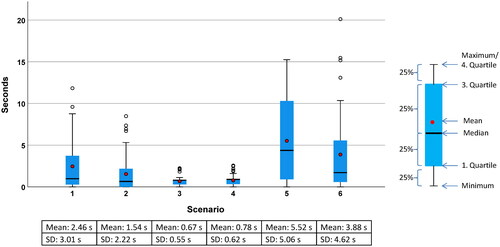
The results of a Bonferroni corrected pairwise comparison (α < 0.05) confirmed that VMS scenario 5 led to a significantly longer time until the first fixation to the VMS occurred among drivers (see ). More specifically, the increased truck density and the Ikea landmark before the VMS resulted in significantly delayed first eye fixations 4 − 5 seconds later as compared to all other scenarios (α < 0.001), except for scenario 6 with increased car density, where the differences is only 1.6 seconds later. It is likely that the Ikea landmark located before the VMS and the traffic conditions before the VMS (e.g. trucks in the 500 m visibility distance to the VMS) attracted drivers’ attention and delayed the first fixation to the VMS.
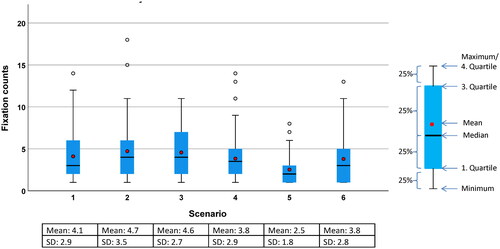
4.3. Number of eye fixations on VMS
A univariate ANOVA with a Bonferroni corrected pairwise comparison (95% CI) was conducted for the eye fixation count and showed that in scenario 5 (increased truck density = 2.5 glances) the fixation count was significantly lower as compared to scenario 2 (2.2 more glances to the VMS, F(5,295) =3.43, α = 0.004, η2 = 0.06) and compared to scenario 3 (2 more glances to the VMS, F(5,295) =3.43, α = 0.009, η2 = 0.06).This indicates that in traffic conditions where trucks before the VMS block the central field of view and the Ikea landmark is located before the VMS, the average number of eye fixations to the VMS is likely to be reduced (see ) as compared to scenarios where objects like the Ikea landmark or an exit ramp is located behind the VMS
Figure 5. VMS fixation count (median and interquartile range).
4.4. First fixation duration on VMS
The average first fixation duration to the VMS in each driving scenario was extracted among all drivers. Afterward, we have extracted the data specifically for the first fixation duration for the very first VMS encounter (the first drive in the randomized list of driving scenarios). The first fixation durations under a threshold of 100 milliseconds were considered invalid because the information intake could not be guaranteed (Holmqvist et al., Citation2011). The valid first fixations for one of the six driving scenarios, where a driver encountered the VMS for the very first time, were analyzed in an ANOVA.
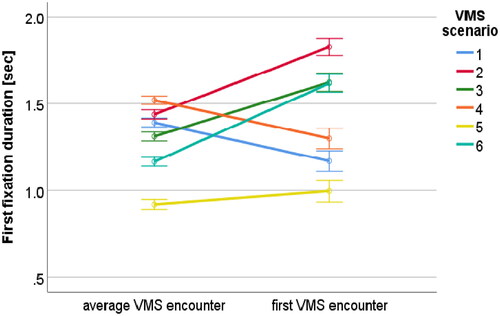
displays the average first fixation duration to a VMS scenario either at average VMS encounter or at first VMS encounter for a participant. Neither the scenarios nor the order of VMS encounters was significantly different. However, it can be seen from the graphs that scenario 5 with additional trucks on the road resulted in a low first mean fixation duration of < 1 seconds irrespective of drivers being exposed to the VMS for the very first time or at several times on average. This means that a lower first fixation duration to the VMS in case of trucks occurs irrespective of the first or average encounter with the VMS. Therefore, the analysis did not confirm that the first fixation duration to the same VMS might be decreased after multiple exposures.
Figure 6. First fixation duration: average vs. first exposure.
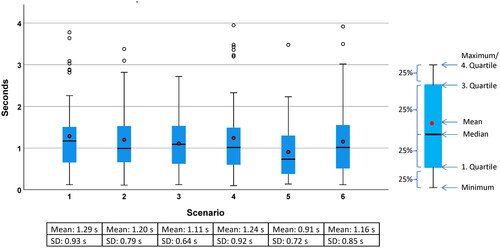
4.5. Average eye fixation duration
A univariate ANOVA with a Bonferroni corrected pairwise comparisons (95% CI) for eye fixation durations revealed significant shorter fixation durations on the VMS in scenario 5 (increased truck density) as compared to scenario 1 (-225 milliseconds, F(6,993) =2.71, α = 0.004, η2=0.016) and scenario 4 (-183 milliseconds, F(6,993) =2.71, α = 0.041, η2=0.016). In both scenarios, the Ikea landmark or exit ramp were located before the VMS. The trucks in scenario 5 with the Ikea before the VMS reduced the fixation duration on the VMS, which is visualized by the lower median and range of fixation durations to the VMS in . Nevertheless, all average fixation durations remained under 2 seconds, which is an acknowledged indicator for safe fixation durations away from the roadway.
Figure 7. Fixation duration on VMS (median and interquartile range).
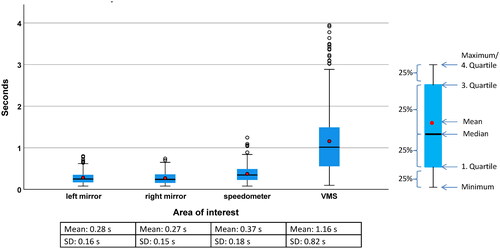
Moreover, a two-way ANOVA was conducted including the independent variables ‘scenario’, and ‘area of interest’ (side mirrors, speedometer and VMS) with the covariate age. At α < 0.05 there were significant differences for eye fixation durations among the areas of interest (F(3,978)= 189.7 α < 0.001, η2=0.37). Particularly, the Bonferroni corrected pairwise comparisons revealed that the drivers’ mean fixation duration was on average 810 milliseconds longer (α < 0.001) to the VMS as compared to the side mirrors and speedometer irrespective of the scenario. Also, age was identified to have a significant influence (α = 0.034) on fixation durations on the side mirrors, speedometer and the VMS and explains a part of the variances in the outcome of fixation duration. However, the scenarios (test and control scenario) did not significantly influence the average fixation duration to the areas of interest, which indicates that the drivers were able to handle the attentional demands to the side mirrors, the speedometer and the VMS in all scenarios. visualizes the range and median of eye fixation durations to the areas of interest. Furthermore, the average eye fixation duration on the VMS among all scenarios (mean: 1.16 seconds, StD: 0.82 seconds) did never exceed an average of 2 seconds.
Figure 8. Fixation duration on areas of interest.
5. Discussion and conclusion
It can be summarized that the scenario with increased truck density and the conspicuous Ikea landmark before the VMS location resulted in a lower number of eye fixations and a significantly delayed time to first eye fixation to the VMS. Neither the first nor the average VMS encounter led to significantly different first fixation durations, which indicates that the VMS message is grasped quickly irrespective of the order of exposure. Still, there is a tendency for a shorter first eye-fixation duration in the truck scenario, which is logical given the delayed time to the first fixation if trucks obstruct the driver’s view to the VMS. Nevertheless, the insignificant change was also found by Garrison and Williams (Citation2013) because gazes directed at driving-relevant objects remain stable even in case of distraction.
Furthermore, the expressway condition with trucks did significantly reduce the average eye fixation duration to the VMS as compared to scenarios where an Ikea landmark or exit ramp were located before the VMS, which highlights the impact of the increase truck density. The average eye fixation duration to the speedometer and side mirrors remained stable under 2 seconds. This threshold has been confirmed in naturalistic driving studies, which found that the odds for a crash would only increase if the driver looked away from the road for more than 2 seconds (Klauer et al., Citation2006). Still, outliers in fixation durations up to 4 seconds are acceptable as safe viewing time for the purpose of reading and comprehending VMS messages in the central field of view while driving on an expressway (Richards et al., Citation2005). The unchanged average eye fixation duration to the in-vehicle areas (side mirror and speedometer) is also an indicator for the ease of information processingin all scenarios. This indicates that drivers can deal with the increased visual demands, even in the case of additional trucks on the road (Andrychowicz-Trojanowska and Uniwersytet Warszawski, 2018). In line with previous research e.g. (Fancello et al., Citation2021), age was significantly affecting the overall average fixation duration to the VMS, the side mirrors and the speedometer. However, no differences were found between the presented expressway scenarios, possibly because the rural expressway design was rather similar in terms of infrastructural context. It is possible that the insignificant differences found between the scenarios are associated with the large lateral distances between the built objects and the roadway, which is characteristic for rural expressway environments as compared to urban expressways in space constraint urban areas. In all conditions, the drivers look for a longer duration to the VMS than to the speedometer or side mirrors while driving through the scenarios. This can be explained by the VMS being located in the central field of view and drivers can optimally allocate their attention to the far ahead road. Deng et al. (Citation2016) confirmed that drivers fixate most of their gazes on the far ahead road. A similar result was reported by Underwood et al., (Citation2003) since the far-ahead and the mid-ahead road is most frequently fixated than any other part of the traffic scene. Usually, the road near-left, and the road near-right tend to attract fewer fixations. Our presented study adds an important finding to this line of research since additional large trucks before the VMS location likely captured attention, which delays the driver’s first fixation to the VMS and consequentially the total number of eye fixations to the VMS. This was not the case in the scenario where the Ikea or other roadway infrastructure was positioned behind the VMS gantry location. This study implies that VMS can be implemented in line with the VMS placement guidelines even with non-specific ‘drive safely’ messages. It is recommended to be aware of the influence of trucks directly before the VMS location. Still, drivers can handle these attentional demands and drivers’ average fixation duration to the speedometer and side mirrors did not change in the environmental scenarios. This means that a VMS drive safely message did neither worsen or improve the drivers attention allocation to in vehicle instruments.
The main limitation of this study is the restricted number of participants. A larger sample and data collection over a longer period would be required to improve the results of this attentional study. One should also be aware that the percentage of students participating in this study might be higher compared to the actual driver population. Nevertheless, the gender composition and mean age of the participants appeared to be a fair representation of the Qatar population. In addition, the experiment was conducted using a fixed-based simulator, which could have reduced the degree of realism. Furthermore, a greater visual distinction in expressway scene layouts and the inclusion of urban expressways in densely built environments would be desirable for future research.
The study has shown that attention to a short drive safely message on a VMS is reduced in traffic conditions with trucks before the VMS location since attentional resources are divided. Therefore, it is recommended to collect and synchronize GPS-based real-time traffic data through Intelligent Transportation Systems applications at least 500 m before the VMS location to monitor for large obstructing vehicles when changing the VMS content display to longer, traffic relevant and action directed warning messages that require improved attention, and imminent behavioural actions.
Acknowledgements
This publication was made possible by the NP RP award [NP RP11S-1228-170143] from the Qatar National Research Fund (a member of The Qatar Foundation). The statements made herein are solely the responsibility of the author[s]. Open Access funding provided by the Qatar National Library.
Disclosure statement
No potential conflict of interest was reported by the authors.
References
- Almallah, M., Alfahel, R., Hussain, Q., Alhajyaseen, W. K. M., & Dias, C. (2020). Empirical evaluation of drivers’ start-up behavior at signalized intersection using driving simulator. Procedia Computer Science, 170, 227–234. https://doi.org/10.1016/j.procs.2020.03.034
- Almallah, M., Hussain, Q., Reinolsmann, N., & Alhajyaseen, W. K. M. (2021). Driving simulation sickness and the sense of presence: Correlation and contributing factors. Transportation Research Part F: Traffic Psychology and Behaviour, 78, 180–193. https://doi.org/10.1016/j.trf.2021.02.005
- Andrychowicz-Trojanowska, A, & Uniwersytet Warszawski. (2018). Basic terminology of eye-tracking research. Applied Linguistics Papers, 2/2018(25), 123–132. https://doi.org/10.32612/uw.25449354.2018.2.pp.123-132
- Banerjee, S., Jeihani, M., Khadem, N. K., & Brown, D. D. (2019). Units of information on dynamic message signs: A speed pattern analysis. European Transport Research Review, 11(1), 1–9. https://doi.org/10.1186/s12544-019-0355-7
- Campbell, J. L., Lichty, M. G., Brown, J. L., Richard, C. M., Graving, J. S., Graham, J., O’Laughlin, M., Torbic, D., & Harwood, D. (2012). Human factors guidelines for road systems: Second Edition. In Human factors guidelines for road systems. 2nd Ed. Transportation Research Board. https://doi.org/10.17226/22706
- CDOT. (2005). CDOT Guidelines on Variable Message Signs (VMS). Colorado Department of Transportation. Retrived from: https://www.yumpu.com/en/document/view/49907177/cdot-guidelines-on-variable-message-signs-vms-colorado-
- Costa, M., Simone, A., Vignali, V., Lantieri, C., & Palena, N. (2018). Fixation distance and fixation duration to vertical road signs. Applied Ergonomics, 69, 48–57. https://doi.org/10.1016/j.apergo.2017.12.017
- Deng, T., Yang, K., Li, Y., & Yan, H. (2016). Where does the driver look? Top-down-based saliency detection in a traffic driving environment. IEEE Transactions on Intelligent Transportation Systems, 17(7), 2051–2062. https://doi.org/10.1109/TITS.2016.2535402
- Engström, J., Johansson, E., & Östlund, J. (2005). Effects of visual and cognitive load in real and simulated motorway driving. Transportation Research Part F: Traffic Psychology and Behaviour, 8(2), 97–120. https://doi.org/10.1016/j.trf.2005.04.012
- Fancello, G., Serra, P., & Pinna, C. (2021). Visual perception and understanding of variable message signs: The influence of the drivers’ age and message layout. Safety, 7(3), 60. https://doi.org/10.3390/safety7030060
- Fuller, R. (2005). Towards a general theory of driver behaviour. Accident; Analysis and Prevention, 37(3), 461–472. https://doi.org/10.1016/j.aap.2004.11.003
- Garcez de Oliveira Padilha, L., Malek, L., & Umberger, W. J. (2021). Sustainable meat: Looking through the eyes of Australian consumers. Sustainability, 13(10), 5398. https://doi.org/10.3390/su13105398
- Garrison, T. M., & Williams, C. C. (2013). Impact of relevance and distraction on driving performance and visual attention in a simulated driving environment. Applied Cognitive Psychology, 27(3), 396–405. https://doi.org/10.1002/acp.2917
- Haghani, A., Hamedi, M., Fish, R., & Nouruzi, A. (2013). Evaluation of dynamic message signs and their potential impact on traffic flow (No. MD-13-SP109B4C). Maryland: State Highway Administration. Office of Policy & Research.
- Harms, I. M., Dijksterhuis, C., Jelijs, B., de Waard, D., & Brookhuis, K. A. (2019). Don’t shoot the messenger: Traffic-irrelevant messages on variable message signs (VMSs) might not interfere with traffic management. Transportation Research Part F: Traffic Psychology and Behaviour, 65, 564–575. https://doi.org/10.1016/j.trf.2018.09.011
- Hussain, Q., Alhajyaseen, W. K. M., Pirdavani, A., Reinolsmann, N., Brijs, K., & Brijs, T. (2019). Speed perception and actual speed in a driving simulator and real-world: A validation study. Transp Res Part F Traffic Psychol Behav, 62, 637–650. https://doi.org/10.1016/j.trf.2019.02.019
- Hussain, Q., Alhajyaseen, W., Brijs, K., Pirdavani, A., & Brijs, T. (2020). Improved traffic flow efficiency during yellow interval at signalized intersections using a smart countdown system. IEEE Transactions on Intelligent Transportation Systems, 23(7), 1959–1968. https://doi.org/10.1109/TITS.2020.3030130.
- Holmqvist, K., Nyström, M., Andersson, R., Dewhurst, R., Jarodzka, H., & Van de Weijer, J. (2011). Eye tracking: A comprehensive guide to methods and measures. OUP.
- Jamson, A. (2007). The effectiveness of safety campaign VMS messages - A driving simulator investigation. Driving Assesment Conference, 4(2007), 459–465. https://doi.org/10.17077/drivingassessment.1277
- Jamson, A. H., Merat, N., Carsten, O. M. J., & Lai, F. C. H. (2013). Behavioural changes in drivers experiencing highly-automated vehicle control in varying traffic conditions. Transportation Research Part C: Emerging Technologies, 30, 116–125. https://doi.org/10.1016/j.trc.2013.02.008
- Klauer, S. G., Dingus, T. A., Neale, V. L., Sudweeks, J. D., & Ramsey, D. J. (2006). The impact of driver inattention on near crash/crash risk: An analysis using the 100-car naturalistic driving study data. National Highway Traffic Safety Administration, 226, 594.
- Margison, P. (2008). Guidelines for the location and placement of variable message signs. Technical Direction for Traffic and Transport Practitioners, December
- Metz, B., & Krüger, H. P. (2014). Do supplementary signs distract the driver? Transportation Research Part F: Traffic Psychology and Behaviour, 23, 1–14. https://doi.org/10.1016/j.trf.2013.12.012
- Miller, J. S., Smith, B. L., Newman, B. R., & Demetsky, M. J. (1995). Effective use of variable message signs: Lessons learned through development of users’ manuals. Transportation Research Record, (Report No.1495), 1–8.
- Most, S. B., & Astur, R. S. (2007). Feature-based attentional set as a cause of traffic accidents. Visual Cognition, 15(2), 125–132. https://doi.org/10.1080/13506280600959316
- Porter, B. E. (2011). Handbook of Traffic psychology. Academic Press. ISBN: 9780123819840, https://doi.org/10.1016/B978-0-12-381984-0.10041-4.
- Qatar MOTC. (2015). Highway design manual -Interchanges and freeway or motorway corridors, Ministry of Transport & Communication, State of Qatar, 1(9).
- Reinolsmann, N., Brijs, K., Brijs, T., Alhajyaseen, W., Cornu, J., & Mollu, K. (2018). Variable message sign strategies for congestion warning on motorways-a driving simulator study. Advances in Transportation Studies, 45, 77–92.
- Reinolsmann, N., Alhajyaseen, W., Brijs, T., Pirdavani, A., Ross, V., Hussain, Q., & Brijs, K. (2022). Delay or travel time information? The impact of advanced traveler information systems on drivers’ behavior before freeway work zones. Transportation Research Part F: Traffic Psychology and Behaviour, 87, 454–476. https://doi.org/10.1016/j.trf.2022.05.001
- Richards, A., Mcdonald, M., Fisher, G., & Brackstone, M. (2005). Investigation of driver comprehension of traffic information on graphical congestion display panels using a driving simulator. EJTIR, 4(20040), 417–435.
- Robbins, C. J., Allen, H. A., & Chapman, P. (2019). Comparing drivers’ visual attention at Junctions in Real and Simulated Environments. Applied Ergonomics, 80, 89–101. https://doi.org/10.1016/j.apergo.2019.05.005
- Soliman, A., Alhajyaseen, W., Alfar, R., & Alkaabi, I. (2018). Changes in driving behavior across age cohorts in an Arab Culture: The case of State of Qatar. Procedia Computer Science, 130, 652–659. https://doi.org/10.1016/j.procs.2018.04.116
- Thomas, F. M. F., & Charlton, S. G. (2020). Inattentional blindness and information relevance of variable message signs. Accident; Analysis and Prevention, 140, 105511. https://doi.org/10.1016/j.aap.2020.105511
- Timmermans, C., Alhajyaseen, W., Reinolsmann, N., Nakamura, H., & Suzuki, K. (2019). Traffic safety culture of professional drivers in the State of Qatar. IATSS Research, 43(4), 286–296. https://doi.org/10.1016/j.iatssr.2019.03.004
- Timmermans, C. P., Alhajyaseen, W. K., Ross, V., & Nakamura, H. (2020). Introducing a multi-variate classification method: Risky driving acceptance among different heterogeneous driver sub-cultures. Journal of Safety Research, 73, 81–91.
- Tobii Pro AB. (2020). Tobii Pro Lab user manual (Version 1.145).
- Tobii Pro AB. (2017). Eye tracker data quality report: Accuracy, precision and detected gaze under optimal conditions-controlled environment. Tobii Technology.
- Underwood, G., Chapman, P., Brocklehurst, N., Underwood, J., & Crundall, D. (2003). Visual attention while driving: Sequences of eye fixations made by experienced and novice drivers. Ergonomics, 46(6), 629–646. https://doi.org/10.1080/0014013031000090116
- Underwood, G., Chapman, P., Berger, Z., & Crundall, D. (2003). Driving experience, attentional focusing, and the recall of recently inspected events. Transportation Research Part F: Traffic Psychology and Behaviour, 6(4), 289–304. https://doi.org/10.1016/j.trf.2003.09.002
- Vetturi, D., Tiboni, M., Maternini, G., & Bonera, M. (2020). Use of eye tracking device to evaluate the driver’s behaviour and the infrastructures quality in relation to road safety. Transportation Research Procedia, 45(2019), 587–595. https://doi.org/10.1016/j.trpro.2020.03.053