Abstract
Nanocrystalline ZnO particles prepared by precipitation method from Zn and I2 reaction with oxygen as catalyst were investigated. The addition of diethanolamine (DEA) as capping agent and fast pyrolysis treatment at 550, 700 and 850 °C were also characterised and elaborated. Compact and small spherical particles were observed for ZnO synthesised with O2 catalysed whilst, uneven surface, fewer dense packing particles and macropore structures were observed for ZnO prepared without excess of O2. It was shown that diffusion of O2 has improved the structural and photoluminescence behaviour of the prepared ZnO nanoparticles. ZnO synthesised with O2-catalysed exhibited better crystalline and leaned towards a pure state as shown by shifting of PL peak to higher energy of pure ZnO while, sample prepared without excess of O2 exhibits poor crystalline and decreasing of the energy band gap with respect to increment of calcination temperatures. Single violet emission was observed in all samples synthesised with excess of O2 whereby the highest intensity was obtained by calcining at 850 °C with photon energy at 2.95 eV. In contrast to sample with excess of O2, ZnO calcined without excess of O2 at 850 °C displays violet and green emission with energy at 2.93 eV and 2.35 eV, respectively.
1. Introduction
Zinc oxide (ZnO) semiconductor has been the focus of current research interest due to its versatile application in advanced functional device, including short-wavelength light-emitting diode [Citation1], ultra violet (UV) laser diode [Citation2], piezoelectric device [Citation3], gas sensor [Citation4], catalyst [Citation5], transparent conductor [Citation6] and field emission display [Citation7]. This diversity of application is due to ZnO's unique properties such as direct wide-band gap (3.37 eV), large exciton binding energy (60 meV), chemically stable and its bio-compatibility [Citation8]. ZnO is also a material which has the richest family of nanostructures including nanoparticles, nanoneedles, nanorods, nanoflakes, nanotowers and nanotetrapod [Citation7,Citation9–13]. As the structures are in nanometre scale, ZnO exhibits properties that are different from their bulk counterpart and their performances are enhanced resulting from the high surface to volume ratio properties. Among diverse morphology of ZnO nanostructures, ZnO nanoparticles have received enormous attention during recent years since it offers wide area of application such as sensor [Citation14], photocatalyst [Citation15], transparent UV protection film [Citation16], bio-imaging and drug delivery [Citation17]. Resulting from the widespread ZnO nanoparticles applicability, many methods to produce ZnO nanoparticles in uniform size and volume have been developed via solution chemical route and physical vapour deposition (PVD). For example, sol gel, colloid, hydrothermal, microemulsion, chemical bath deposition and precipitation [Citation18–23] are the routes under solution chemical method whereas spray pyrolysis, sputter deposition, template-assisted growth and chemical vapour deposition [Citation24–26] are among the routes that are employed to synthesis ZnO nanoparticles under PVD.
Comparing the PVD and solution chemical route, PVD requires extreme condition such as high temperature and pressure, complicated equipment, costly raw materials and long deposition times whereas solution-based methods are less expensive and produce high-output volume thereby become the favoured route in this work. Among the solution-based techniques, precipitation is easier to control, capable of mass production, simple and versatile. However, it possesses some limitations where longer calcinations process [Citation27] is required for removal of impurities, consequently raises the production cost as more energy is consumed. Furthermore, the nanoparticles produced tend to agglomerate during reaction, which will reduce particles’ surface area, thus lowering ZnO sensing sensitivity. Nevertheless, this limitation can be minimised by employing capping agent or surfactant (i.e. diethanolamine (DEA) [Citation28], polyvinyl alcohol (PVA) [Citation29], ethylene glycol (EG) [Citation30]) in the reaction, albeit their reactions are lower. Conversely, the addition of catalyst will help to speed up the nucleation process.
In this study, O2 gas was diffused in the solution to increase the kinetic reaction between iodine and zinc atoms. The collisions of the moving O2 gas with the reactants’ atoms are believed will speed up the chemical reaction and nucleation process, thereby serve as a catalyst. We also deployed an organic base (DEA) to initiate Zn hydrolysis to form Zn(OH)2 precipitate and preserve the shape and size of the solid particles. The excess of O2 probably will bind to the solid surface via physical adsorption since the process occurs in ambient temperature. We introduce fast pyrolysis treatment at 550, 700 and 850 °C to remove the vapour and impurities as well as to improve the crystalline of ZnO. The effect of O2 diffusion and heat treatment on ZnO morphology and structural properties were characterised using Scanning Electron Microscope (SEM), Transmission Electron Microscope (TEM) and X-ray powder diffractometre (XRD) whereas its optical behaviour was studied using room temperature photoluminescence (PL) spectroscopy. In addition to that, the AC electrical response of ZnO nanoparticles was also analysed using impedance spectroscopy technique.
2. Experimental procedures
ZnO nanoparticles are synthesised according to a method developed earlier [Citation31] with some modification which has been made by introducing DEA as capping agent and oxygen diffusion acting as catalyst during the nanoparticles formation. The ZnO nanoparticles are prepared by using high purity reagent raw materials and used as it is without further purification. Zn and I2 powder was supplied from Sigma-Aldrich, absolute ethanol from Systerm Ltd. and DEA from R&M Chemicals.
ZnO nanoparticles were prepared by dissolving 0.5 g of I2 powder in 20 ml of absolute ethanol under constant magnetic stirring at room temperature. Then, 0.3 g Zn powder was added into the solution in parallel to oxygen diffusion at 0.6 sccm. The solution gradually turns from dark red to grey as time progresses implying that the solution has fully reacted. After a further one hour of reaction, 0.5 ml DEA was added drop wise while constantly stirring. During this process, white sediment was gradually formed in the solution. In the third hour of reaction, the sediment was then filtered and washed thoroughly with absolute ethanol and de-ionised water for several times to remove impurities. Fast pyrolysis treatment in air atmosphere for three minutes at 550, 700 and 850 °C was performed to dissociate Zn(OH)2 into ZnO nanoparticles as well as to remove the by-products developed from the reaction. The procedures above were repeated with exclusion of O2 diffusion to further study the influence without O2. Both syntheses produce ZnO nanoparticles in powder states.
2.1 Measurement and analysis
X-ray powder diffraction (XRD) measurements were performed using a Siemens XRD D5000 at a scanning rate of 0.05° per step with 2θ ranging from 10° to 80° using monochromatic Cu Kα radiation ( nm). The morphology of the synthesised ZnO nanoparticles was characterised using SEM, Model JSM- 6460 LV. The size and images of the particles were verified by TEM micrograph from FEI CM 12 at acceleration voltage of 120 kV. The room-temperature photoluminescence (PL) spectrum was performed on Jobin Yvon HR 800 UV spectrophotometer using He-Cd laser (
nm) as the excitation source.
The energy corresponding to the exciton absorption peak can be converted in terms of particles size using the effective mass approximation [Citation32](1) where the bulk band gap Eg is taken as 3.37 eV, and the bulk exciton binding energy
can be taken as 60 meV. According to Beni and Rice [Citation33] and Tan et al. [Citation34] the electron and hole effective masses are taken as me* = 0.24 m0 and mh* = 2.31 m0, respectively. Additionally, h is Planck's constant and R is the radius of ZnO nanocrystals. From Scherrer formula [Citation35], using FWHM of XRD pattern, the average crystallite size is
(2) where K is the shape factor of 0.9, λ is the wavelength of the X-ray radiation, β is the line broadening at half of the maximum intensity (FWHM) in radians and θ is the Bragg angle, respectively.
To study the impedance spectroscopy of the ZnO, an MSM (Metal-Semiconductor-Metal) structure was fabricated. ZnO powder paste was prepared by wet mixing of ZnO powder with organic binder PVA and Isopropanol (IPA). The mixtures were subsequently screen printed on an alumina (Al2O3) substrate (10 mm × 10 mm) coated with parallel Platinum (Pt) electrodes (distanced at 0.70 mm apart). The thick film was later dried in an oven at 100 °C for 10 minutes and proceeds with heat treatment at 500 °C for 30 minutes in a tube furnace at normal atmospheric conditions. The electrical measurement was analysed by Agilent impedance analyzer model 4294A at frequencies from 40 Hz to 2 MHz with voltage amplitude of 500 mV.
3. Results and discussion
The reaction mechanisms for both syntheses are represented by the following reactions:(3)
(4)
(5)
In the early stage of reaction shown as Equation (3), iodine anion reacted with zinc cation to produce aqueous of ZnI2. Introducing O2 gas into mixture promotes the reaction via enhancing the growth rate. The time required for a complete reaction (solution turns from red into grey) without the assistance of O2 is about 40 minutes. By introducing O2 gas (via diffusion) in the process, the time required has reduced by 25%, i.e. completed reaction at 30 minutes. ZnI2 was hydrolysed into Zn(OH)2 with the aid of DEA; (CH2CH2OH)2 NH whereas, its carbon chain will stabilise and protects Zn(OH)2 against aggregation via steric hindrance (Equation (4)). Details on the explanation of the role of DEA have been reported in our previous work [Citation36]. Finally, Zn(OH)2 solid particle is further transformed into ZnO by post-heat treatment (Equation (5)).
3.1. Structural properties
Figure shows the powder X-ray diffraction pattern of samples synthesised with excess of O2 under heat treatment at 550, 700 and 850 °C whereas the inset figure represents XRD diffraction pattern for sample prepared without O2 diffusion calcined at 550 °C. The X-ray diffraction studies confirmed that the synthesised materials were ZnO of the wurtzite phase and exhibited polycrystalline structure. The peak position and the peak intensity are in good agreement with the reported JCPDS data card No. 01-070-8070. Data from Figure show that both samples, heat treated at 550 °C, possess excessive Zn content as evidence of Zn reflection peaks at 2θ = 43.2°. Very low intensity of Zn (101) reflection peak was observed in samples prepared in O2 rich medium. In contrast, ZnO prepared without excess of O2 displayed profound Zn (101) diffraction peak with addition of Zn (102) peak at 2θ = 53.3°. These Zn diffraction patterns are based on JCPDS card (01-087-0713).
Figure 1. XRD pattern of the samples synthesised with catalysed O2 and heat treated at 550, 700 and 850 °C. The inset figure represents XRD pattern for sample prepared without excess of O2 under heat treatment at 550 °C.
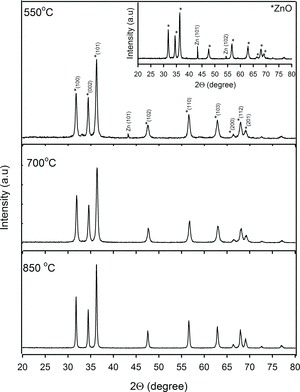
The much lower intensity of Zn (101) diffraction peak observed for sample synthesised with O2 rich is most likely due to decreasing of Zn content as most of the Zn atoms are readily oxidised to form ZnO when heated at 550 °C. Here, we can suggest that the O2 rich environment induced the interaction between the Zn(OH)2 solid surface and O2 molecules since the O2 molecules may be bound to solid surface by Van der Waals force via physical adsorption. As more adsorptive O2 molecules are introduced into the system over time, the gas molecules are expected to form an oxide monolayer that will cover the entire Zn(OH)2 surface. During the post-heat treatment, stronger chemical bond will possibly form between the surface and the O2 monolayer. The stronger bonds of O2 molecules probably support the oxidation process at lower temperature which is depicted by stronger ZnO and low Zn diffraction peak at 550 °C. Whereas, the profound Zn (101) and Zn (102) reflection peaks observed in samples synthesised without O2 rich system showing high concentration of Zn atoms which are not completely transforming into ZnO. Upon heat treatment at 700 and 850 °C, the process has fully transformed the synthesised samples into ZnO, indicated by the absence of Zn (101) and (102) diffraction peaks for both samples discussed earlier. Both samples synthesised with and without O2 rich (not included in the figure due to similar feature with O2 rich samples) displayed sharp and strong intensities of ZnO diffraction peaks implying a better ZnO crystallinity. Narrowing of the peak widths suggests a formation of bigger crystallite size as presented by diffraction peak of samples heated at 850 °C.
Using the Scherrer formula [Citation35] and the line broadening (FWHM) of (101) ZnO phase, the crystallite sizes for samples prepared with and without excess of O2 are tabulated in Table . According to Table , the average crystallite sizes for samples synthesised with and without O2 rich environment increased with respect to calcination temperatures. Nonetheless, there is no significant change of crystallite size detected for both samples upon heat treated at the same temperature which implies that the adsorptive O2 molecule does not affect the crystallite dimension.
Table 1. Average crystallite size calculated via Scherrer equation from (101) plane.
3.2. Surface morphology
Figure shows the scanning electron micrograph of the ZnO nanoparticles synthesised with and without diffusion of O2 after heat treatment of 550, 700 and 850 °C showing a spherical-like shape. There are no other structures observed in both syntheses samples, implying that spherical growth is the favoured shape to form via this synthesis. Furthermore, it signifies that the O2 diffusion does not influence the orientation growth. Samples synthesised with excess of O2 demonstrated dense packing particles and regular texture whereas samples without O2 displayed irregular agglomerated particles and produced macropore structure. The uniformly shape appearance obtained for samples prepared in excess of O2 may be due to formation of oxide layer on the solid surface. The oxide layer may have reduced the vaporisation of water and atomic desorption rate, hence producing less pore compared to sample prepared without excess of O2. Moreover, an appreciably dense packing particle became apparent as temperature increases resulted from uniformity of the particles.
Figure 2. SEM images of prepared ZnO nanoparticles (a)–(c) with excess of O2 (d)–(f) without excess of O2, under heat treatments at 550, 700 and 850 °C, respectively.
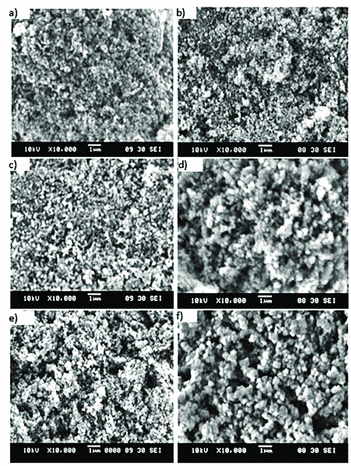
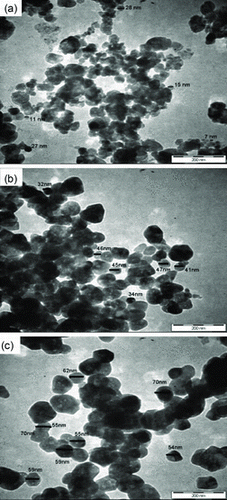
In contrast to samples prepared with excess of O2, sample without diffusion of O2 produced macropore structures arisen from aggression in the water removal process upon intense heating exposure. The particles agglomerated in order to attain lower surface energy as their surfaces are highly reactive. Thus, bigger particle sizes were obtained for ZnO prepared without O2 diffusion heat treated at 850 °C as shown in Figure (f). Comparing both syntheses, samples prepared with excess of O2 exhibit better surface morphology compared to samples synthesised without O2. This shows that preparation technique under the influence of O2 exhibited additional advantages compared to one without O2. As such, further analysis of the samples’ particle's topography by TEM was conducted. Figure displayed TEM images of the prepared ZnO in excess of O2 after heat treatment of 550, 700 and 850 °C, respectively showing a spherical-like shape for all samples. At 550 °C, the particles are inhomogeneous size as they composed of small grains along with larger grains with the size ranging from 7 to 28 nm. Upon calcination at 700 and 850 °C, the particles crystallise into greater size with the size increased in the range from 34 to 54 nm, respectively. Both TEM images and the XRD results show an increment in particle size with respect to temperatures. Nonetheless, the TEM results revealed larger size compared to value calculated from the Scherrer equation as the particles itself comprised of crystallite that clustered together forming particle of ZnO.
3.3. Optical properties
Figure shows PL spectra of ZnO nanoparticles synthesised with excess of O2 under different heat treatment. The inset figure shows PL spectra without excess of O2 for comparison. Photon energy and peak position of the prepared samples are as depicted in Table . Emission peak of pure ZnO is characterised at 370 nm in UV region (NBE). This near-band-edge (NBE) transition is corresponded to recombination of photo-generated electron with holes in the valence band [Citation37]. However, the visible luminescence is also observed that can be associated with different vacancies and defect state emissions [Citation24]. Single violet emissions are obtained from all ZnO samples prepared with excess of O2 with the highest emission peak which lies at 417 nm and belongs to 850 °C heat treatment. By contrast, intense violet emission along with emission in the green band was present for all samples prepared without excess of O2 with the strongest violet emission peak observed at 410 nm.
Table 2. Peak position and photon energy of the synthesised ZnO sample.
Figure 4. PL spectra of ZnO nanoparticles synthesised with excess of O2 under different heat treatment. The inset shows PL spectra without excess of O2 for comparison.
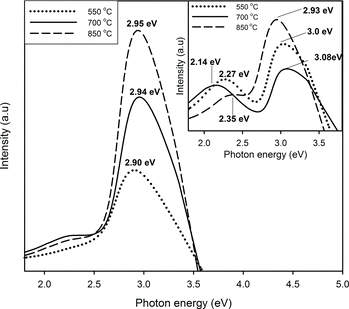
When the process temperature is set at 850 °C, samples produced in O2 rich show increasing violet intensity due to high concentration of defects and yet showing the enlargement of the energy band gap closer to that of pure ZnO. Reason for the increasing of the energy band gap for this sample is most likely due to the improvement in morphology compared without excess of O2, e.g. large distribution of micropore structure observed in Figure (f). As shown by the single violet emission, the O2 rich condition has proven to reduce defects via substitution of O atomic vacant recovered from oxide monolayer built-up on the surface. Samples synthesised without excess of O2 also showing increment in violet emission intensity, but with declining of band gap separation as the temperature increases. This reduction may be attributed to poor crystalline as high temperature will promote defects to the crystalline structure. Lower calcination temperature, considerably at 550 °C, is preferred for better ZnO stoichiometry as the energy band gap is 3.08 eV close to 3.37 eV, whereas ZnO heated at 850 °C possesses energy of 2.93 eV.
The possible reason of violet emission may originate from Zn-related defect, which can either Zn interstitial or Zn vacancies [Citation38] whereas origins of green luminescence are still inconclusive. Earlier studies suggested the presence of foreign element like Cu was attributed for emission [Citation39]. Native defects like interstitial Zn and oxygen have also been suggested as a potential source [Citation40,41]. Previous studies have suggested that oxygen vacancies in deep level are responsible for green emission [Citation42] while other works suggested that the major part of the visible emission originates from the defect centres on the surface of the nanoparticles [Citation43]. Based on calculation energy levels of various intrinsic defects in ZnO done by Sun [Citation44], where he applied full-potential linear muffin-tin orbital method, the calculated result is shown in Figure . According to Sun's calculation results, the energy interval from the bottom of the conduction band to the Zn vacancy (VZn) level is 3.06 eV, whereas the measured energy interval from the upside of the valence band to interstitial zinc (Zni) level is 2.90 eV. Correlating Sun's work to our results, the energy of violet emission observes for samples prepared in excess of O2 is in reasonable agreement with the predicted transition energy (2.9 eV). Thus, the violet emission corresponds to the recombination of an electron in the zinc interstitial and a hole in the valence band. The oxide monolayer that forms on the solid surface will cover the internal Zn atom upon heating under variation temperature thereby promoting interstitial Zn defects in our sample.
The energy of violet emission observes for samples synthesised without excess of O2 (550 and 700 °C) is in agreement with transition energy from the bottom of the conduction band to the Zn vacancy level (3.06 eV). The Zn vacancy defects in our samples probably arise from vaporisation of Zn atoms upon the direct heating process. The possible reason for green emission of our samples is assigned to surface state defects. As the particles size increases correspond to increment of temperature, the volume fraction increases and may attract oxygen vacancies at the surface [Citation43]. The crystallite sizes calculated using effective mass approximation for samples prepared with O2 catalysed are 25 nm (550 °C), 26 nm (700 °C) and 26 nm (850 °C) whereas without excess of O2 are 26 nm, 31 nm and 29 nm at 550 °C, 700 °C and 850 °C, respectively. The crystallite size calculated via effective mass approximation is within the range as calculated by Scherrer equation.
3.4. Electrical properties
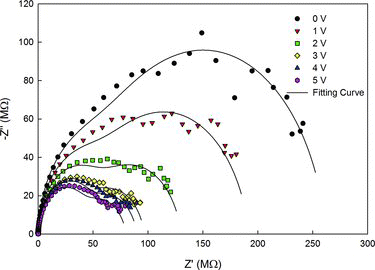
The impedance spectra of ZnO biased from 0 to 5 V for sample synthesised under O2 diffusion (850 °C) are shown in Figure . The spectrum displayed two partially overlapping semicircles with both arcs decreased as the bias voltage increased from 0 to 5 V. The presence of the two semicircles implies different relaxation times between the MSM ZnO impedance (Z) components. From the spectrum, it was reported that the low-frequency arc can be interpreted as a result of grain boundary effects whereas the higher-frequency arc is due to the effect of the grain interior [Citation45]. Data analysis from Figure stated in Section 3.3 implied that the high intensity of violet emission is due to large concentration of interstitial zinc atoms. This interstitial zinc atom is known to produce a large number of defects, donor levels and trap that can capture free electrons from adjoining grains [Citation46] thus increased the conductivity of ZnO as depicted by the low-impedance complex relative to increase of voltage. The behaviour of high resistance at low voltages and low resistance at high voltages as displayed in Figure exhibits the non-linear current–voltage characteristics that is desirable for varistor application. Nonetheless, further studies on the electrical part are still required to realise the device application.
4. Conclusions
In conclusion, we successfully synthesised ZnO nanoparticles via precipitation method with O2 serves as the catalyst. The presence of O2 in the reaction proves to shorten the reaction process. Besides serving as a catalyst, diffusion of O2 influences the structural, morphology and optical behaviour of ZnO nanoparticles normal dependence on the variation temperatures of heat treatment. ZnO nanoparticles synthesised with O2-catalysed posses better crystalline and exhibit single violet emission. In contrast, poor crystalline structure, violet band along with green emission peaks was observed for samples synthesised without excess of O2. Based on the impedance result, the synthesised ZnO nanoparticles can be applied in improving semiconductor device performance such as metal-oxide varistor.
Acknowledgements
This work has been supported by Universiti Sains Malaysia through USM-RU-Grant (1001/PFIZIK/814113) and short-term grant USM Research University Postgraduate Research Grant Scheme (RU-PRGS).
References
- Lim JH, Kang CK, Kim KK, Park IK, Hwang DK, Park SJ. UV electroluminescence emission from ZnO light-emitting diodes grown by high-temperature radio frequency sputtering. Adv Mater. 2006;18:2720–2724.
- Liang HK, Yu SF, Yang HY. Directional and controllable edge-emitting ZnO ultraviolet random laser diodes. Appl Phys Lett. 2010;96:101116–101118.
- Aeugle T, Bialas H, Heneka K, Pleyer W. Large area piezoelectric ZnO film transducers produced by r.f. diode sputtering. Thin Sol Films. 1991;201:293–304.
- Li C, Yu ZS, Fang SM, Wang HX, Gui YH, Xu JQ, Chen RF. Fabrication and gas sensing property of honeycomb-like ZnO. Chinese Chem Lett. 2008;19:599–603.
- Lakshmi Kantam M, Kumar KBS, Sridhar C. Nanocrystalline ZnO as an efficient heterogeneous catalyst for the synthesis of 5-substituted 1H-tetrazoles. Adv Synt Catal. 2005;347:1212–1214.
- Guillen E, Azaceta E, Peter LM, Zukal A, Tena-Zaera R, Anta JA. ZnO solar cells with an indoline sensitizer: a comparison between nanoparticulate films and electrodeposited nanowire arrays. Energy Env Sci. 2011;4:3400–3407.
- Zheng K, Shen H, Li J, Sun D, Chen G, Hou K, Li C, Lei W. The fabrication and properties of field emission display based on ZnO tetrapod-liked nanostructure. Vacuum. 2008;83:261–264.
- Jagadish C, Pearton SJ. Zinc oxide bulk, thin films and nanostructures processing, properties and applications. Amsterdam: Elsevier; 2006.
- Estruga M, Dominga C, Ayllon JA. Solution-processable ZnO nanoparticles obtained by low-temperature solventless synthesis. J Mater Chem. 2011;21:4408–4415.
- Park WI, Yi GC, Kim M, Pennycook SJ. ZnO nanoneedles grown vertically on Si substrates by non-catalytic vapor-phase epitaxy. Adv Mater. 2002;14:1841–1843.
- Maiti UN, Nandy S, Karan S, Mallik B, Chattopadhyay KK. Enhanced optical and field emission properties of CTAB-assisted hydrothermal grown ZnO nanorods. Appl Surf Sci. 2008;254:7266–7271.
- Kashif M, Usman Ali SM, Ali ME, Abdulgafour HI, Hashim U, Willander M, Hassan Z. Morphological, optical, and Raman characteristics of ZnO nanoflakes prepared via a sol–gel method. Phys Stat Solidi (A). 2012;209:143–147.
- Tong YH, Liu YC, Shao CL, Mu RX. Structural and optical properties of ZnO nanotower bundles. Appl Phys Lett. 2006;88:123111–123113.
- Li C, Yu Z, Fang S, Wang H, Gui Y, Xu J, Chen R. Preparation and performance of ZnO nanoparticle aggregation with porous morphology. J Alloys Compd. 2009;475:718–722.
- Liqiang J, Baiqi W, Baifu X, Shudan L, Keying S, Waimin C, Honggang F. Investigations on the surface modification of ZnO nanoparticle photocatalyst by depositing Pd. J Sol State Chem. 2004;177:4221–4227.
- Meulenkamp EA. Synthesis and growth of ZnO nanoparticles. J Phys Chem B. 1998;102:5566–5572.
- Senthilkumar K, Senthilkumar O, Yamauchi K, Sato M, Morito S, Ohba T, Nakamura M, Fujita Y. Preparation of ZnO nanoparticles for bio-imaging applications. Phys Stat Solidi (B). 2009;246:885–888.
- Azam A, Ahmed F, Arshi N, Chaman M, Naqvi AH. Formation and characterization of ZnO nanopowder synthesized by sol-gel method. J Alloys Compd. 2010;496:399–402.
- Wang M, Na EK, Kim JS, Kim EJ, Hahn SH, Park C, Khoo KK. Photoluminescence of ZnO nanoparticles prepared by a low-temperature colloidal chemistry method. Mater Lett. 2007;61:4094–4096.
- Sahoo T, Kim M, Baek JH, Jeon SR, Kim JS, Yu YT, Lee CR, Lee IH. Synthesis and characterization of porous ZnO nanoparticles by hydrothermal treatment of as pure aqueous precursor. Mater Res Bull. 2011;6:525–530.
- Lim BP, Wang J, Ng SC, Chew CH, Gan LM. A bicontinuous microemulsion route to zinc oxide powder. Ceram Int. 1998;24:205–209.
- Vijayan T, Chandramohan R, Valanarasu S, Thirumalai J, Subramanian S. Comparative investigation on nanocrystal structure, optical, and electrical properties of ZnO and Sr-doped ZnO thin films using chemical bath deposition method. J Mater Sci. 2008;43:1776–1782.
- Goswami N, Sharma DK. Structural and optical properties of unannealed and annealed ZnO nanoparticles prepared by a chemical precipitation technique. Physica E: Low-dimensional Systems and Nanostructures. 2010;42:1675–1682.
- Vanheusden K, Seager CH, Warren WL, Tallant DR, Caruso J, Hampden Smith MJ, Kodas TT. Green photoluminescence efficiency and free-carrier density in ZnO phosphor powders prepared by spray pyrolysis. J Luminescence. 1997;75:11–16.
- Thangadurai P, Zergioti I, Saranu S, Chandrinou C, Yang Z, Tsoukalas D, Kean A, Boukos N. ZnO nanoparticles produced by novel reactive physical deposition process. App Surf Sci. 2011;257:5366–5369.
- Reuge N, Bacsa R, Serpe P, Caussat B. Chemical vapor synthesis of zinc oxide nanoparticles: experimental and preliminary modeling studies. J Phys Chem C. 2009;113:19845–19852.
- Yang J, Liu X, Yang L, Wang Y, Zhang Y, Lang J, Gao M, Feng B. Effect of annealing temperature on the structure and optical properties of ZnO nanoparticles. J Alloys Compd. 2009;477:632–635.
- Thongsuriwong K, Amornpitoksuk P, Suwanboon S. The effect of aminoalcohols (MEA, DEA and TEA) on morphological control of nanocrystalline ZnO powders and its optical properties. J Phys Chem Sol. 2010;71:730–734.
- Sudha M, Senthilkumar S, Hariharan R, Suganthi A, Rajarajan M. Controlled reduction of the deleterious effects of photocatalytic activity of ZnO nanoparticles by PVA capping. J Sol-Gel Sci Technol. 2012;61:14–22.
- Xu F, Zhang P, Navrotsky A, Yuan ZY, Ren TZ, Halasa M, Su BL. Hierarchically assembled porous ZnO nanoparticles: synthesis, surface energy, and photocatalytic activity. Chem Mater. 2007;19:5680–5686.
- Ooi MDJ, Abdul Aziz A, Abdullah MJ. Formation of ZnO nanocrystalline via facile non-hydrolytic route. AIP Conf Proceed. 2011;1341:11–14.
- Kayanuma Y. Quantum-size effects of interacting electrons and holes in semiconductor microcrystals with spherical shape. Phys Rev B. 1988;38:9797–9805.
- Beni G, Rice TM. Theory of electron-hole liquid in semiconductors. Phys Rev B. 1978;18:768–785.
- Tan ST, Chen BJ, Sun XW, Fan WJ, Kwok HS, Zhang XH, Chua SJ. Blueshift of optical band gap in ZnO thin films grown by metal-organic chemical-vapor deposition. J Appl Phys. 2005;98:013505–1–013505–5.
- Birkholz M. Thin film analysis by X-ray scattering. Weinheim: Wiley; 2006.
- Ooi MDJ, Abdul Aziz A, Abdullah MJ. Influence of calcinations temperatures on structural and photoluminescence properties of ZnO nanoparticles via precipitation method. Adv Mater Res. 2011;364:510–514.
- Xiong H-M. Photoluminescent ZnO nanoparticles modified by polymers. J Mater Chem. 2010;20:4251–4262.
- Zeng H, Duan G, Li Y, Yang S, Xue X, Cai W. Blue luminescence of ZnO nanoparticles based on non-equilibrium processes: defect origins and emission controls. Adv Funct Mater. 2010;20:561–572.
- Mishra KC, Schmidt PC, Johnson KH, DeBoer BG, Berkowitz JK, Dale EA. Bands versus bonds in electronic-structure theory of metal oxides: application to luminescence of copper in zinc oxide. Phys Rev B. 1990;42:1423–1430.
- Kohan AF, Ceder G, Morgan D, Van de Walle CG. First-principles study of native point defects in ZnO. Phys Rev B. 2000;61:15019–15027.
- Reynolds DC, Look DC, Jogai B, Markoc H. Similarities in the band edge and deep-centre photoluminescence mechanisms of ZnO and GaN. Sol State Comm. 1997;101:643–646.
- Ye JD, Gu SL, Qin F, Zhu SM, Liu SM, Zhou X, Liu W, Hu LQ, Zhang R, Shi Y, Zheng YD. Correlation between green luminescence and morphology evolution of ZnO films. App Phys A: Mater Sci Process. 2005;81:759–762.
- Wang ZG, Zu XT, Zhu S, Wang LM. Green luminescence originates from surface defects in ZnO nanoparticles. Physica E: Low-dimensional Systems and Nanostructures. 2006;35:199–202.
- Sun YM. FP-LMTO study on the electronic structure of ZnO and its defects. Ph.D. Thesis. Anhui, China: University of Science and Technology of China; 2000.
- MacDonald JR, editor. Impedance spectroscopy, emphasizing solid materials and systems. New York: John Wiley & Sons; 1987.
- Nan C-W, Holten S, Birringer R, Gao H, Kliem H, Gleiter H. Anomalous space-charge limited currents in nanocrystalline ZnO. Phys Stat Sol (a). 1997;164:R1–R2.

