
Abstract
Silver nanoparticles (NPs) functionalised with L-histidine is synthesised by a chemical reduction approach using two different methods of stirring – using a magnetic stirrer and an ultrasonicator. The former method exhibits a strong narrow absorption peak at 396 nm and the latter a blue-shifted weak broad plasmon band for the bare silver NPs. When the capping agent is incorporated, a single broad peak at low intensity evolves for the first method of stirring whereas two distinct peaks are noticed for the second. The Transmission Electron Microscope (TEM) results confirm the spherical shape of the silver NPs in the first case. In the second case, both spherical and elliptical particles are obtained. Zeta potential measurements further confirm the stability of the histidine-capped silver NPs in comparison with the pure silver NPs. A study of the variation of the plasmon peak with pH indicates that a basic medium favours the growth of the histidine-capped silver NPs. A surface-enhanced Raman scattering investigation confirms the adsorption of the capping molecule through the nitrogen of the imidazole ring with the carboxylate group pointing outwards. L-histidine-capped silver NPs can find application in biosensors and biomedicine, particularly when prepared by the magnetic stirrer method due to its greater stability.
1. Introduction
Nanoparticles (NPs) have unique spectroscopic, electronic and chemical properties that are determined by their small size and high surface/volume ratio.[Citation1] They find wide applications in industry,[Citation2] catalytic action,[Citation3] information storage,[Citation4] biomedical processes[Citation5] and electronics.[Citation6] Noble metal NPs have attracted considerable attention due to their diverse properties and have been proposed as non-toxic carriers for drug and gene delivery applications.[Citation7] Applications of silver NPs include magnetic and optical polarisability, electrical conductivity, catalysis, antimicrobial behaviour, DNA sequencing, surface-enhanced Raman scattering (SERS) and thermal properties.
Although several methods [Citation8–10] of synthesising silver NPs are available, chemical reduction [Citation8] is one of the most frequently applied methods to prepare them as colloidal dispersions in water or organic solvents. AgNO3 is the most commonly used precursor when preparing Ag NPs via the reduction route because of its good stability in polar solvents.[Citation11] Sodium borohydride is one of the several chemicals that is used as a reducing agent in the preparation of silver NPs.[Citation12,13] The reduction of silver ions in aqueous solution generally yields colloidal silver with particle diameters of several nanometres. The NPs, when formed, need to be stabilised and any possible agglomeration must be prevented. Functionalisation of noble metal NPs can be performed by either using chemical functional groups or biological molecules. These include polymers such as different kind of polyethylene glycol, polyvinyl alcohol, polyvinyl pyrilidon, surfactants like sodium dodecyl sulphate, Tween 80, triton and carbohydrates like chitosan.[Citation12] Proteins, polysaccharides, lipids, peptides and amino acids are among the most studied organic biomolecules responsible for directing crystal growth and can be considered as capping agents in the production of nanocrystals.[Citation14] The use of biomolecules as capping agents for silver colloids has shown some advantages, since the biomimetic coating could favour interactions with biological systems.[Citation15,16] They are used in biomedical applications as sensors and for its therapeutic applications.[Citation17]
Amino acids are interesting compounds, as they exhibit molecular chirality, absence of strongly conjugated bonds and zwitterionic nature of the molecule.[Citation18] L-histidine, one of the important amino acids, plays a vital role in the biochemical, biomedical and metallic–enzymatic reactions.[Citation19] L-histidine-capped silver NPs were recently synthesised by Liu et al. [Citation19,20] using hydrothermal method. The ab initio molecular orbital calculation of L-histidine over silver and gold NPs was reported by Lim et al. [Citation21].
It has been established that size, shape, stability, colour and other properties strongly depend on the method of preparation as well as on the experimental conditions such as reactants, stabiliser, pH and order of mixing of reactants.[Citation8] These changes affect the surface polarisation and alter the spectral profile of the surface plasmon resonance (SPR).
In this paper, the synthesis of L-histidine-capped silver (His–Ag) NPs using the chemical reduction route under two different methods of stirring (magnetic stirrer and ultrasonicator) is reported. The two different methods of stirring impose different experimental conditions which affect the shape, size, surface charge and the structure of the synthesised NPs and these have been investigated.
2. Experimental
2.1. Materials
Silver nitrate (AgNO3) of 99.8% purity (NICE) was used as a precursor, L-histidine (C6H9N3O2 99.0% – HIMEDIA) as the capping agent and sodium borohydride (NaBH4 ≥95% – MERCK) as the reducing agent. Nitric acid (HNO3) and sodium hydroxide (NaOH) were used to adjust the pH and accelerate the oxidation and reduction reactions in water. All chemicals were of analytical grade and used as purchased without further purification. Millipore water was used throughout the experiments.
2.2. Synthesis
2.2.1. Synthesis of silver NPs
Silver sol was prepared according to Creighton's method.[Citation22] In brief, 20 mL of silver nitrate solution (1 mM) was added dropwise to 60 mL of sodium borohydride solution (1 mM) with vigorous stirring. Before addition both the solutions were chilled to ice temperature.
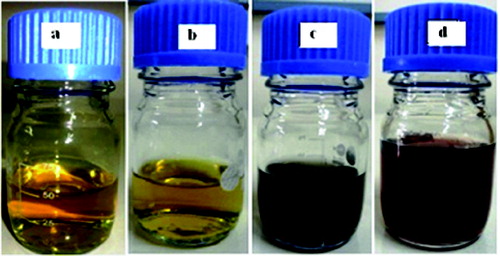
For one sample, vigorous stirring was achieved through the magnetic stirrer (MS method) and for the other with an Excelsonics-UCI 001 ultrasonicator (US method). The frequency of the ultrasonic waves produced was 30 ± 3 kHz. In both the cases, after the complete addition of AgNO3, a yellow solution (silver sol) was obtained ( and (b)) which was stable for about a month.
Figure 1. Ag NPs prepared with (a) magnetic stirrer and (b) ultrasonicator. His–Ag NPs prepared by (c) magnetic stirrer and (d) ultrasonicator.
2.2.2. L-histidine-capped silver NPs
To 20 mL of AgNO3 (1 mM), 8 mL of L-histidine (1 mM) was added drop by drop and stirred in the magnetic stirrer/ultrasonicator. The as-prepared L-histidine-mixed AgNO3 solution was added drop by drop to 60 mL of NaBH4 (1 mM) solution with vigorous stirring using the magnetic stirrer/ultrasonicator. There was a noticeable change in the colour from yellow to greenish grey () for the MS method and to dark brown for the US method (), and their pH was 8.1 and 9.1, respectively. Both solutions were stable for more than a month. HNO3 and NaOH were used to vary the pH from 3.7 to 11.5 for the MS method and from 4.2 to 13.1 for the US method.
2.3. Characterisation
A double beam spectrophotometer (Helious alpha) was used for the absorption spectrum measurement. In every case Millipore water was taken as the blank solution. To obtain the Transmission Electron Microscope (TEM) images, the colloid was drop casted on a carbon-coated Cu grid and the solvent was allowed to evaporate. The specimen was examined on an FEI-Tecnai 30G2S-Twin transmission electron microscope at 300 kV.
The zeta potential of the synthesised Ag NPs and the L-histidine-capped silver (His–Ag) NPs was determined by a Zetasizer (Malvern instruments) with 173° backscattered detection angle equipped with an He–Ne laser of wavelength 632.8 nm and beam diameter 0.63 nm.
The Raman spectrum was recorded by backscattering geometry using He–Ne laser with the excitation of 633 nm and 16 mW power coupled with a LABRAM-HR 800 micro-Raman spectrometer equipped with 50X objectives, appropriate notch filter and Peltier-cooled charge-coupled device detector. The analysis was carried out at room temperature.
3. Result and discussion
3.1. Absorption studies
Conduction electrons on the surface of silver NPs undergo a collective oscillation known as SPR due to its strong interaction with the incident light. For spherical NPs much smaller than the wavelength of light, the electromagnetic field is uniform across the particle causing all the conduction electrons to move in-phase producing only dipole-type oscillations manifested by a single, narrow peak in the SPR spectrum. As the size increases and deviates from the spherical shape, the field across the particle becomes non-uniform. Phase retardation then broadens the dipole resonance and excites higher multi-pole resonances.[Citation23] Further, the oscillating electrons induce polarisation of the opposite direction in the surrounding medium which reduces the restoring force for the electrons resulting in a shift in the SPR.[Citation23–26]
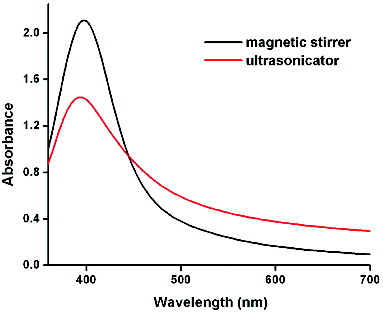
shows the absorption spectra of the pure silver sol prepared by the MS and US methods on the first day. The former consists of a very narrow and intense (2.1) plasmon absorption band at 396 nm [Full Width at Half Maximum (FWHM) = 71.58 nm], while the latter has a lower absorbance (1.4), is blue-shifted at 392 nm and is broader (FWHM = 80.58 nm). Both samples exhibit only one peak, indicating that the particles are indeed silver NPs.[Citation27] The sample prepared with the US method indicates a fewer number of the absorption species (Ag NPs) in the solution as compared to the MS method. The broadening of the peak in the US method indicates that the size distribution of the particles becomes wider.[Citation28] In the ultrasonicator, two types of field, namely the standing-wave field and diffusion field, are possible for the flat-bottomed vessel and round-bottomed vessel, respectively. In the present case, a flat-bottomed flask was used. The silver NPs formed in this standing-wave field are spherical, hexagonal or irregular shaped. The standing wave, by nature, fluctuates only in a limited region of space; hence the particles are constrained to grow along some specific directions.[Citation29]
Figure 2. UV/Vis absorption spectra of Ag NPs for MS and US methods of stirring.
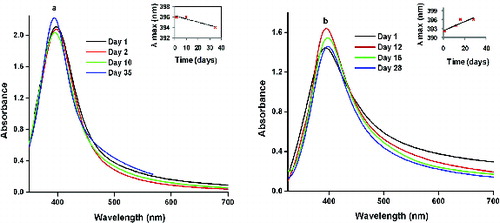
To monitor the stability of the silver colloid, the UV/Vis absorption was measured for the colloid at different periods of time. For the MS method of preparation (), the sample showed no obvious change in peak position for the first 10 days, except for a small decrease in absorbance indicating a decrease in the amount of silver NPs present.[Citation28] However, for the NPs obtained from the US method (), the absorption peaks shifted towards the red wavelength from day 1 to day 28, which indicates an increase in the particle size due to agglomeration.[Citation28] The silver sol retained its pale yellow colour and no precipitate was formed for both the methods even after 2 months.
Figure 3. UV/Vis absorption spectra of Ag NPs at various days for the (a) MS and (b) US methods (inset shows the variation of the absorption maximum with time).
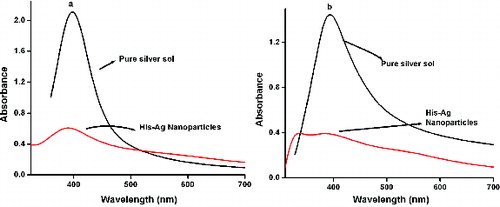
and (b) shows the UV/Vis absorption spectrum of the His–Ag colloidal solution for the MS and US methods. In the MS method, when the capping agent was incorporated, a slight peak shift to shorter wavelength is observed, accompanied by a widening of the band. It can be inferred that though the NP size is polydispersed, smaller-sized particles are also obtained. In the US method, on the other hand, two distinct peaks are noticed in the spectrum. The lower wavelength peak at 336 nm is attributed to the absorption of the histidine molecule. This indicates that not all the histidine molecules have been adsorbed onto the silver NPs.[Citation30]
Figure 4. UV/Vis absorption spectrum of pure Ag and His–Ag colloidal solution for the (a) MS and (b) US methods.
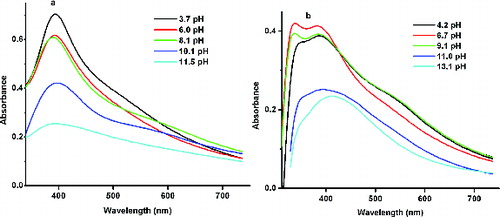
and (b) shows the UV/Vis absorption spectrum of the His–Ag NPs synthesised by the MS and US methods at different pH values. For reasons of clarity only a few spectra in the acidic and basic media are displayed. For the MS method of preparation, the peak position remained the same at 392 nm, but there was a damping of the SPR peak from 0.704 to 0.255. The position of the band remained almost constant at 392 nm. However, the peaks become broader with increasing basicity indicating that the NPs are becoming polydispersed. In contrast, the NPs prepared with the US method behave differently. In the acidic (pH = 4.2, 6.7) and the as-prepared basic medium (pH = 9.1), two closely spaced peaks of large intensity are noticed. In the more basic media (pH > 9.1), all the histidine molecules are incorporated into the Ag–His NPs as indicated by the absence of the band at 336 nm.
Figure 5. UV/Vis absorption spectra at different pH for the His–Ag colloidal solution prepared using (a) magnetic stirrer and (b) ultrasonicator.
3.2. TEM analysis
Some interesting insights were obtained by analysing the TEM images of both the pure Ag and the as-prepared Ag–His NPs taken under different magnifications for the two methods of preparation.
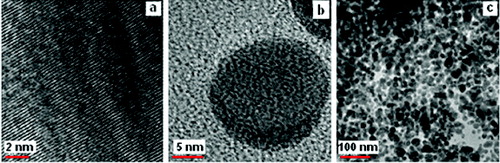
The high crystalline nature of the NPs prepared by the magnetic stirrer is established by the lattice fringes in TEM images as seen in .[Citation31] The pure Ag NPs are spherical in nature with the particle diameter ranging from 20 nm to 40 nm ((b) and (c)).
Figure 6. TEM image of the synthesised Ag NPs using MS method at different magnifications.
When capped with L-histidine, the His–Ag NPs spherical particles are formed that have diameters in the range 10–36 nm. A few elongated particles are also seen with aspect ratio in the range 1.1–2.2 (). The light images connecting spherical darker regions () are indicative of the capping moieties attached to the metal NPs. shows that the His–Ag NPs are interlinked in a somewhat orderly though complex network which has some linearity probably due to hydrogen bonds associated with the COO− moiety in the aqueous media. This provides a cross-linked structure to the colloidal silver NPs which stabilises the Ag NPs in an aqueous medium.[Citation32]
Figure 7. TEM image of the synthesised His–Ag NPs using MS method at different magnifications.
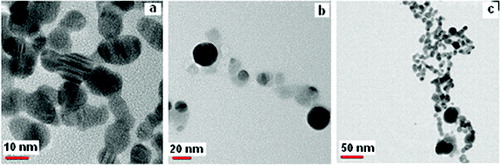
The morphology of the sonochemically synthesised silver NPs is different from that synthesised by the magnetic stirrer. The TEM images without the capping agent show that apart from spherical particles few elongated particles have also been synthesised. The spherical particles have diameters ranging from 7 nm to 37 nm while the elliptical particles have an aspect ratio of ∼1.52 (–(c)). Though a decrement in the particle size has been observed, the uniformity in shape is inferior to the NPs prepared by the MS method with more non-spherical particles being obtained. Further, a number of crystal defects are noticed and are circled in the TEM images.
Figure 8. TEM image of the synthesised Ag NPs using US method at different magnifications.
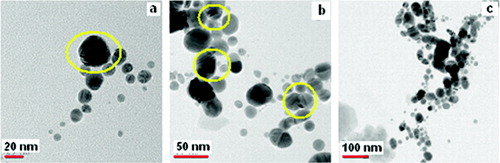
For the His–Ag NPs, spherical particles of diameter ranging from 13 nm to 20 nm are observed along with elliptical-shaped particles with aspect ratio ranging from 1.1 to 3.8. The crystalline nature of the His–Ag NPs is seen clearly in the TEM image ().
Figure 9. TEM image of the synthesised His–Ag NPs using US method at different magnifications.
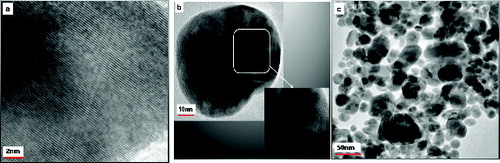
Twinning is one of the most commonly noticed planar defects in nanocrystals, and is frequently observed for face-centred cubic (fcc) structured metallic nanocrystals. Twinning results when two subgrains share a common crystallographic plane. The structure of one subgrain is then a mirror image of the other through the twinning plane. The two most typical examples of a multiply twinned structure are decahedron and icosahedron.[Citation11] Starting from an fcc structured tetrahedron, a decahedron is assembled from five tetrahedrons sharing an edge. If the observation direction is along the fivefold axis, in an ideal situation, each tetrahedron shares an angle of 70.5° – five of them can only occupy a total of 352.6° leaving a 7.4° gap. A strain is therefore induced in the particle to fill the gap. Multiple twinning is the favourable structural configuration when the particles are small [Citation11], possibly because of the smaller surface and volume energies. For the twinned particles, a part of the particles may show bright contrast as compared to the other parts, providing an easy technique for identifying the presence of twins and their distribution among the particles, with the easiest orientation for identification being the fivefold symmetry axis. One multiply twinned nanocrystal (MTN) is shown in with part of the twinning highlighted in the inset. The occurrence of particles with varying morphologies () produced is in keeping with the broad nature of the corresponding UV/Vis absorption spectra () of this sample.
The average radius of silver NPs is mainly dependent on reaction time and reaction temperature.[Citation33] In the present study, the reaction time is the same for both the methods. The formation of particles of different shapes in the US method may be attributed, at least partly to the heat generated during the process of sonication. In addition, the final products have shapes which vary from the standard ones due to surface capping effects, defect structures or crystal overgrowth. In the present case, surface capping seems to have a distinct impact on the shape displayed by the nanocrystal. The binding affinity of a capping agent is expected to vary from one crystal facet to another due to the standing wave which enhances the growth of that facet at the expense of other surfaces.[Citation11]
3.3. Zeta potential analysis
Zeta potentials of the silver sol prepared by both methods were measured to corroborate with the spectroscopic findings. The zeta potential indicates the degree of repulsion of adjacent charged particles which are similar. In solution, molecules associate with the NP surface and these surface-bound molecules establish a double layer of charge that prevents NP aggregation. The surface of the NP is dynamic and is strongly influenced by its immediate environment. The zeta potential is a measure of the particle's stability. NPs with zeta potential greater than 20 mV or less than −20 mV have sufficient electrostatic repulsion to remain stable in solution.[Citation34] The zeta potential of the silver sol prepared by the MS method is −14.9 mV and that by the US method is −18.8 mV.
The average zeta potential for the as-prepared L-histidine-capped Ag NPs is −26.6 mV and −26.7 mV for the MS and US methods of preparation, respectively. L-histidine-capped Ag NPs show better stability for both the methods when compared to the pure Ag NPs.
3.4. Raman analysis
gives the normal Raman spectrum (nRS) of L-histidine together with the SERS spectrum of the His–Ag NPs prepared by the MS and US methods of stirring. SERS is the phenomenon where strong enhanced Raman signals are produced by the molecules attached to the nanometre-sized metallic structures. This is one of the methods to confirm the presence of a capping layer on the NP's surface [Citation11] and identify the site of adsorption. Few bands of enhanced intensities have been generated in SERS by the strong interaction of L-histidine with the local electric field formed on the silver NP surface. The spectroscopic assignments for these vibrations are listed in .
Table 1. nRS and SERS data and vibrational assignment of L-histidine on Ag for the MS and US methods.
Figure 10. (a). nRS of L-histidine and SERS of His–Ag NPs for (b) MS and (c) US methods.
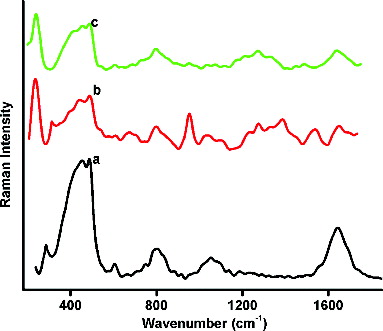
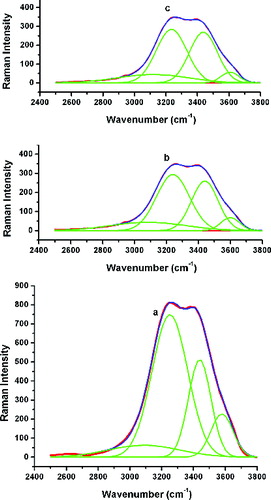
The bands observed at 236 cm−1 and 239 cm−1 are assigned to the Ag–N stretching band. This band is not found in the nRS of pure L-histidine () and is an indication that the capping ligand has been adsorbed on the metal NP through an Ag–N linkage. That this N associated with the imidazole ring is confirmed by the enhancement of the vibrations associated with the ring. Further, no enhancement of the vibrations associated with the amine group is evident in the deconvoluted SERS of the His–Ag NPs in comparison with those of the nRS in the 3000–3800 cm−1 range ().
Figure 11. Deconvoluted (a) nRS of L-histidine and SERS of His–Ag NPs for the (b) MS and (c) US methods.
Well-enhanced =C–N stretching modes at 953 cm−1 and 1038 cm−1 together with a shoulder at 1097 cm−1 are observed in the SERS spectra, while in the nRS these are observed within one broadband centred at 1053 cm−1. Most of the ring stretching and ring deformation modes have been identified in the SERS between 1038 cm−1 and 1538 cm−1. In every case, the modes are more prominent in the sample prepared by the MS method as compared to that prepared by the US method. These modes are hardly distinguishable in the nRS confirming the attachment of L-histidine through the imidazole ring.
The COO− asymmetric stretch occurs at 1643 cm−1 in the nRS, but is lowered in intensity in the SERS spectrum. This confirms that COO− exposed outwards is consistent with the negative zeta potential obtained for the His–Ag NPs. The observations of this investigation are contrary to the result of Lim et al. [Citation21] who suggested an attachment through the COO− moiety, but is in good agreement with the more recent results obtained by Liu et al. [Citation19] for the attachment of the His–Ag through the imidazole group.
4. Conclusion
Silver NPs have been synthesised by two different methods of stirring – namely the magnetic stirrer method and the ultrasonic method. The as-synthesised silver NPs were spherical with the diameter ranging from 20 nm to 40 nm for the MS method. In contrast to the MS method, the US method showed bare spherical particles with diameter 7–37 nm. In addition to it, elliptical particles were also revealed with the aspect ratio ∼1.52.
The polydispersed nature of L-histidine-capped silver NPs has been identified through the absorption spectrum and further confirmed by the TEM images. The stability of the His–Ag NPs is proved by their zeta potential value. An analysis of the SERS spectra indicates that histidine is adsorbed on the NP surface through the imidazole moiety with the COO− functional group projecting outwards. The MS method of preparation shows no crystal defects. Further, an interlinking between the Ag NPs through the histidine molecule makes it better suited for biosensor and biomedical applications.
Acknowledgements
M. Umadevi is thankful to DST-CURIE and DST-SERB, Government of India, for financial support. We thank Dr. V. Ramakrishnan, Department of Laser Studies, School of Physics, Madurai Kamaraj University, Madurai, India for the use of micro-Raman spectrometer.
Related Research Data
References
- Zedler L, Theil F, Csa ki A, Fritzsche W, Rau S, Schmitt M, Popp J, Dietzek B. Ruthenium dye functionalized gold nanoparticles and their spectral responses. RSC Adv. 2012;2:4463–4471.
- El-Sayed MA. Some interesting properties of metals confined in time and nanometer space of different shapes. Acc Chem Res. 2001;34:257–264.
- Chen MS, Goodman DW. The structure of catalytically active Au on Titania. Science. 2004;306:252–255.
- Chen HM, Liu RS, Li H, Zeng HC. Generating isotropic superparamagnetic interconnectivity for the two-dimensional organization of nanostructured building blocks. Angew Chem Int Ed. 2006;45:2713–2717.
- Cao YWC, Jin R, Mirkin CA. Nanoparticles with Raman spectroscopic fingerprints for DNA and RNA detection. Science. 2002;297:1536–1540.
- Nie S, Emory SR. Probing single molecules and single nanoparticles by surface-enhanced Raman scattering. Science. 1997;275:1102–1106.
- Ghosh P, Han G, De M, Kim CK, Rotello VM. Gold nanoparticles in delivery applications. Adv Drug Deliv Rev. 2008;60:1307–1315.
- Khan Z, Al-Thabaiti SA, Obaid AY, Al-Youbi AO. Preparation and characterization of silver nanoparticles by chemical reduction method. Colloids Surf B Biointerfaces. 2011;82:513–517.
- Zhu YP, Wang XK, Guo WL, Wang JG, Wang C. Sonochemical synthesis of silver nanorods by reduction of silver nitrate in aqueous solution. Ultrason Sonochem. 2010;17:675–679.
- Xu H, Suslick KS. Sonochemical synthesis of fluorescent Ag nanoclusters. ACS Nano. 2010;4:3209–3214.
- Xia Y, Xiong Y, Lim B, Skrabalak SE. Shape controlled synthesis of metal nanoclusters: simple chemistry meets complex physics? Angew Chem Int Ed. 2009;48:60–103.
- Akbarzadeh A, Zare D, Farhangi A, Reza Mehrabi M, Norouzian D, Gangestaninejad S, Moghadam M, Bararpour N. Synthesis and characterization of gold nanoparticles by tryptophan. Am J Appl Sci. 2009;6:691–695.
- El-Kheshen AA, Sanaa F, El-Rab G. Effect of reducing and protecting agents on size of silver nanoparticles and their anti-bacterial activity. Der Pharma Chemica. 2012;4:53–65.
- Dahl AJ, Maddux LSB, Hutchison EJ. Toward greener nanosynthesis. Chem Rev. 2007;107:2228–2269.
- Wigginton NS, De Titta A, Piccapietra F, Dobias J, Neasatyy VJ, Suter MJF, Bemier-Latmani R. Binding of silver nanoparticles to bacterial proteins depends on surface modifications and inhibits enzymatic activity. Environ Sci Technol. 2010;44:2163–2168.
- Singh S, Patel P, Jaiswal S, Prabhune AA, Ramana CV, Prasad BLV. A direct method for the preparation of glycolipid-metal nanoparticle conjugates: sophorolipids as reducing and capping agents for the synthesis of water re-dispersible silver nanoparticles and their antibacterial activity. New J Chem. 2009;33:646–652.
- Kumar CSSR. Biofunctionalization of nanomaterials. 1st ed. Weinheim: Wiley-VCH; 2005.
- Caroline ML, Sankar R, Indirani RM, Vasudevan S. Growth, optical, thermal and dielectric studies of an amino acid organic nonlinear optical material: L-alanine. Mater Chem Phys. 2009;114:490–494.
- Liu Z, Xing Z, Zu Y, Tan S, Zhao L, Zhou Z, Sun T. Synthesis and characterization of L-histidine capped silver nanoparticles. Mat Sci Eng C. 2012;32:811–816.
- Liu Z, Zu Y, Fu Y, Meng R, Guo S, Xing S, Tan S. Hydrothermal synthesis of histidine-functionalized single-crystalline gold nanoparticles and their pH-dependent UV absorption characteristic. Colloids Surf B Biointerfaces. 2012;76:311–316.
- Lim JK, Kim Y, Lee SY, Joo S-W. Spectroscopic analysis of L-histidine adsorbed on gold and silver nanoparticle surfaces investigated by surface-enhanced Raman scattering. Spectrochim Acta A. 2008;69:286–289.
- Creighton A, Blatchford CG, Albrecht MG. Plasma resonance enhancement of Raman scattering by pyridine adsorbed on silver or gold sol particles of size comparable to the excitation wavelength. J Chem Soc, Faraday Trans. 1979;75:790–798.
- Tricker RAR. Introduction to meteorological optics. New York, NY: American Elsevier Publishing; 1970. p. 225–229.
- Evanoff DD Jr, Chumanov G. Synthesis and optical properties of silver nanoparticles and arrays. ChemPhysChem. 2005;6:1221–1231.
- Haes AJ, Hall WP, Chang L, Klein WL, Van Duyne RP. A localized surface Plasmon resonance biosensor: first steps toward an assay for Alzheimer's disease. Nano Lett. 2004;4:1029–1034.
- Poole CP Jr, Owens FJ. Introduction to nanotechnology. New York, NY: Wiley; 2003. Chapter 4; p. 74–86.
- Kiruba Daniel SCG, Sironmani TA, Tharmaraj V, Pitchumani K. Synthesis and characterization of fluorophore attached silver nanoparticles. Bull Mater Sci. 2011;34:639–643.
- Sileikaite A, Prosycevas I, Puiso J, Juraitis A, Tamulevičius S. Investigation of silver nanoparticles formation kinetics during reduction of silver nitrate with sodium citrate. Mater Sci. 2009;15:21–27.
- Umadevi M, Vanelle P, Terme T, Rajkumar BJM, Ramakrishnan V. Fluorescence quenching of 1,4-dihydroxy-2, 3-dimethyl-9,10-anthraquinone by silver nanoparticles: size effect. J Fluoresc. 2009;19:3–10.
- Mardashev SR, Kharitonenkev IG, Semina LA, Gonchar NA. Study of the structure of the histidine decarboxylase of Micrococcus sp.n. by the method of circular dichroism. Bhiokhimiia. 1976;41:308–315.
- Joseph Kirubaharan C, Kalpana D, Lee YS, Kim AR, Yoo DJ, Nahm KS, Kumar GG. Biomediated silver nanoparticles for the highly selective copper(II) ion sensor applications. Ind Eng Chem Res. 2012;51:7441–7446.
- Choi SH, Lee SH, Hwang YM, Lee KP, Kang HD. Interaction between the surface of the silver nanoparticles by g-irradiation and organic molecules containing thiol group. Radiat Phys Chem. 2003;67:517–521.
- Xu Z, Hu G. Simple and green synthesis of monodisperse silver nanoparticles and surface-enhanced Raman scattering activity. RSC Adv. 2012;2:11404–11409.
- Chadha R, Bhandari S, Kataria D, Gupta S, Singh JD. Exploring the potential of lecithin/chitosan nanoparticles in enhancement of antihypertensive efficacy of hydrochlorothiazide. J Microencapsul. 2012;8:805–812.
- Chuang C-H, Chen Y-T. Raman scattering of L-tryptophan enhanced by surface plasmon of silver nanoparticles: vibrational assignment and structural determination. J Raman Spectrosc. 2009;40:150–156.
- Ratajczak H, Barycki J, Pietraszko A, Baran J, Debru S, May M, Venturin J. Preparation and structural study of a novel nonlinear molecular material: the L-histidinum dihydrogenarsenate orthoarsenic acid crystal. J Mol Struct. 2000;526:269–278.
- Puviarasan N, Arjunan V, Mohan S. FTIR and FT-Raman spectral investigations on 4-aminoquinaldine and 5-aminoquinoline. Turk J Chem. 2004;28:53–65.