
Abstract
In this paper, we report that gold nanorods with different aspect ratios are controllably synthesised by a facile modified seed-mediated growth procedure. The growth rate of gold nanorods is lowered by adding H2SO4, and the yield of gold nanorods is improved. Increasing the concentration of AgNO3 yields gold nanorods with different aspect ratios that differed from 1.83 to 5.04. To prevent aggregation of cetyltrimethylammonium bromide (CTAB)-capped gold nanorods and investigate the sensitivity to the solution refractive index, surface modification is carried out. After assembling poly (sodium-p-styrensulfonate) onto the surface of gold nanorods, the samples can disperse well in water and dimethyl sulfoxide. The localised surface plasmon resonance (LSPR) wavelength of the as-prepared gold nanorods redshifts with increasing the refractive index of the solvent and a good linear relationship between LSPR peaks and refractive index is achieved.
1. Introduction
Noble-metal nanocrystals are becoming increasingly important in a variety of scientific fields, especially in the optical, biosensor, cancer-cell imaging and therapeutic fields due to the strong surface plasmon resonance (SPR) absorption and scattering in the visible and near-infrared regions of the electromagnetic spectrum.[Citation1–7] The optical properties are extensively related to the SPR peak position and can be tuned by adjusting nanocrystals in size or shape.[Citation8–10] A number of efforts have been made to prepare gold nanostructures with different morphology and SPR peak position,[Citation11] such as nanosphere, nanorod,[Citation12,13] nanocube,[Citation14] nanostar,[Citation15] nanocage [Citation16] and nanoprism.[Citation17] For example, Xia et al. reported the localised SPR (LSPR) of Au nanocages (structures with both hollow interiors and porous walls) can be precisely tuned to any wavelength in the range of 600–1200 nm by adjusting the thickness of the porous walls. The Au nanocages can be used as contrast enhancement agent in in vivo imaging.[Citation16] However, it is a time-consuming and complicated procedure to prepare gold samples with different morphology. In addition to adjusting gold nanoparticle in size and morphology, the optical properties are tunable by adjusting the aspect ratio (the ratio of the nanorod length to width) of gold nanorods. Therefore, the study on preparing gold nanorods with high monodispersity is still a research focus at present.[Citation18]
The LSPR peak position is sensitive to the refractive index of the medium,[Citation19,20] which is the theoretical foundation for biosensor using gold nanocrystals. For example, Yu et al. prepared gold nanorods with three different aspect ratio. The three gold-nanorod molecular probes were sensitive and highly specific to the targets due to the different SPR peak position.[Citation21] So a systematic research on the relationship between gold nanorod aspect ratio and the refractive index of the medium is another research focus now.[Citation22,23] The seed-mediated growth procedure is a common method to prepare gold nanorods. But the gold nanorods prepared using this method are usually cetyltrimethylammonium bromide (CTAB)-protected and immediately get uncontrollable aggregation in organic media, such as dimethyl sulfoxide (DMSO), N,N-dimethylformamide (DMF) and ethanol. Thus surface modification is needed. Electrostatic layer-by-layer (LbL) assembly of polyelectrolytes around the gold nanorods is the easiest surface-modification method. To date, the researches on gold-nanorod preparation and the SPR property are flourishing. However, the development of practical strategies for the synthesis of gold nanorods with controllable size and aspect ratio still has much room for progress.
In this work, H2SO4 and AgNO3 were added to the growth solution of the seed-mediated growth procedures as aspect-ratio-adjusting agent. The advantages of this method are as follows: (1) AgNO3 with different concentrations in the growth solution can regulate the SPR positions of gold nanorods; (2) H2SO4 in the growth solution can slow down the growth rate of gold nanorods; (3) the as-prepared gold nanorods were uniform and the yield was high ( > 90%); (4) this method was simple and easily scaled up. Then, the sensitivities of gold nanorods to the refractive index of the medium were studied. Because of the positive surface charge (+20 mV) of CTAB- protected gold nanorods, polystyrene sulfonate (PSS) was used to improve the stability. The LSPR peaks of the as-prepared gold nanorods redshifted with increasing the refractive index of the solvent and good linear relationship was achieved.
2. Experimental section
2.1. Chemicals
Sodium borohydride (NaBH4) (AR, purity > 98.0%), chlorauric acid (HAuCl4·3H2O) (AR, Au content ≥ 47.8% ), CTAB (AR, purity > 99.0%), PSS, (MW 70,000) (AR), silver nitrate (AgNO3) (AR) and L-ascorbic acid (AA) (AR, purity > 99.0%) were obtained from Alfa Company and used as received with no further purification. Milli-Q water (18 MΩ·cm) was used for all solution preparations. All glasswares used in the following procedures were cleaned in a bath of piranha solution (H2SO4/30%H2O2 = 7:3 v/v) and boiled for 30 min.
2.2. Synthesis
2.2.1. Synthesis of gold nanorods
Gold nanorods with aspect ratios between 2 and 5 were prepared according to the seed-mediated growth procedure.[Citation12,13,Citation24] The Au seeds were synthesised by chemical reduction of HAuCl4 with NaBH4. The procedure was as follows: 7.5 mL 0.1 mol·L−1 CTAB was mixed with 100 μL 24 mmol·L−1 HAuCl4 and stirred magnetically. Then, 0.6 mL ice-cold NaBH4 (0.01 mol·L−1) was added. The solution colour immediately turned from yellow to brown, indicating the formation of Au seeds. The Au seeds were used within 2–5 h.
The growth solution for the formation of the Au nanorods consisted of 100 mL CTAB (0.1 mol·L−1), 2.04 mL HAuCl4 (0.024 mol·L−1), 2 mL H2SO4 (0.5 mol·L−1), different volumes of AgNO3 (10 mmol·L−1) (0.3, 0.5, 0.75, 1.0, 1.25 and 1.5 mL) and 0.8 mL AA (0.1 mol·L−1). Then 0.24 mL seed solution was added to the above growth solution to initiate the growth of the gold nanorods. After 12 h, the reaction was stopped. The obtained Au nanorods were purified by centrifuging the solution at 12,000 rpm for 5 min twice. The precipitates were collected and redispersed in deionised water.
2.2.2. Modification of gold nanorods with PSS
The as-prepared CTAB-capped gold nanorods aggregated easily in non-aqueous solvent. Surface modification was essential to enhance dispersion stability. To investigate the relationship between LSPR peaks and the solution refractive index, PSS-modified gold nanorods were employed here. The preparation of PSS-modified gold nanorods was as follows: 12 mL of CTAB-capped gold nanorods solution was centrifuged at 12,000 rpm for 10 min. Then the precipitate was dispersed in 12 mL of 2 mg/mL PSS aqueous solution (containing 6 mM NaCl) and stirred magnetically for 3 h. After that, it was centrifuged at 12,000 rpm for 10 min, and the precipitate was redispersed in water or other solutions.
2.3. Characterisations
UV–vis–NIR (ultraviolet–visible–near-infrared) absorption spectra were recorded from a Perkin–Elmer Lambda 950 spectrophotometer. Scanning electron microscopic (SEM) images and transmission electron microscopic (TEM) images were taken on a field emission SEM (Hitachi S-5200). To investigate the relationship between LSPR peaks and the solution refractive index, the mixtures of water and DMSO in different volume ratios were used to fabricate solvents with different refractive index. The refractive indices were measured with an Abbe refractometer.
3. Results and discussion
3.1. The morphology and SPR features of gold nanorods
is the typical TEM image of the as-prepared gold nanorods. The morphology of all the six samples is nanorod shape. When 0.03 mmol·L−1 AgNO3 is used, the morphology of gold nanorods looks like an ellipsoid, with shorter length and larger width. The aspect ratio of this sample is 1.83. When the AgNO3 concentration in the growth solution increases, the length of gold nanorods increases gradually (the detailed data are shown in ), and the width decreases gradually. Thus, the aspect ratios of gold nanorods increase from 1.83 to 5.04. All the TEM images show that gold nanorods are the main product, only a few particles or cubes are formed. When the AgNO3 concentration is lower than 0.1 mmol·L−1, the gold nanorods can easily arrange closely on the ultra-thin carbon film for larger area. When the AgNO3 concentration is higher than 0.1 mmol·L−1, the arrangement of gold nanorods on the ultra-thin carbon film becomes difficult. The reason is that when the AgNO3 concentration is higher than 0.15 mmol·L−1, so many gold nanoparticles are formed. The arrangement of gold nanorods is hampered by the spherical particles.
Table 1. The aspect ratio, length and width of the gold nanorods.
Figure 1. TEM images of the gold nanorods with different aspect ratio prepared in growth solution when the AgNO3 concentrations are as follows: (a) 0.03, (b) 0.05, (c) 0.075, (d) 0.1, (e) 0.125 and (f) 0.15 mmol·L−1. The scale bar is 90 nm.
As shown in the above phenomenon, AgNO3 is used to control the aspect ratio. The relationship between the aspect ratio of the gold nanorods and AgNO3 concentration is shown in . As shown in , when the AgNO3 concentration in the growth solution increases from 0.03, 0.05, 0.075 and 0.1 to 0.125 mmol·L−1, the aspect ratios of gold nanorods increase from 1.83, 2.34, 3.39 and 4.18 to 5.04. The best AgNO3 concentration for controllable gold-nanorod preparation is from 0.03 to 0.15 mmol·L−1. When the AgNO3 concentration is higher than 0.15 mmol·L−1, many gold nanoparticles are formed. When the AgNO3 concentration is lower than 0.03 mmol·L−1, the aspect ratio is usually smaller than 1.8, much alike a sphere shape rather than nanorod.
When AgNO3 concentration is in the range of 0.03–0.15 mmol·L−1, all the TEM images show that the gold nanorods are the main product having high yield. This is because H2SO4 decreased the reducing rate of AA. AA is a reducing agent in this procedure, whose redox potential varies with the pH. For example, the redox potential of AA is 0.127 V when the pH = 4; the redox potential is 0.34 V when the pH = 7; the redox potential is 0.8 V when the pH = 10. In this study, the growth rates of gold nanorods were low due to the low reducing rate of AA when H2SO4 was used. It is worth pointing out that, as the seed concentration in this procedure is twice as much as that used previously in [Citation12,13,Citation24], the yield of the gold nanorods was higher than 90% for all the six experiments.
Furthermore, the gold nanorods synthesised in this study are bigger in size than that prepared previously in [Citation12,13,Citation24]. Taking the sample shown in (d) as an example, the length and width of gold nanorods are 62.61 ± 8.23 nm and 15.26 ± 2.41 nm, respectively. The length and width of gold nanorods according to [Citation13] were about 48.8 nm and 15.2 nm, respectively. shows the SEM images of the samples shown in (b)–(d). It has a cylindrical shape with eight side surfaces. Three edges were usually observed.
Figure 2. The relationship between the aspect ratio of the gold nanorods and AgNO3 concentration. Inset: The relationship between the length and width of the gold nanorods and AgNO3 concentration.
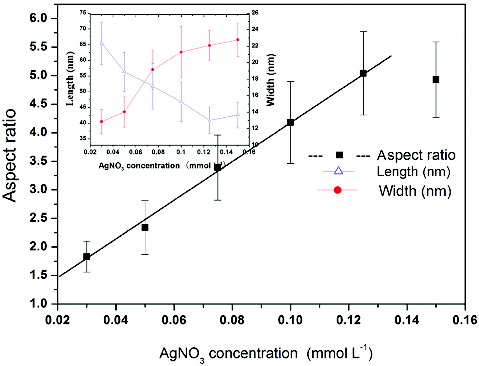
Figure 3. SEM images of the gold nanorods.
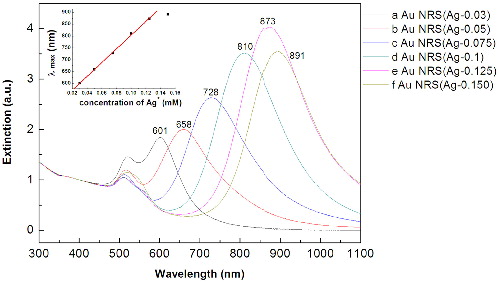
shows the UV–vis–NIR absorption spectra of the as-prepared gold nanorods. According to the AgNO3 concentration in the growth solution, we named the obtained gold nanorods as Au NRs (Ag-n), in which n denotes the concentration of AgNO3, and each spectrum was normalised by its absorption at 400 nm. When the AgNO3 concentration increases, the gold nanorods show strong LSPR bands centred at 601 nm, 655 nm, 725 nm, 810 nm, 870 nm and 890 nm, and weak transverse SPR bands around 512–520 nm. The LSPR bands of the gold nanorods fit linearly with the AgNO3 concentration.
Figure 4. UV–vis–NIR absorption spectra of the gold nanorods prepared when the AgNO3 concentration are as follows: (a) 0.03, (b) 0.05, (c) 0.075, (d) 0.1, (e) 0.125 and (f) 0.15 mmol·L−1. Inset: The relationship between SPR bands versus AgNO3 concentration.
3.2. The surface modification of gold nanorods
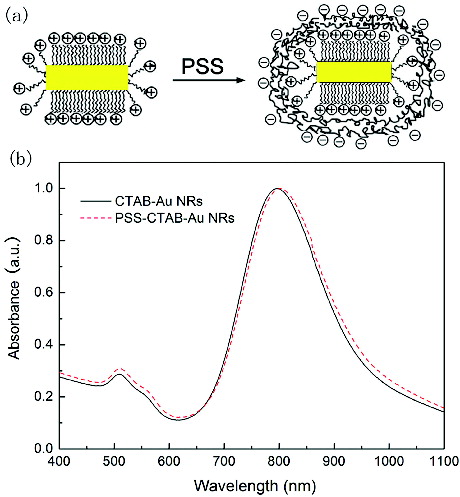
The as-prepared CTAB-capped gold nanorods can disperse well in water; while immediately get uncontrollable aggregation in organic media. It is necessary to make surface modification for improving the stability. The easiest method is to wrap the polyelectrolyte LbL onto the surface of gold nanorods. The zeta-potential data of CTAB-capped gold nanorods is about +20 mV, so negatively charged polyelectrolyte is needed here. In this study, PSS was used. The detailed procedure of the surface modification is given in Section 2. The schematic diagram is shown in (a). After surface modification, the zeta potential data of PSS-capped gold nanorods is −23.8 mV. The UV–vis–NIR absorption spectra of the CTAB-capped and PSS-capped gold nanorods are shown in (b). After surface modification, the LSPR band of gold nanorods redshifts about 3–5 nm. The full width at half maximum (FWHM) remains unchanged, indicating that individual gold nanorods remain.
Figure 5. (a) Schematic diagram of the surface modification of gold nanorods and (b) the UV–vis–NIR absorption spectra of gold nanorods before and after surface modification.
3.3. The sensitivity to the solution refractive index of gold nanorods
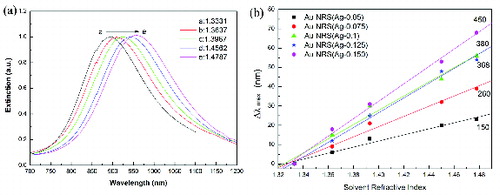
After surface modification, gold nanorods disperse well in water and many organic media, such as DMSO, DMF and ethanol. To investigate the relationship between LSPR peaks and the solution refractive index, the UV–vis–NIR absorption spectra of gold nanorods were collected in water, DMSO and the mixtures of water/DMSO in different volume ratios. The spectra show no obvious change in the FWHM of the LSPR band. The UV–vis–NIR absorption spectra of gold nanorods with aspect ratio 4.93 in water/DMSO solution are shown in (a). The LSPR peak redshifts with increasing the refractive index of the solvent. The results of all the five gold nanorod samples are shown in (b), and good linear relationship between LSPR peaks and the solvent refractive index is achieved. The slopes are 150, 260, 368, 380 and 450 nm·RIU−1. Thus the sensitivity to solvent refractive index increases with the redshift of LSPR band. Therefore, it opens up the potentials of gold nanorods for SPR-based sensing.
Figure 6. (a) UV–vis–NIR absorption spectra of gold nanorods (AgNO3 concentration: 0.15 mmol·L−1) in the mixtures of water and DMSO with different volume ratio and (b) plot depicting the linear relationship between the solvent refractive index and the SPR λmax.
4. Conclusion
In summary, a facile modified seed-mediated growth procedure for gold nanorods preparation has been demonstrated. The growth rate of gold nanorods preparation is lowered by adding H2SO4. Increasing the concentration of AgNO3 yields gold nanorods with different aspect ratio that differed from 1.83 to 5.04. After the surface modification by assembling PSS onto the gold nanorods, the samples can disperse well in water and DMSO. The LSPR peaks redshift with increasing the refractive index of the solvent and good linear relationship is achieved. The sensitivity to solvent refractive index increases with the redshift of LSPR band. Thus it opens up the potentials of gold nanorods for SPR-based sensing.
Acknowledgements
This work is supported by the National Key Basic Research Program973 Project (2010CB933901), Important National Science & Technology Specific Project (2009ZX10004-311), National Natural Scientific Fund (No. 20803040), Special project for nanotechnology from Shanghai (No. 1052nm04100), New Century Excellent Talent of Ministry of Education of China (NCET-08-0350), Shanghai Science and Technology Fund (10XD1406100), the youth fund research project of Yunnan University of Nationalities (2012QN01) and the general program of the application and basic research foundation of Yunnan province (2013FZ080).
References
- Maier SA, Brongersma ML, Kik PG, Meltzer S, Requicha AAG, Atwater HA. Plasmonics - a route to nanoscale optical devices. Adv Mater. 2001;13:1501–1505.
- Murphy CJ, Gole AM, Hunyadi SE, Stone JW, Sisco PN, Alkilany A, Kinard BE, Hankins P. Chemical sensing and imaging with metallic nanorods. Chem Commun. 2008;5:544–557.
- Eghtedari M, Oraevsky A, Copland JA, Kotov NA, Conjusteau A, Motamedi M. High sensitivity of in vivo detection of gold nanorods using a laser optoacoustic imaging system. Nano Lett. 2007;7:1914–1918.
- Jain PK, El-Sayed IH, El-Sayed MA. Au nanoparticles target cancer. Nano Today. 2007;2:18–29.
- Wang YC, Black KCL, Luehmann H, Li WY, Zhang Y, Cai X, Wan DH, Liu SY, Li M, Kim P, Li ZY, Wang LHV, Liu YJ, Xia YA. Comparison study of gold nanohexapods, nanorods, and nanocages for photothermal cancer treatment. ACS Nano. 2013;7:2068–2077.
- Wu X, Chen JY, Brech A, Fang C, Wang J, Helm PJ, Peng Q. The use of femto-second lasers to trigger powerful explosions of gold nanorods to destroy cancer cells. Biomaterials. 2013;34:6157–6162.
- Sivapalan ST, DeVetter BM, Yang TK, Dijk TV, Schulmerich MV, Carney PS, Bhargava R, Murphy CJ. Off-resonance surface-enhanced Raman spectroscopy from gold nanorod suspensions as a function of aspect ratio: not what we thought. ACS Nano. 2013;7:2099–2105.
- Chen HJ, Shao L, Li Q, Wang JF. Gold nanorods and their plasmonic properties. Chem Soc Rev. 2013;42:2679–2724.
- Lee KS, El-Sayed MA. Gold and silver nanoparticles in sensing and imaging: sensitivity of plasmon response to size, shape, and metal composition, J Phys Chem B. 2006;110:19220–19225.
- Vigderman L, Zubarev ER. High-yield synthesis of gold nanorods with longitudinal SPR peak greater than 1200 nm using hydroquinone as a reducing agent. Chem Mat. 2013;25:1450–1457.
- Lohse SE, Murphy CJ. The quest for shape control: a history of gold nanorod synthesis. Chem Mat. 2013;25:1250–1261.
- Sau TK, Murphy CJ. Seeded high yield synthesis of short au nanorods in aqueous solution. Langmuir. 2004;20:6414–6420.
- Nikoobakht B, El-Sayed MA. Preparation and growth mechanism of gold nanorods (NRs) using seed-mediated growth method. Chem Mater. 2003;15:1957–1962.
- Sau TK, Murphy CJ. Room temperature, high-yield synthesis of multiple shapes of gold nanoparticles in aqueous solution. J Am Chem Soc. 2004;126:8648–8649.
- Chen HJ, Kou XS, Yang Z, Ni WH, Wang JF. Shape- and size-dependent refractive index sensitivity of gold nanoparticles. Langmuir. 2008;24:5233–5237.
- Skrabalak SE, Chen J, Au L, Lu X, Li X, Xia Y. Gold nanocages for biomedical applications. Adv Mater. 2007;19:3177–3184.
- Murphy CJ, San TK, Gole AM, Orendorff CJ, Gao JX, Gou L, Hunyadi SE, Li T. Anisotropic metal nanoparticles: synthesis, assembly, and optical applications. J Phys Chem B. 2005;109:13857–13870.
- Ye XC, Zheng C, Chen J, Gao YZ, Murray CB. Using binary surfactant mixtures to simultaneously improve the dimensional tunability and monodispersity in the seeded growth of gold nanorods. Nano Lett. 2013;13:765–771.
- Chen H, Kou X, Yang Z, Ni W, Wang J. Shape- and size-dependent refractive index sensitivity of gold nanoparticles. Langmuir. 2008;24:5233–5237.
- Novo C, Funston AM, Pastoriza-Santos I, Liz-Marzán LM, Mulvaney P. Influence of the medium refractive index on the optical properties of single gold triangular prisms on a substrate. J Phys Chem B. 2008;112:3–7.
- Yu CX, Irudayaraj J. Multiplex biosensor using gold nanorods. Anal Chem. 2007;79:572–579.
- Tian LM, Chen E, Gandra N, Abbas A, Singamaneni S. Gold nanorods as plasmonic nanotransducers: distance-dependent refractive index sensitivity. Langmuir. 2013;28:17435–17442.
- Bridges CR, DiCarmine PM, Seferos DS. Gold nanotubes as sensitive, solution-suspendable refractive index reporters. Chem Mat. 2013;24:963–965.
- Murphy CJ, Jana NR. Controlling the aspect ratio of inorganic nanorods and nanowires. Adv Mater. 2002;14: 80–82.